Status quo of China’s textile machinery industry in the first half of 2017
by+Zhao+Zihan
From January to June in 2017, the main business income, total profit and other economic indicators of the whole textile machinery industry showed doubledigit growth, while the total import and export value of textile machinery products increased year on year, and the performance of textile machinery industry improved obviously.
Economic benefits
Industry scale
From January to June, the revenue from main business of the textile machinery industry reached 61.048 billion yuan, up 12.74% year on year and 10.53 percentage points over the same period of the previous year. The total assets amounted to 100.128 billion yuan, up 5.66% year on year and 2.54 percentage points over the same period of last year. The fixed assets investment was 13.421 billion yuan, down 2.53% year on year.
Cost structure
From January to June, the textile machinery industry saw total cost of 56.807 billion yuan, an increase of 11.85% year on year, of which: the main business cost was 51.594 billion yuan, a year-on-year growth of 12.69%, while the main business cost accounted for 90.82% of the total cost; operating expenses increased by 9.93% year on year to 1.6 billion yuan which accounted for 2.82% of the total cost; the management costs saw a year-on-year growth of 1.60% to 2.998 billion yuan which accounted for 5.28% of the total cost; the financial costs increased by 2.31% year on year to 6.14 billion yuan, accounting for 1.08% of the total.
Benefits
From January to June, the textile machinery industry witnessed a total profit of 4,289 billion yuan, up 23.11% over the same period of last year. The loss of the enterprises running under deficit was 222 million yuan, down 33.73% year on year and the scale of losses reached 14.52%.
Investment in fixed assets
From January to June, the textile machinery industry achieved totaled fixed assets investment of 13.421 billion yuan, down 2.53% year on year, respectively lower than the manufacturing sector (5.5%) and the textile industry (9.11%).
Operation of key enterprises
From January to June in 2017, China Textile Machinery Association made a survey of key enterprises, showing that the total income of the main business was 16.884 billion yuan, up 15.88% year on year and 20.29 percentage points compared with the same pe- riod of last year, while the month-on-month growth was 125.16%, accounting for 27.66% of the total textile machinery industry. The total profit reached 920 million yuan, an increase of 20.50% year on year, accounting for 21.46% of the industry. Of which, the loss rose 12.47% year on year to 3.001 billion yuan, while the scale of loss reached 19.05%. The total cost of key enterprises was 16.024 billion yuan, an increase of 16.04% over the same period of last year. The cost of main business was 13.751 billion yuan, an increase of 16.51% year on year, accounting for 83.78% of the total cost. The operating expenses increased 4.83% year on year to 723 million yuan, accounting for 5.53% of the total; management fees rose by 19.15% year on year to 1.12 billion yuan, accounting for 8.42% of the total cost; financial expenses increased by 12.78% year on year to 337 million yuan, accounting for 2.27% of total cost. The total cost of the industry saw a relatively large growth rate year on year, and the key enterprises are still suffering significant pressure on manufacturing costs.endprint
Imports and exports
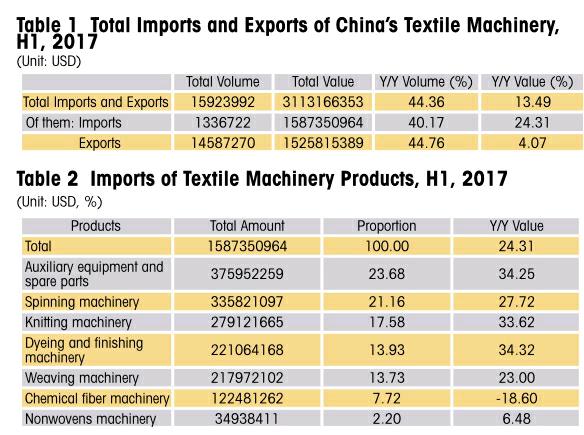
According to the Customs, the import and export of Chinas textile machinery were totaled 3.131 billion US dollars in the first half of 2017 with a year-on-year increase of 13.49%. Specifically speaking, the exports increased by 4.07% year on year to 1.526 billion US dollars, while the imports amounted to 1.587 billion US dollars, an increase of 24.31% year on year. Table 1 reflects the import and export of Chinas textile machinery.
Imports
The total imports from 54 countries and regions in the first half of this year are totaled 1.587 billion US dollars, an increase of 24.31% year on year.
● Imports of textile machinery products
In terms of imported product categories, imports of auxiliary equipment and spare parts came in the first place, with total imports of 376 million US dollars, up 34.25% year on year, accounting for 23.68% of the total. Among seven kinds of products, only chemical fiber machinery showed negative growth, while the auxiliary equipment and spare parts, spinning machinery, knitting machinery and dyeing finishing machinery rose higher than the industry average. (Table 2)
● Main countries and regions of textile machinery imports
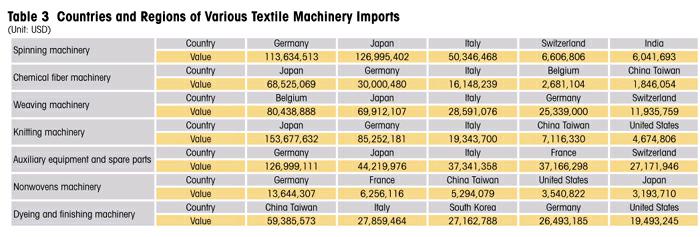
From January to June, the major countries and regions of textile machinery import were dominated by Japan, Germany, Italy, Belgium and China Taiwan. The top five saw trade volumes of 1.269 billion US dollars, up 22.97% year on year, accounting for 80.82% of the total. (Table 4)
Imports from Japan ranked first, which are amounted to 485 million US dollars, up 55.70% year on year, of which: knitting machinery saw a trade volume of 154 million US dollars, down 73.96% year on year.
Imports of textile machinery from the EU accounted for more than 50.00% of total trade volume, while the imports amounted to 825 million US dollars, an increase of 10.06% year on year. Specifically, the auxiliary equipment and spare parts showed a trade volume of 258 million US dollars, up 48.42% year on year, accounting for 31.32%. The details are demonstrated in Table 6.
● Overview of import regions in China
25 provinces and autonomous regions all over the country saw different amounts of imports during the first half of this year. Jiangsu, Guangdong, Zhejiang, Shanghai and Shandong provinces and cities ranked the top five, accounting for 78.60% of total imports. Jiangsu Province ranked first with total imports of 458 million US dollars, an increase of 31.55% year on year, accounting for 28.87%. Table 7 reflects the import of textile machinery in the top five provinces and cities.endprint

Exports
Chinas textile machinery witnessed total exports of 1.526 billion US dollars in the first six months this year, an increase of 4.07% year on year.
● Exports of textile machinery products
According to the Customs, from January to June, Chinas textile machinery exports are classified as in Table 8.
Knitting machinery exports amounted to 502 million US dollars, down 0.23% year on year, accounting for 32.93%, ranking first, followed by dyeing and finishing machinery, auxiliary equipment and spare parts, weaving machinery, spinning machinery, chemical fiber machinery and nonwovens machinery.
● Main trading partners in exports
From January to June, Chinas textile machinery were exported to 166 countries and regions, while the top five export countries and regions are shown in Table 9.
In the first half this year, a total of 30 provinces and autonomous regions presented exports of textile machinery, accounting for 81.11% of the total exports. The details are shown in Table 10.
In summary, thanks to the overall stable operation of domestic textile industry as well as the demand recovery at home and abroad, the textile machinery industry has enjoyed somewhat improvement in various economic operation indicators, presenting positive growth in both import and export value. The industry has made great efforts to adjust and optimize the industrial structure under the Belt and Road Initiative, showcasing better performances in the first half of this year than the same period last year. endprint

