
Optical coherence tomography and T cell gene expression analysis in patients with benign multiple sclerosis
2017-09-04 07:27:38JohnSoltysQinWangYangMaoDraayer
中国神经再生研究(英文版) 2017年8期
John Soltys, Qin Wang, Yang Mao-Draayer,
1 Present Address: University of Colorado Medical Scientist Training Program (MSTP), Aurora, CO, USA
2 Department of Neurology, University of Michigan Medical School, Ann Arbor, MI, USA
Optical coherence tomography and T cell gene expression analysis in patients with benign multiple sclerosis
John Soltys1, Qin Wang2, Yang Mao-Draayer2,*
1 Present Address: University of Colorado Medical Scientist Training Program (MSTP), Aurora, CO, USA
2 Department of Neurology, University of Michigan Medical School, Ann Arbor, MI, USA
How to cite this article:Soltys J, Wang Q, Mao-Draayer Y (2017) Optical coherence tomography and T cell gene expression analysis in patients with benign multiple sclerosis. Neural Regen Res 12(8):1352-1356.
Benign multiple sclerosis is a retrospective diagnosis based primarily on a lack of motor symptom progression. Recent fi ndings that suggest patients with benign multiple sclerosis experience non-motor symptoms highlight the need for a more prospective means to diagnose benign multiple sclerosis early in order to help direct patient care. In this study, we present optical coherence tomography and T cell neurotrophin gene analysis fi ndings in a small number of patients with benign multiple sclerosis. Our results demonstrated that retinal nerve fi ber layer was mildly thinned, and T cells had a distinct gene expression prof i le that included upregulation of interleukin 10 and leukemia inhibitory factor, downregulation of interleukin 6 and neurotensin high af fi nity receptor 1 (a novel neurotrophin receptor).ese fi ndings add evidence for further investigation into optical coherence tomography and mRNA prof i ling in larger cohorts as a potential means to diagnose benign multiple sclerosis in a more prospective manner.
neurotensin high af finity receptor 1; benign multiple sclerosis; optical coherence tomography; interleukin 10; T cell; leukemia inhibitory factor; optic neuritis; neural regeneration
Introduction
Diagnosis of benign multiple sclerosis (BMS) is a clinical challenge. BMS diagnosis is primarily retrospective and is heavily weighted towards motor progression, and in particular depends on a condition that an Expanded Disability Status Scale (EDSS) ≤ 3 aer at least 10 or 15 years of disease onset without disease modifying therapy (DMT) (Ramsaransing and De Keyser, 2006; Zimmermann et al., 2013). However, recent reports have demonstrated that BMS patients experience a range of non-motor symptoms including cognitive dysfunction, pain and depression (Hviid et al., 2011; Sayao et al., 2011; Correale et al., 2012).us, identifying a prospective means to diagnose BMS has signif i cant implications for treatment and patient management as these symptoms can negatively impact quality of life. Investigating the plausibility of using newer technologies to diagnose BMS represents one approach to achieve this goal.
In this study, we reported a small case series of BMS patients with their clinical course, magnetic resonance imaging (MRI), optical coherence tomography (OCT) and T cell gene expression analysis in our study. We provide evidence that OCT and mRNA prof i ling represent plausible technologies to pursue in larger cohorts that aim to further dif f erentiate BMS from progressive MS.
Subjects and Methods
Subjects
The study was conducted in compliance with the principles of theDeclaration of Helsinki. The University of Vermont institutional review board reviewed and approved the study protocol (approval No. CHRMS09-092). All patients provided written informed consent. Three patients with BMS were recruited from the Multiple Sclerosis Center at the University of Vermont.e diagnosis of BMS was based on an Expanded Disability Status Scale (EDSS) ≤ 3 aer at least 10 or 15 years of disease onset (Ramsaransing and De Keyser, 2006). Since disease modifying therapy (DMT) use/non-use was signif i cantly associated with maintaining a benign disease state (Zivadinov et al., 2016) and also can modulate the loss of retinal nerve fi ber layer (RNFL; Button et al., 2017), we focused on patients with BMS who maintain a non-progressive benign status without prior treatment with DMT.
OCT scanning
T cell isolation and culture
T cell isolation, activation and culture were performed according to a previous study by Soltys et al. (2014). Briefly, peripheral blood mononuclear cells (PBMCs) were obtained from the whole blood by standard Ficoll gradient centrifugation. T cells were isolated from this cell population using a Pan T cell isolation kit (Miltenyi Biotech Inc. Auburn, CA, USA) according to manufacturer protocol. In brief, non-T cells were bound with biotin conjugated antibodies against CD14, CD16, CD19, CD36, CD56, CD123, and glycophorin A.ese cells were captured with anti-biotin microbeads and magnetically depleted by passing the cells through the column (negative selection) to produce a highly pure (90–97%) population of T cells. Cell purity was conf i rmed by fl ow cytometry using human T cell receptor (TCR) staining (FITC conjugated mouse anti-human TCR standard FiPharmingen). Isolated T cells were cultured in T cell complete media (RPMI media, 10% fetal calf serum, 2.5 g/L glucose, 2 nM glutamine, 10 µg/ mL folate, 1 mM pyruvate, 50 µM 2-mercaptoethanol). Cultures were stimulated with human anti-CD3 and anti-CD28 monoclonal antibodies (5 µg/106cells) and cultured for 48 hours, at 37°C and 5% CO2. Prior to RNA extraction, all cells were collectedviacentrifugation and the supernatants immediately frozen at –80°C for protein analysis.
mRNA isolation
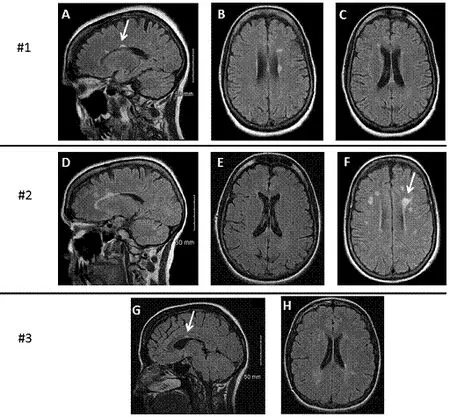
Figure 1 MRI findings in the brain of three patients with benign multiple sclerosis.
mRNA isolation and profiling were described according to previous reports (Soltys et al., 2014; Wang et al., 2015). In brief, RNA was extracted from T cells using the RNeasy RNA Extraction Kit (Qiagen). RNA quality control and integrity were assessed with an Agilent 2100 Bioanalyzer (Agilent Technologies Inc. Santa Clara, CA, USA). Absence of genomic DNA contamination was conf i rmed by RT-qPCR. RNA samples were reverse transcribed to cDNA using the SuperArray RT2 First Strand Kit (Invitrogen, Thermo Fisher Scientific, Waltham, MA, USA), according to manufacturer protocol.
Gene array and real time-quantitative polymerase chain reaction (RT-qPCR)
RNA (200 ng) was reversed transcribed to cDNA using the SuperArray RT-2 First-Strand cDNA synthesis kit (SA Biosciences, QIAGEN Inc., Germantown, MD, USA). cDNA samples were run on the SuperArray plate “Neurotrophins and Receptors” (PAHS-31A, SABiosciences, QIAGEN Inc., Germantown, MD, USA) using Applied Biosystems 7900HT (Applied Biosys-tems Inc., Foster City, CA, USA), to analyze 84 neurotrophic factors and receptors, and 5 housekeeping genes.
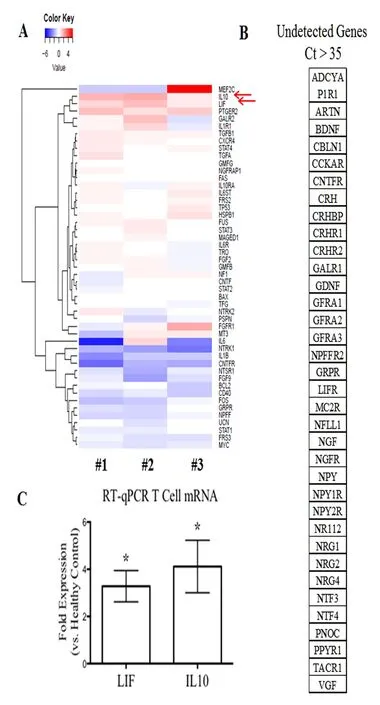
Figure 2 mRNA gene prof i ling of T cells isolated from each patient with benign multiple sclerosis.
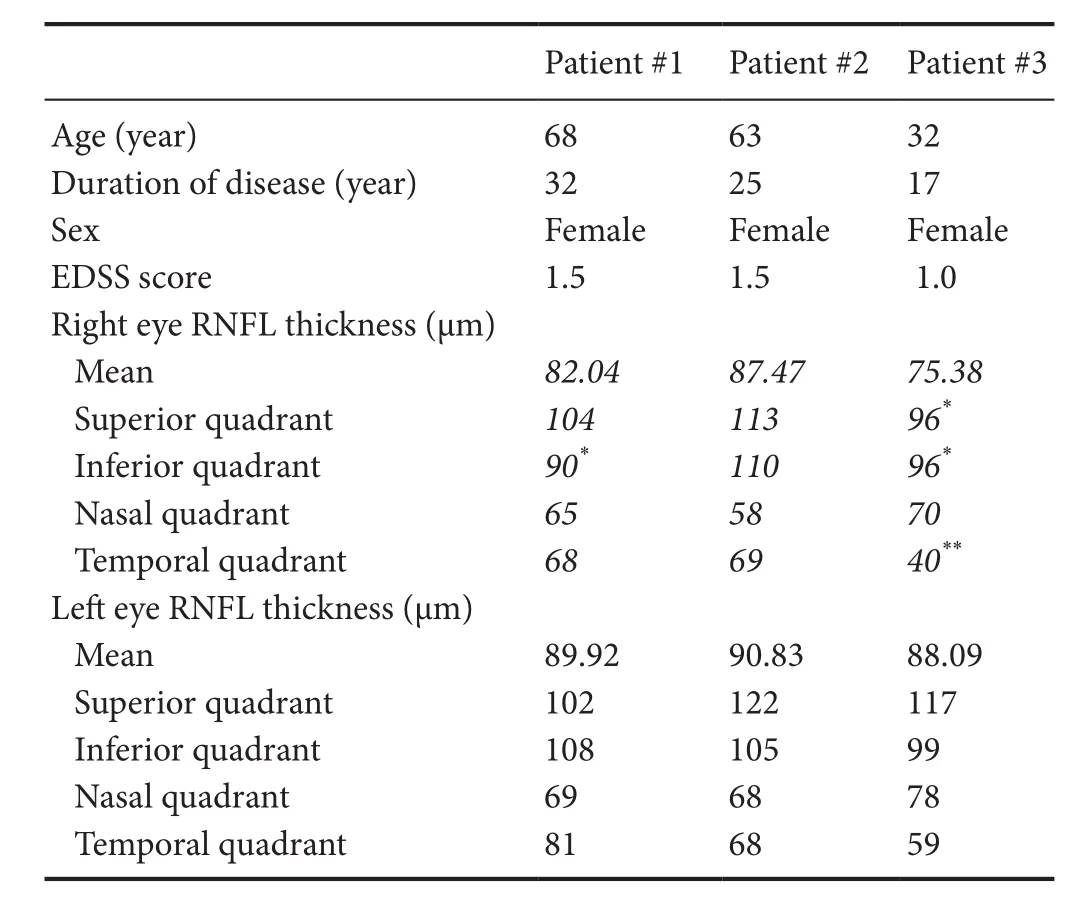
Table 1 Patient demographics and OCT data
Results were quanti fi ed using the 2-ample method and expressed as a fold di ff erence with respect to the healthy control group (n= 5, 4 females and 1 male, aged 33 ± 12 years, recruited from the Multiple Sclerosis Center at the University of Vermont, USA). For all analysis, a Ct cuto ff of > 35 was used to define a gene as undetectable. All prepared graphs and statistical analyses were run using GraphPad®Prism software (GraphPad Software Inc.). Analysis of variance and Benjamini-Hochberg post-test were used to determine signi fi cance.e candidate genes were further con fi rmed by RT-qPCR using Applied Biosystems 7500 (ermo Scienti fi c, Grand Island, NY, USA). RT-qPCR method was described in previous studies (Soltys et al., 2014; Wang et al., 2015). Amplifi cation consisted of 40 cycles of 95°C for 15 seconds and 60°C for 1 minute with approximately 15 ng/µL cDNA. TaqMan Master Mix and speci fi c primer pairs for leukemia inhibitory factor (LIF) and interleukin-10 (IL-10) were purchased from Applied Biosystems (assay on demands primers) (Applied Biosystems Inc., Foster City, CA, USA). RT-qPCR was performed using Taqman®Master Mix (Applied Biosystems Inc.,) and applied Biosystems 7500 Fast Software (Applied Biosystems Inc.).
Statistical analysis
SuperArray statistical analysis was done with the PCR Data Array Web Portal provided by SABiosciences. Pairwise comparisons between groups of experimental replicates were performed. A level ofP< 0.05 was considered statistically significant. Analysis of variance and Benjamini-Hochberg post-test were used to determine signif i cance. Data were exported and all prepared graphs and statistical analyses were run using GraphPad®Prism 6 soware (GraphPad Soware Inc., San Diego, CA, USA).
Results
Patient #1
Patient #2
Patient #3
We performed OCT on each patient. Patient age, disease duration, EDSS at the time of OCT, and blood drawing (described below) are summarized in Table 1. Of note, in these patients, the EDSS was only 1.0–1.5 despite disease duration ranging from 17 to 32 years. The mean RNFL thickness was mildly decreased in the optic neuritis affected eyes while healthy non-optic neuritis eyes had relatively normal RNFL (Table 1).
We isolated T cells from peripheral blood samples of each patient and healthy control. T cell mRNA was extracted aer 48 hours of culture with anti-CD3 and anti-CD28 antibodies. A SuperArray gene analysis using a “Neurotrophins and Receptors” plate (PAHS-31A, SABiosciences) was done to screen for potential genes of interests (Figure 2A). The fold changes were then confirmed using RT-qPCR against healthy controls (Figure 2C) (detailed methods see previous publication in Soltys et al., 2014). The mRNA levels of IL-10 and LIF were signif i cantly increased in T cells of patients with BMS (Figure 2A).
Discussion
Despite long-standing disease in our patients, there is minimal deterioration in healthy eyes. One hypothesis may be that a more benign clinical course can be predicted by a slower rate of RNFL deterioration in healthy eyes, compared to more aggressive forms of MS (Syc et al., 2012; Zimmermann et al., 2013; Galetta et al., 2015; Martinez-Lapiscina et al., 2016). Our data in Table 1 support the hypothesis that the non-ON eyes have normal values in BMS patients.
We therefore attempted to identify molecular signatures of BMS. Recent evidence suggests that T cell-mediated inf l ammation may be beneficial and neuroprotective via altered neurotrophin production in MS (Correale and Villa, 2004; Soltys et al., 2014; Wang and Mao-Draayer, 2015; Johnson et al., 2016). To the best of our knowledge, the distinct neurotrophic factor/cytokine contributions from specif i c cell populations have not been studied in BMS. In this study, we isolated T cells, the key mediators of MS immunopathogenesis, from peripheral blood samples of three patients with benign MS. A SuperArray gene analysis was performed to screen for neurotrophin and neurtrophin receptor related genes. BMS patients demonstrate signif i cantly elevated mRNA levels of IL-10 and LIF in T cells, which was consistent with previous studies showing that mRNA expression of IL-10 and LIF in peripheral blood mononuclear cells was elevated in patients with stable MS than in patients with active MS (Byskosh and Reder, 1996; Krakauer et al., 2008; Metcalfe et al., 2015). Furthermore, the mRNA levels of IL-6, novel neurotrophin receptor, and neurotensin high af finity receptor 1 were decreased in patients with BMS than in healthy controls.is supports our previous report that interferon-β treatment can induce the expression of anti-inflammatory cytokines and upregulate neurotensin high affinity receptor 1 in T cells (Soltys et al., 2014; Wang and Mao-Draayer, 2015). IL-6, secreted by T cells and macrophages during infection and trauma, acts mostly as pro-inflammatory cytokine in MS (Melamed et al., 2015). IL-6 together with transforming growth factor-β mediates Th17/Treg balances by promoting17 development and accelerating FoxP3 degradation (Kimura and Kishimoto, 2010).erefore, decreased IL-6 in T cells from the BMS patients could be another surrogate marker for BMS. Although we cannot generalize the potential roles of these specif i c factors given our small sample size, our fi ndings show that a more benign clinical course leads to a more distinct neurotrophin gene expression profile which in combination with OCT measurement could serve as biomarkers to aid the diagnosis of BMS. Further investigations with larger cohorts over time will allow us to extend our observation.
This study provides evidence that OCT and T cell neurotrophin mRNA gene expression prof i ling represents plausible technologies to help differentiate BMS from progressive MS. However, in this study, only three patients with benign MS were recruited.erefore, OCT studies involving a larger cohort of patients with gene expression prof i le are needed to confirm our findings. Given the diverse presentations of clinical courses in BMS patients, it is likely that neither approach alone will suffice. A collaborative approach that correlates routine imaging fi ndings (MRI, OCT) to blood and CSF biomarkers, EDSS and non-motor symptoms may best capture the range of benign clinical courses in a more prospective manner.
Acknowledgments:We thank the Center of Biomedical Research Excellence (COBRE) at the University of Vermont for their support and equipment access, and the UVM Cancer Center DNA Analysis Facility for their assistance with our SuperArray assays. We thank our ophthalmology technician Jef f rey Abell for performing optical coherence tomography and Patricia Shea for helping with the case review.
Author contributions:YMD designed this study, recruited patients and wrote the paper. JS and QW were responsible for data collection and also participated in the writing of this paper. All authors approved the fi nal version of this paper.
Conf l icts of interest:None declared.
Research ethics:
Declaration of patient consent:The authors certify that they have obtained all appropriate patient consent forms. In the form, the patients have given their consent for their images and other clinical information to be reported in the journal.e patients understand that their names and initials will not be published and due ef f orts will be made to conceal their identity, but anonymity cannot be guaranteed.
Data sharing statement:
Plagiarism check:Checked twice by ienticate.
Peer review:Externally peer reviewed.
Open access statement:
Open peer review report:
Reviewer: Chunjian Huang, National Jewish Health, USA.
Additional fi le: Open peer review report 1.
Balk L, Tewarie P, Killestein J, Polman C, Uitdehaag B, Petzold A (2014) Disease course heterogeneity and OCT in multiple sclerosis. Mult Scler 20:1198-1206.
Button J, Al-Louzi O, Lang A, Bhargava P, Newsome SD, Frohman T, Balcer LJ, Frohman EM, Prince J, Calabresi PA, Saidha S (2017) Disease-modifying therapies modulate retinal atrophy in multiple sclerosis: a retrospective study. Neurology 88:525-532.
Byskosh PV, Reder AT (1996) Interferon beta-1b effects on cytokine mRNA in peripheral mononuclear cells in multiple sclerosis. Mult Scler 1:262-269.
Cettomai D, Pulicken M, Gordon-Lipkin E, Salter A, Frohman TC, Conger A, Zhang X, Cutter G, Balcer LJ, Frohman EM, Calabresi PA (2008) Reproducibility of optical coherence tomography in multiple sclerosis. Arch Neurol 65:1218-1222.
Correale J, Villa A (2004)e neuroprotective role of inf l ammation in nervous system injuries. J Neurol 251:1304-1316.
Correale J, Peirano I, Romano L (2012) Benign multiple sclerosis: a new def i nition of this entity is needed. Mult Scler 18:210-218.
Cruz-Herranz A, Balk LJ, Oberwahrenbrock T, Saidha S, Martinez-Lapiscina EH, Lagreze WA, Schuman JS, Villoslada P, Calabresi P, Balcer L, Petzold A, Green AJ, Paul F, Brandt AU, Albrecht P; IMSVISUAL consortium (2016) The APOSTEL recommendations for reporting quantitative optical coherence tomography studies. Neurology 86:2303-2309.
Dörr J, Wernecke KD, Bock M, Gaede G, Wuerfel JT, Pfueller CF, Bellmann-Strobl J, Freing A, Brandt AU, Friedemann P (2011) Association of retinal and macular damage with brain atrophy in multiple sclerosis. PLoS One 6:e18132.
Galetta SL, Villoslada P, Levin N, Shindler K, Ishikawa H, Parr E, Cadavid D, Balcer LJ ( 2015) Acute optic neuritis: unmet clinical needs and model for new therapies. Neurol Neuroimmunol Neuroinf l amm 2:e135.
Huang-Link YM, Fredrikson M, Link H (2015) Benign multiple sclerosis is associated with reduced thinning of the retinal nerve fi ber and ganglion cell layers in non-optic-neuritis eyes. J Clin Neurol 11:241-247.
Hviid LE, Healy BC, Rintell DJ, Chitnis T, Weiner HL, Glanz BI (2011) Patient reported outcomes in benign multiple sclerosis. Mult Scler 17:876-884.
Johnson MC, Pierson ER, Spieker AJ, Nielsen AS, Posso S, Kita M, Buckner JH, Goverman JM (2016) Distinct T cell signatures def i ne subsets of patients with multiple sclerosis. Neurol Neuroimmunol Neuroinf l amm 3:e278.
Kimura A, Kishimoto T (2010) IL-6: regulator of Treg/17 balance. Eur J Immunol 40:1830-1835.
Krakauer M, Sorensen P, Khademi M, Olsson T, Sellebjerg F (2008) Increased IL-10 mRNA and IL-23 mRNA expression in multiple sclerosis: interferon-beta treatment increases IL-10 mRNA expression while reducing IL-23 mRNA expression. Mult Scler 14:622-630.
Lange AP, Zhu F, Sayao AL, Sadjadi R, Alkabie S, Traboulsee AL, Costello F, Tremlett H (2013) Retinal nerve fi ber layer thickness in benign multiple sclerosis. Mult Scler 19:1275-1281.
Martinez-Lapiscina EH, Arnow S, Wilson JA, Saidha S, Preiningerova JL, Oberwahrenbrock T, Brandt AU, Pablo LE, Guerrieri S, Gonzalez I, Outteryck O, Mueller AK, Albrecht P, Chan W, Lukas S, Balk LJ, Fraser C, Frederiksen JL, Resto J, Frohman T, et al. (2016) Retinal thickness measured with optical coherence tomography and risk of disability worsening in multiple sclerosis: a cohort study. Lancet Neurol 15:574-584.
Melamed E, Levy M, Waters PJ, Sato DK, Bennett JL, John GR, Hooper DC, Saiz A, Bar-Or A, Kim HJ, Pandit L, Leite MI, Asgari N, Kissani N, Hintzen R, Marignier R, Jarius S, Marcelletti J, Smith TJ, Yeaman MR, et al. (2015) Update on biomarkers in neuromyelitis optica. Neurol Neuroimmunol Neuroinf l amm 2:e134.
Metcalfe SM, Strom TB, Williams A, Fahmy TM (2015) Multiple sclerosis and the LIF/IL-6 axis: use of nanotechnology to harness the tolerogenic and reparative properties of LIF. Nanobiomedicine 2:5.
Oberwahrenbrock T, Schippling S, Ringelstein M, Kauold F, Zimmermann H, Keser N, Young KL, Harmel J, Hartung HP, Martin R, Paul F, Aktas O, Brandt AU (2012) Retinal damage in multiple sclerosis disease subtypes measured by high-resolution optical coherence tomography. Mult Scler Int 2012:530305.
Patella VM (2010) Stratus OCT: Establishment of normative reference values for retinal nerve fi ber layer thickness measurements. Carl Zeiss Meditec Web site. Available at: http://www.meditec.zeiss.de/88256DE3007B-916B/0/55B63359D850E15D882575E7000AA4AE/$file/stratusoct5_ en.pdf. Accessed February 27, 2010.
Ramsaransing GS, De Keyser J (2006) Benign course in multiple sclerosis: a review. Acta Neurol Scand 113:359-369.
Saidha S, Syc SB, Durbin MK, Eckstein C, Oakley JD, Meyer SA, Conger A, Frohman TC, Newsome S, Ratchford JN, Frohman EM, Calabresi PA (2011) Visual dysfunction in multiple sclerosis correlates better with optical coherence tomography derived estimates of macular ganglion cell layer thickness than peripapillary retinal nerve fi ber layer thickness. Mult Scler 17:1449-1463.
Sayao AL, Bueno AM, Devonshire V, Tremlett H (2011)e psychosocial and cognitive impact of longstanding ‘benign’ multiple sclerosis. Mult Scler 17:1375-1383
Sergott RC, Bennett JL, Rieckmann P, Montalban X, Mikol D, Freudensprung U, Plitz T, van Beek J; ATON Trial Group (2015) ATON: results from a Phase II randomized trial of the B-cell-targeting agent atacicept in patients with optic neuritis. J Neurol Sci 351(1-2):174-178.
Soltys J, Knight J, Scharf E, Pitt D, Mao-Draayer Y (2014) IFN-β alters neurotrophic factor expression in T cells isolated from multiple sclerosis patients - implication of novel neurotensin/NTSR1 pathway in neuroprotection. Am J Transl Res 6:312-319.
Syc SB, Saidha S, Newsome SD, Ratchford JN, Levy M, Ford E, Crainiceanu CM, Durbin MK, Oakley JD, Meyer SA, Frohman EM, Calabresi PA (2012) Optical coherence tomography segmentation reveals ganglion cell layer pathology aer optic neuritis. Brain 135(Pt 2):521-533.
Wang Q, Chuikov S, Taitano S, Wu Q, Rastogi A, Tuck SJ, Corey JM, Lundy SK, and Mao-Draayer Y (2015) Dimethyl fumarate protects neural stem/progenitor cells and neurons from oxidative damage through Nrf2-ERK1/2 MAPK pathway. Int J Mol Sci 16:13885-13907.
Wang Q, Mao-Draayer Y (2015) Neuroprotective ef f ect of IFN-β treatment is involved in neurotrophic factors and novel NT/NTSR1 pathway. Neural Regen Res 10:1932-1933.
Zimmermann H, Freing A, Kaufhold F, Gaede G, Bohn E, Bock M, Oberwahrenbrock T, Young KL, Dörr J, Wuerfel JT, Schippling S, Paul F, Brandt AU (2013) Optic neuritis interferes with optical coherence tomography and magnetic resonance imaging correlations. Mult Scler 19:443-150.
Zivadinov R, Cookfair DL, Krupp L, Miller AE, Lava N, Coyle PK, Goodman AD, Jubelt B, Lenihan M, Herbert J, Gottesman M, Snyder DH, Apatof f BR, Teter BE, Perel AB, Munschauer F, Weinstock-Guttman B (2016) Factors associated with benign multiple sclerosis in the New York State MS Consortium (NYSMSC). BMC Neurol 16:102.
Copyedited by Li CH, Song LP, Zhao M
*< class="emphasis_italic">Correspondence to: Yang Mao-Draayer, M.D., Ph.D., maodraay@umich.edu.
Yang Mao-Draayer, M.D., Ph.D., maodraay@umich.edu.
orcid: 0000-0001-6248-3480 (Yang Mao-Draayer)
10.4103/1673-5374.213558
Accepted: 2017-07-22
- 中国神经再生研究(英文版)的其它文章
- A progressive compression model of thoracic spinal cord injury in mice: function assessment and pathological changes in spinal cord
- A novel triple immunoenzyme staining enables simultaneous identif i cation of all muscle fi ber types on a single skeletal muscle cryosection from normal, denervated or reinnervated rats
- Impact of Pitx3 gene knockdown on glial cell linederived neurotrophic factor transcriptional activity in dopaminergic neurons
- Dried Rehmannia root protects against glutamateinduced cytotoxity to PC12 cells through energy metabolism-related pathways
- Dexmedetomidine mitigates isof l urane-induced neurodegeneration in fetal rats during the second trimester of pregnancy
- Cold water swimming pretreatment reduces cognitive def i cits in a rat model of traumatic brain injury