四平市雾霾大气颗粒物污染特征和来源分析
2017-07-13 05:21孙玉伟祁昕刘烨
安徽农业科学 2017年2期
孙玉伟 祁昕 刘烨
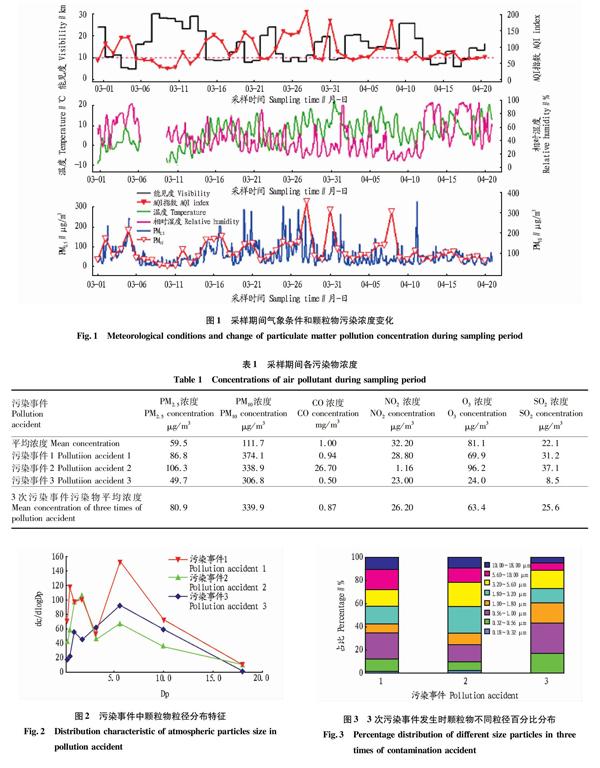
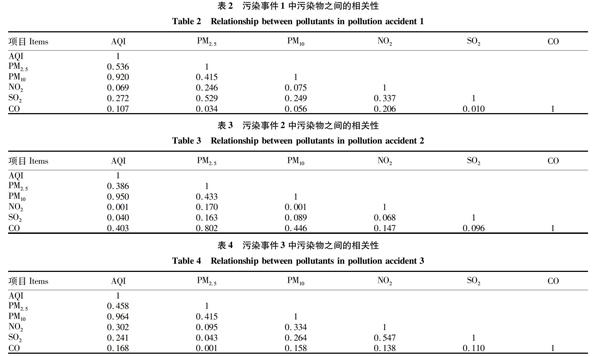
摘要[目的]研究四平市雾霾天气发生时大气颗粒物污染特征。[方法]于2016年3月1日—4月20日对四平市大气颗粒物PM2.5、PM10和气体污染物进行采样,分析采样期间3次污染事件发生时大气颗粒物粒径分布特征,比较颗粒物与相关气体污染物的相关性,并对其来源进行分析。[结果]在3次污染事件中,PM10的平均浓度为339.9 μg/m3,是采样期间的3.0倍,是空气质量标准(GB 3095—2012)的2.0倍;在污染事件1(3月28日)和2(3月31日)发生时,PM2.5浓度也相应升高,分别是空气质量标准(GB 3095—2012)的1.2倍和1.4倍。污染事件1和污染事件2中,在粒径0.56~1.00 μm时颗粒物质量浓度出现峰值,而污染事件3(4月8日)并无相应的峰值出现。[结论]该研究为四平市大气污染防治提供理论依据。
关键词 PM2.5;PM10;污染事件;颗粒物粒径分布;来源分析
中图分类号 X831 文献标识码 A 文章编号 0517-6611(2017)02-0063-03
Abstract[Objective] To research pollution characteristic of atmospheric particulates when fog and haze occurred.[Method] A measurement program of PM2.5 and PM10 was undertaken in Siping City during March 1 to April 20 in 2016, atmospheric particles size distribution and correlations of atmospheric particles and gas pollutant were analyzed when air pollution accident occurred. In addition, the sources of atmospheric particles in air pollution accident were analyzed.[Result]In three air pollution accidents,the average concentration of PM10reached 339.9 μg/m3, which was 3.0 and 2.0 times respectively of sampling period and the air quality standard (GB 3095—2012). When air pollution accident 1 and 2 occured, the concentrations of PM2.5 also rose accordingly, which were 1.2 and 1.4 times respectively of air quality standard (GB 3095—2012).There were peak values when particle size ranged 0.56 to 1.00 μm in pollution accident 1 and 2.However, there was not response peak in pollution accident 3.[Conclusion]The study provides theoretical basis for the prevention and control of atmospheric pollution in siping city.
Key words PM2.5; PM10;Pollution accident;Particles size distribution;Source analysis
隨着我国经济的持续快速增长,大气颗粒物已成为大多数城市的首要污染物[1]。雾霾是空气污染和气象因素共同作用的结果,雾霾天气发生时,大气能见度下降,大气中的颗粒物特别是PM2.5是导致能见度降低的主要因素[2]。秋冬季是我国北方地区和中东部地区雾霾天气频发的季节,给人们的交通出行、生产生活以及身体健康造成严重的不良影响[3]。四平市地处松辽平原腹地,吉辽2省交界。为研究四平市大气颗粒物粒径分布特征和气体污染物的浓度水平,笔者于2016年3月1日—4月20日对四平市大气颗粒物和气体污染物进行采样,分析了雾霾发生时大气颗粒物粒径分布特征,并对其来源进行分析。
1 数据来源与研究方法
1.1 数据来源
采样点位于吉林师范大学环境科学与工程学院分析测量中心楼顶,距地面高约20 m,周围无障碍物及工矿企业,采样口距楼顶地面1 m左右,楼顶由防水材料覆盖,基本无二次扬尘的影响。
PM2.5浓度数据由赛默飞公司5030型颗粒物同步混合监测仪(SHARP)在线监测器连续监测获得;颗粒物粒径分布数据采用MOUDI 8级串联撞击式采样器(Model 100,美国MSP公司)获得,流量30 L/min,粒径为0.18~0.32、0.32~0.56、0.56~1.00、1.00~1.80、1.80~3.20、3.20~5.60、5.60~10.00、10.00~18.00 μm;气体污染物数据由四平市环保监测站提供。
1.2 研究方法
于2016年3月1日—4月20日对四平市大气颗粒物和气体污染物进行采样,分析雾霾发生时大气颗粒物粒径分布特征,并对其来源进行分析。
2 结果与分析
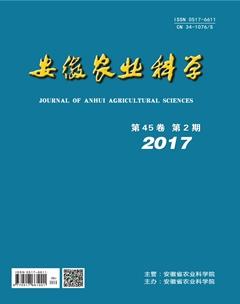
2.1 采样期间气象条件和污染物浓度
由图1可知,采样期间平均能见度为15.2 km,平均温度为4.1 ℃,平均相对湿度为54.3%。在整个观测期间,四平市空气质量属于轻度污染或者以上(AQI≥100)的时间占27%。其中,中度污染及以上(AQI≥150)的时间占6%,重度污染及以上(AQI≥200)的时间占2%。3月28日、3月31日AQI指数分别为209、182,能见度均小于10 km,相对湿度大于80%,即发生了雾霾污染。而在4月8日AQI指数达178,能见度为13.9 km,由于当天风沙较大,引起地面扬尘,从而导致沙尘天气的发生。分别将3月28日、3月31日和4月8日定义为污染事件1、污染事件2和污染事件3。
猜你喜欢
校园英语·上旬(2019年2期)2019-04-08
环境保护与循环经济(2017年2期)2017-09-26
中国交通信息化(2016年6期)2016-06-06
海洋气象学报(2016年3期)2016-02-28
气象研究与应用(2016年4期)2016-02-27
赤峰学院学报·自然科学版(2015年20期)2015-12-26
赤峰学院学报·自然科学版(2015年20期)2015-12-26
化工进展(2015年3期)2015-11-11
浙江大学学报(工学版)(2015年1期)2015-03-01