Laboratory investigations of the thermal strain of frozen soils, using fiber-optic strain gauges based on Bragg gratings
Aleksey Marchenko, Nicolai Vasiliev, Artem Nesterov, Yuri Kondrashov, Nikolay Belyaev
1. Department of Arctic Technology, UNIS, P.O. Box 156, Longyearbyen, N-9171, Norway
2. The Laboratory of Static Research of Soils, JSC "Vedeneev VNIIG", 21, Gzhatskaya, St. Petersburg 195220, Russia
3. Peter the Great St. Petersburg Polytechnic University (SPbPU), 29, Politechnicheskaya, St. Petersburg 195251, Russia
4. The Laboratory of Static Research of Soils, JSC "Vedeneev VNIIG", 21, Gzhatskaya, St. Petersburg 195220, Russia
5. Peter the Great St. Petersburg Polytechnic University (SPbPU), 29, Politechnicheskaya, 195251 St. Petersburg, Russia
Laboratory investigations of the thermal strain of frozen soils, using fiber-optic strain gauges based on Bragg gratings
Aleksey Marchenko1, Nicolai Vasiliev2*, Artem Nesterov3, Yuri Kondrashov4, Nikolay Belyaev5
1. Department of Arctic Technology, UNIS, P.O. Box 156, Longyearbyen, N-9171, Norway
2. The Laboratory of Static Research of Soils, JSC "Vedeneev VNIIG", 21, Gzhatskaya, St. Petersburg 195220, Russia
3. Peter the Great St. Petersburg Polytechnic University (SPbPU), 29, Politechnicheskaya, St. Petersburg 195251, Russia
4. The Laboratory of Static Research of Soils, JSC "Vedeneev VNIIG", 21, Gzhatskaya, St. Petersburg 195220, Russia
5. Peter the Great St. Petersburg Polytechnic University (SPbPU), 29, Politechnicheskaya, 195251 St. Petersburg, Russia
Measurements of the thermal deformations of frozen soil samples were performed in the cold laboratory in temperature range from 0 °C to −12 °C. Fiber Bragg Gratings strain and temperature sensors were used to measure the deformation and temperature inside the samples. A number of tests with the samples prepared from Kaolin and Cambrian clay saturated with fresh water, and prepared from fine and silt sand saturated with fresh or saline water, are performed. Thermal deformations of the samples are analyzed depending on the cyclic changes of their temperature.
thermal expansion; frozen soil; sand; clay; fiber-optic sensors; hysteresis
1 Introduction
Building and operation of engineering constructions in cold regions meet difficulties due to the formation and propagation of thermal contraction cracks. Because of the extreme cold weather, the depth of the cracks reaches a few meters, with opening widths of 15~20 cm. Over the next few months, the snow melts; the remaining water fills the cracks and then freezes under the influence of cold flux from the permafrost. These tiny cracks penetrate into the permafrost (Figure 1) (Petersenet al., 2015). In the summer months, water fills the cracks, freezes and expands. It influences the crack growth and the formation of ice wedges. As this process continues over many years, ice wedges can reach the size of a swimming pool. The ice wedge usually appears in a polygonal pattern, known as an ice wedge polygon. As a result, destruction of engineering constructions and underground utility systems may happen. The cracks constitute an especially great danger for earth-filled dams, piles encased with soil, roads, underground storage areas, airfield pavements, power transmission lines, pipelines, communication cables, and other linear structures.
The formation of thermal contraction cracks is directly connected with the thermal expansion/contraction of frozen soils. This paper is dedicated to the experimental study of thermal expansion of frozen soils saturated with fresh or saline water. We investigate the dependence of the coefficient of thermal expansion from the soil content and temperature. This knowledge is necessary for the design of engineering structures in the coastal zone of the northern seas.
Experimental investigations of thermal deforma-tions of frozen soils started in the 1930s (Fedosov, 1935). A complex nonlinear character of the deformations due to the cooling was ascertained later by (Votyakov, 1975; Ershov, 1990; Cheverev, 2004). Thermal deformations of frozen soils have abnormal properties (expansion due to cooling and contraction due to heating) in a certain range of temperatures due to the presence of unfrozen, or bound, water in frozen soils. Properties of the bound water in cryogenic soils are discussed in the analytical review (Cheverev, 2003). Negative values of the coefficient of thermal expansion are explained by the gradual freezing of the bound water during the soil cooling.
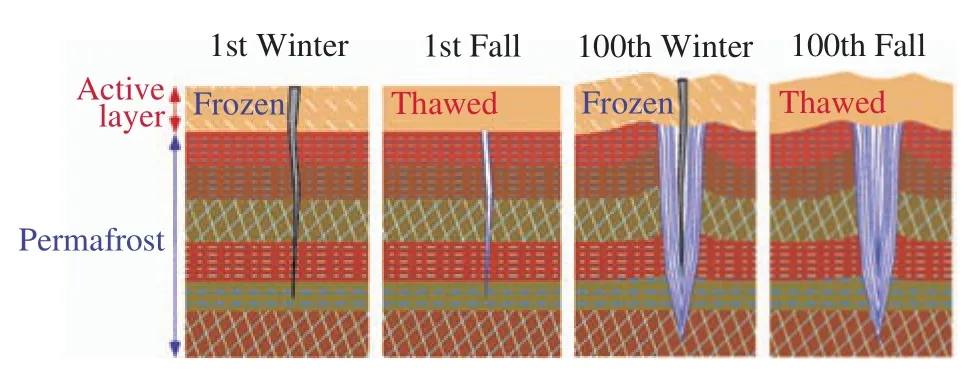
Figure 1 Seasonal evolution of ice wedges
Several methods of determining the amount of unfrozen water in frozen soil are known: the method based on measurement of the thawing temperature (Grechishchevet al., 1983), the method of measuring the amount of heat for heating the soil and melting the ice in a sample (Patent RU2034110, 1995), and the calorimetric method (Guidance on Physical,Thermal and Mechanical Properties of Frozen Soils, 1973). All of these methods involve determining multiple deliverables, are time-consuming, and are not accurate enough. The method for determining of soil deformations with dial indicators does not have sufficient measurement accuracy (Votyakov, 1975).
In the present paper we describe the method and the results of direct measuring of thermal expansion/contraction of frozen soil samples with Fiber Bragg Gratings (FBG) strain and temperature sensors. The experiments are performed with soil samples with different grain-size distribution, water saturation, and salinity. Earlier this method was used to investigate thermal expansion of saline ice (Marchenkoet al., 2016).
2 Instrumentation
FBG sensor is a periodic grid with 40,000 cells burned by two laser beams inside the fiber with diameter of 9 μm. The grid length is 1 cm. Each FBG sensor reflect the light signal of a certain wavelength, depending on the grid characteristics, tension and temperature of the fiber. The incoming light signal is generated in the optical fiber by the source LED in the spectral range 1,500~1,600 nm. The wavelengths reflected by the FBG sensors are registered and analyzed by a spectrometer. To register changes inside a calibration device, a constant temperature is maintained in one of the sensors. The spectrometer, calibrator, and analyzer of the incoming optical signals are combined in one unit with four channels designed and manufactured in the company Advance Optic Solutions GmbН (Dresden). Every channel of the unit can transfer information from 16 FBG sensors embedded in the same fiber.
FBG thermistor string and strain sensor are shown in Figure 2. Fiber cable with FBG temperature sensor is protected from mechanical deformations by thin metal tube of 1 mm diameter. The FBG thermistor string includes 12 FBG sensors embedded in the same fiber with 1 cm distance between neighbor sensors. The FBG thermistor string is protected from mechanical deformations by thin metal tube of 1 mm diameter and 25 cm length. The thermistor string is welded with optical fiber protected by blue plastic. The accuracy of temperature measuring and nominal resolution is correspondingly equal to 0.4 °C and 0.08 °C. Strain sensor is embedded in the middle part of the fiber protected by transparent plastic with working length about 20 cm. The fiber inside transparent plastic is going through the screw and welded to fiber cable protected by yellow plastic. The strain sensor is mounted on a sample and pretended using two screws and bolts. The resolution of the strain sensors is 10−6(1 μ strain), and the accuracy is 5×10⁻⁶(1 μ strain).
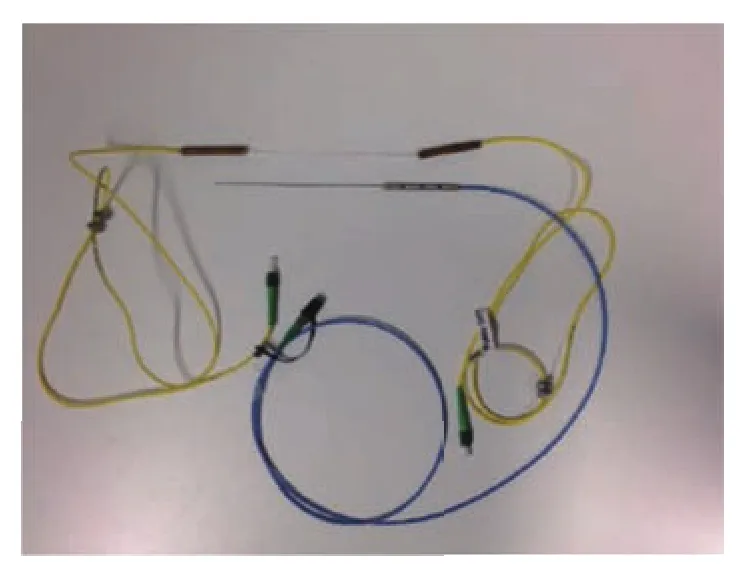
Figure 2 FBG thermistor string with blue plastic housing of the fiber and strain sensor with yellow plastic housing of the fiber
The change of the wavelength (Δλ) of the light reflected by the Bragg grating is proportional to the fiber extension (ΔL/L) and the change of the fiber temperature (ΔT):

where GF = 0.719, "calibration factor"; TK = 5.5×10⁻⁶, "thermal elongation factor";Lis the reference length of the fiber;λis the reference lengthof the light reflected by the Bragg grating. The value of Δλis measured by the spectrometer. From Equation(1)it follows that temperature changes of the fiber ΔTshould be known for the calculation of the fiber strain ΔL/L. In the experiment, the temperature of the strain sensor was measured by the FBG temperature sensor. The FBG thermistor string was installed to measure temperature inside the soil sample.
3 Experiments
The soil samples were installed within the metal frame used for the mounting of the fiber with FBG sensors (Figure 3). The fiber with FBG strain sensor was fixed between the metal frame and the steel slab, lying on the surface of the sample. The vertical screws exclude possible horizontal displacements of the slab along the sample. It allows avoid the complicated procedure of fixing the sensors on the sample itself (Grechishchevet al., 1983) and simplify the mounting of FBG sensors. The distance between the slab and the frame decreases when the sample elongates. In this case the strain sensor indicates contraction. In case when the sample becomes shorter the strain sensor indicates expansion. The sample strain is calculated according to the strain sensor reading as follows:

whereLis the initial distance from the frame to the sample surface, andLsis the initial length of the sample.
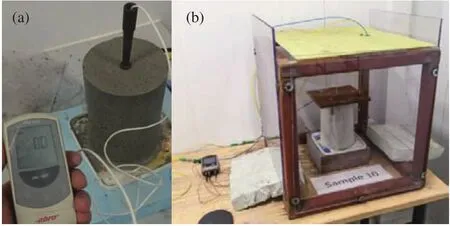
Figure 3 (a) View of the tested sample, (b) the rig for the tests
Samples of different porosity, density, and water content were prepared in the cold laboratory of the University Centre in Svalbard (UNIS). The samples had the form of thick-walled cylinders 20 cm high, with the outer diameter 13 cm and the inner diameter 2 cm (Figure 3a). The physical characteristics of the soils are presented in Table 1. The water content of the sand samples was preset as equal to 15% and for clay samples, 35.5%. The water saturation ratioSrfor sand samples was equal to 0.72~0.86 and for clay samples, 0.90~0.96. Saturation was performed using fresh water or seawater with salinity of 34.3 ppt. For clay samples the densities of them were approximately equal. The fine and silt sands had the characteristics presented in Table 2. The fine sand was considered to have no less than 75% content of particles> 0.1 mm by weight; and the silt sand had less than 75% content (Patent RU2034110, E01D 1/00, 1995). For sand sifting, the sieves of international standard ASTM and the vibrating table Retsch AS 200 were used.

Table 1 Characteristics of the tested soils

Table 2 Grain-size distribution of fine and silt sands
The soil samples were preliminarily cooled before testing: the sand samples to 0 °C and the clay samples to −5 °C. Then each sample was placed in the cold room and the FBG strain sensor and thermistor string were mounted on the sample. All electronic devices, the LED source, the spectrometer, and the PC were installed outside the cold room. The temperature of the cold room was changed every 6 hours. The processes of moisture movement or squeezing was not taken into account.
4 Results
The experiments on thermal deforming of frozen soil samples were performed respectively in the temperature ranges: from 0 to −12 °C (sand samples) and from −5 to −12 °C (clay samples). The results of the experiments are presented in Figures 4~9.
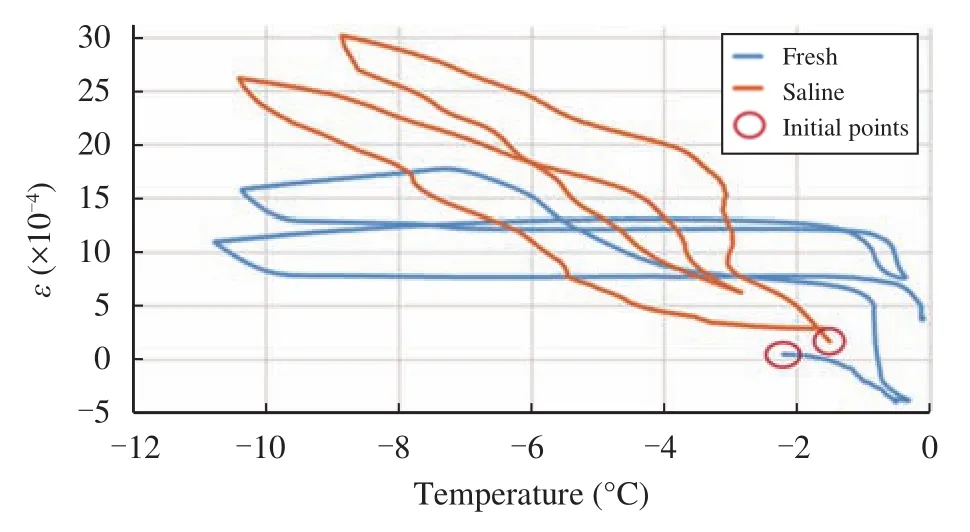
Figure 4 The strain–temperature relationships of the fine-sand samples saturated with fresh or saline water
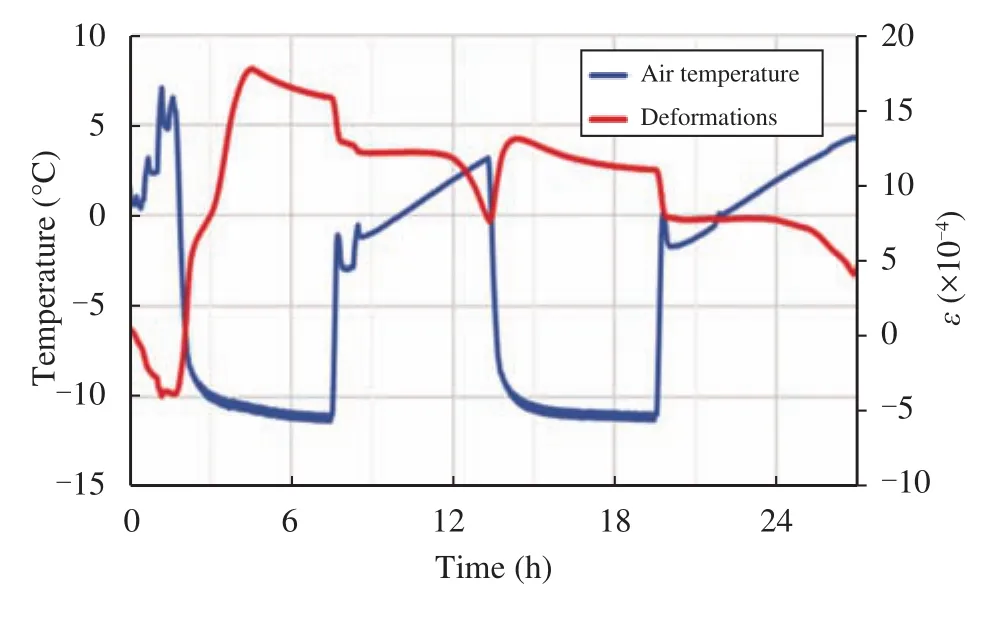
Figure 5 The change of the strain compared with the air-temperature change in the cold room for the sand sample saturated with fresh water
The strain–temperature curves of fine-sand samples saturated with fresh or saline water are presented in Figure 4. In the first cycle of temperature change, the sample saturated with fresh water expanded when its temperature decreases from −1 °C to−7.5 °C and contracted when the temperature further decreases to −11 °C. In the second cycle, the expansion of the sample was not so large at the same condition because the ice inside the sample didn't melt completely during the 6-hour period of heating. The strain patterns of the sample saturated with saline water are different: the sample expanded as the temperature decreases to −12 °C and contracted as the temperature increases to 0 °C in the both cycles of the temperature change.
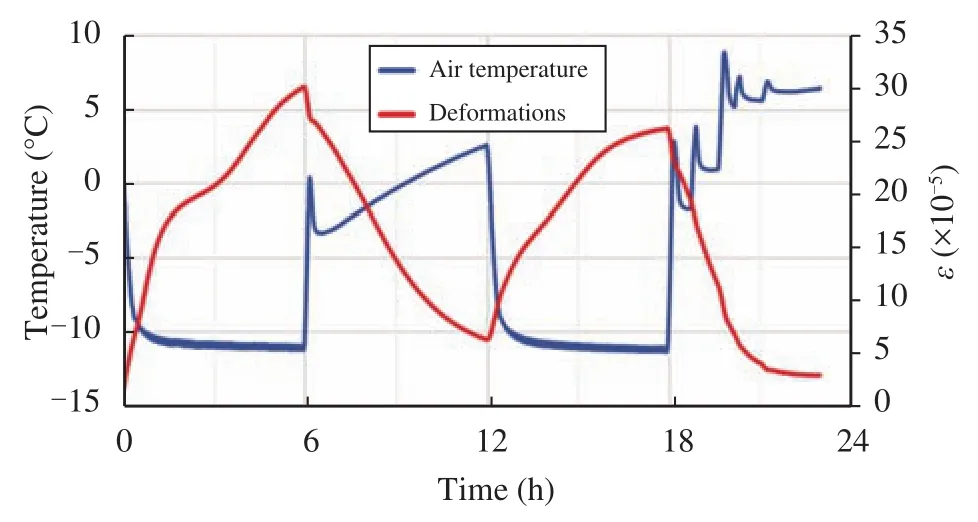
Figure 6 The change of the strain compared with the air-temperature change in the cold room for the sand sample saturated with saline water
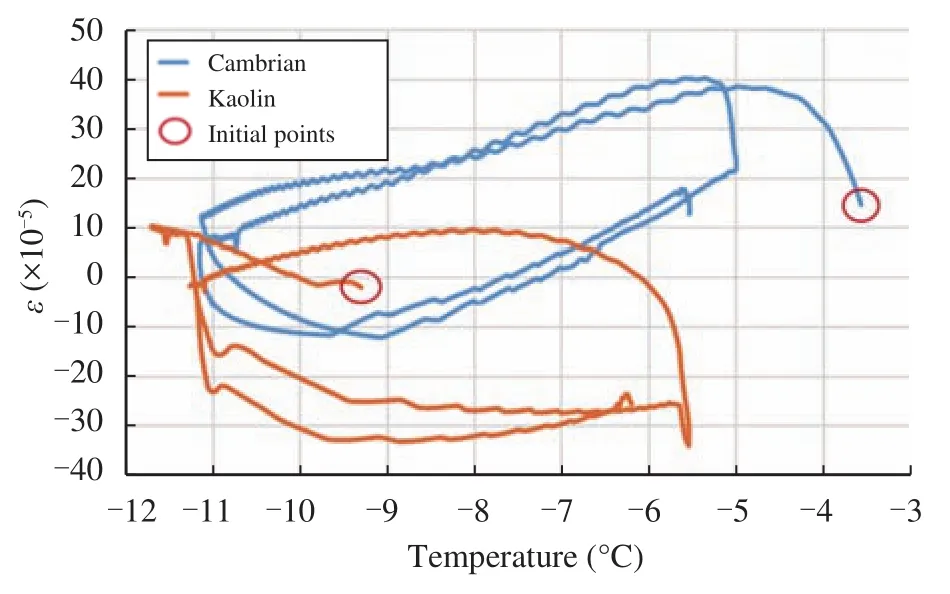
Figure 7 The strain–temperature relationships of the Cambrian and Kaolin clay samples saturated with fresh water
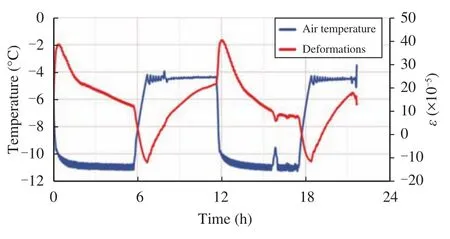
Figure 8 The change of the strain compared with the air-temperature change in the cold room for the Cambrian clay sample saturated with fresh water
The soil expansion under the cooling is explained by the gradual formation of ice from unfrozen water inside the soil. Figures 5 and 6 show the sample strainand the air temperature measured near the sample versus the time. The range of thermal strains in the samples saturated with fresh water is much less than that in the samples saturated with saline water.
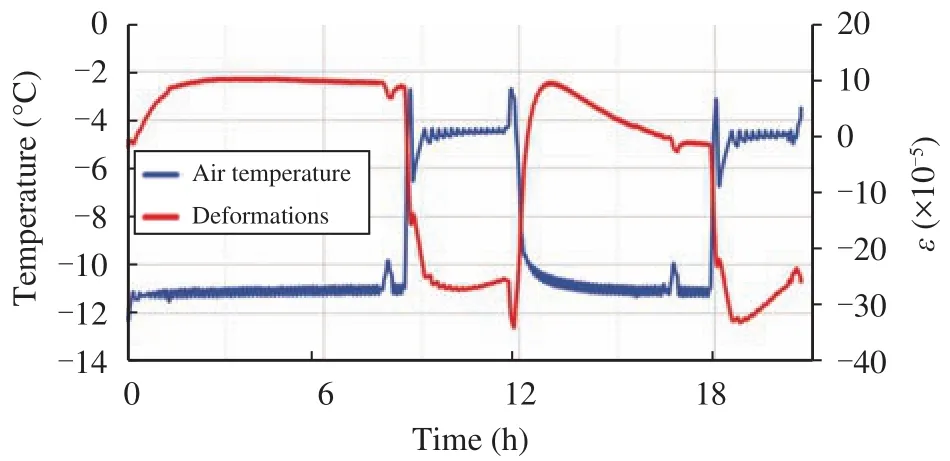
Figure 9 The change of the strain compared with the air-temperature change in the cold room for the Kaolin clay sample saturated with fresh water
The strain–temperature curves for the Cambrian and Kaolin clay samples saturated with fresh water are shown in Figures 7~9. From Figure 8 it is seen that the Cambrian clay sample shrunk continuously during 6 hours when the air temperature near the sample was −11 °C. The strain rate of the sample changed the sign when the air temperature increased to −4 °C. Similar deformations of Kaolin clay samples occurred with lower strain rates (Figure 9).
The hysteresis is described in terms of strain-temperature dependencies during the "cooling–heating" cycles of soil samples. In clays the hysteresis loops are wider (Figure 7) than in sands (Figure 4) because of the higher content of unfrozen water in finely dispersed soils (Cheverev, 2003).
5 Conclusions
● New method of measurement of thermal deformations of frozen soil samples was developed based on the use of optical fiber sensors with Bragg grating.
● A number of tests on determining the thermal response of soils on cycling temperature changes specific for natural conditions were performed. Soil samples containing Cambrian or Kaolin clay, silt or fine sand were saturated with fresh or saline water and tested.
● The results obtained are regarded as preliminary. On the basis of the method developed, a number of further experiments are planned in 2017 for gathering statistical data and performing more detailed analysis of physical processes in frozen soils at cyclic changes of the temperature.
The results of the tests can be used for the study of geo-cryological processes (thermokarst, thermal erosion, frost cracking and heaving, suffusion) in earth dams of the frozen type and in other structures in the permafrost and arctic shelf zones. These processes are even more intensive under the severe climatic conditions of the permafrost zone due to the large thermal and moisture gradients and the resulting complex thermal stress–strain state in the structures (Chzhan and Velikin, 2014).
Acknowledgments:
The investigations were performed with the support of the Innovation Centre SAMCoT (Sustainable Arctic Marine and Coastal Technology), a project of the Norwegian scientific fund.
Cheverev VG, 2003. Properties of bound water in cryogenic grounds. Earth Cryosphere, 7(2): 30–41.
Cheverev VG, 2004. Nature of cryogenic soils. Moscow: Nauchnui Mir., pp. 234. (in Russian)
Chzhan RV, Velikin SA, 2014. Safety of small and medium dams in permafrost regions. Sciences in Cold and Arid Regions, 6(4): 331–339. DOI: 10.3724/SP.J.1226.2014.00331.
Ershov ED, 1990. Geocryology. Moscow: Nedra, pp. 559. (in Russian) Fedosov AE, 1935. Physical and Mechanical Processes in the Soil at Freezing and Thawing. Moscow: Transgelitizdat, pp. 48. (in Russian)
Grechishchev SE,et al., 1983. New methods of studying the composition, structure and properties of frozen soils. "Nedra", Moscow. (in Russian)
Guidance on physical, thermal and mechanical properties of frozen soils [Rukovodstvo po opredeleniiu fizicheskih, teplofizicheskih i mekhanicheskih kharakteristik merzlykh gruntov], 1973. Moscow, pp. 194. (in Russian)
Marchenko AV, Lishman B, Wrangborg D,et al., 2016. Thermal Expansion Measurements in Fresh and Saline Ice Using Fiber Optic Strain Gauges and Multipoint Temperature Sensors Based on Bragg Gratings, Нindawi Publishing Corporation. Journal of Sensors, 2016: 5678193. DOI: 10.1155/2016/5678193.
Patent RU2034110, E01D 1/00, 1995.
Petersen J, Sack D, Gabler RE, 2015. Fundamentals of Physical Geography. 2nd Edition. Cencage Learning, Available on: http://www. physicalgeography.net/fundamentals/contents.html.
Votyakov IN, 1975. Physical and Mechanical Properties of Frozen and Thawed Soils of Yakutia. Novosibirsk: Nauka. pp. 176. (in Russian)
:Marchenko A, Vasiliev N, Nesterov A, et al., 2017. Laboratory investigations of the thermal strain of frozen soils, using fiber-optic strain gauges based on Bragg gratings. Sciences in Cold and Arid Regions, 9(3): 0192–0196.
10.3724/SP.J.1226.2017.00192.
November 19, 2016 Accepted: December 19, 2016
*Correspondence to: Nicolai Vasiliev, Ph.D., head of the Static Research of Soils Laboratory, JSC "Vedeneev VNIIG", 21, Gzhatskaya, St. Petersburg 195220, Russia. E-mail: nicolaivasiliev@hotmail.com
 Sciences in Cold and Arid Regions2017年3期
- Sciences in Cold and Arid Regions的其它文章
- Laboratory and field performance of recycled aggregate base in a seasonally cold region
- Subgrade-reinforcement techniques for the dangerously deforming sections of railway lines in the north of the Russian Far East
- Systematization of features and requirements for geological survey of railroad subgrades functioning in cold regions
- Application of a nondestructive method to evaluate the active layer in a cold region
- Soil freezing process and different expressions for the soil-freezing characteristic curve
- Frost heave analysis of ballasted track above box culvert and its influence on train vibration
