Spatial and temporal variations of the surface soil moisture in the source region of the Yellow River from 2003 to 2010 based on AMSR-E
WANG Rui,ZHU Qingke†,MA Hao,WANG Yu
(1.Forestry Ecological Engineering Research Center,School of Soil and Water Conservation,Beijing Forestry University,100083,Beijing,China; 2.State Forestry Administration,Northwest Institute of Forest Inventory and Planning and Design,710048,Xi'an,China)
Spatial and temporal variations of the surface soil moisture in the source region of the Yellow River from 2003 to 2010 based on AMSR-E
WANG Rui1,ZHU Qingke1†,MA Hao2,WANG Yu1
(1.Forestry Ecological Engineering Research Center,School of Soil and Water Conservation,Beijing Forestry University,100083,Beijing,China; 2.State Forestry Administration,Northwest Institute of Forest Inventory and Planning and Design,710048,Xi'an,China)
[Background]Hydrological processes in the source region of the Yellow River(SRYR)are increasingly attracting local concern,particularly when coupled with a changing climate.Nonetheless, large-scale spatial and temporal variations in soil moisture have received minimal research attention compared to other hydrological variables in the area.[Methods]Based on a two-channel retrieval method with a Qpmodel through monthly regression analysis and Advanced Microwave Scanning Radiometer-EOS(AMSR-E)soil moisture data,we investigate the spatial and temporal variations of the surface soil moisture and its influencing factors in the SRYR and through five natural zonings in the SRYR during 2003-2010.[Results]Through successive corrections with the dual-channel retrieval algorithm with the Qpmodel and the monthly regression analysis,the AMSR-E soil moisture shows strong agreement with in situ data in the SRYR.The average annual surface soil moisture in the SRYR is 0.140-0.380 cm3/cm3.There is a decreasing trend in the moisture content in the entire SRYR over the study period (2003-2010).Generally,a decreasing trend occures in the areas with higher initial soil moisture values from 2003 to 2010,while increasing trend in the areas with lower initial soil moisture concentrations over the same period.The soil moisture is highly positively correlated with precipitation(r=0.80,P<0.01)and the NDVI(r=0.79,P<0.01)over the entire year.The soil moisture is also negatively correlated with air temperature in months with high temperatures(from April to September)and positively correlated with air temperature in months with low temperatures(from January to March and from October to December).[Conclusions]This paper illustrates that the surface soil moisture of the SRYR has the tendency of drying,and precipitation and vegetation account for the decrease of soil moisture.Results of this paper provide an effective way for AMSR-E official soil moisture products application,would help to understand the hydrological process and its response to climate change,and have a scientific significance for ecological environment construction in Plateau.
AMSR-E;surface soil moisture;the source region of the Yellow River
0 Introduction
Surface soil moisture exists within the interface of the atmosphere,pedosphere,and biosphere.It plays a major role in the distribution of sensible heat and latent heat in solar net radiation,as well as in the runoff and infiltration process during precipitation.It provides important moisture source to cloud for precipitation by evaporation[1].It also plays the determined role in dynamic variation of deep soil moisture[2].Therefore,it is a critical initial parameter for simulating land surface processes such as climate and ecology.
Because the soil moisture is strongly variable in space and time,traditionalin situstation monitoring methods are ineffective in assessing soil moisture on regional spatial or wide temporal scales;while microwave remote sensing provides an effective alternative for long-term real-time dynamic monitoring of soil moisture[3-4].As the first passive microwave sensor to provide a global soil moisture product,the AMSR-E has been being widely used.For example,Draper et al.[5]stated that soil moisture datasets by AMSR-E accurately reported the soil moisture in Australia.Zahid and Rasul[6]used AMSR-E data to analyze the spatial and temporal variation of soil moisture during crop planting season of Pakistan from 2003 to 2010.Chen et al.[7]verified the reliability of the AMSR-E soil moisture product in the Xilinhot grassland plots in China.Xi et al.[8]compared the accuracies of the three AMSR-E soil moisture products(JAXA,NASA,and VUA)in the Qinghai-Tibet Plateau(QTP),and reported that NASA and VUA presented higher retrieval accuracy. However,the official dynamic range of soil moisture was small,and therefore,which could not reflect any inter-annual trends.
Several studies have sought to improve the AMSR-E original retrieval algorithm by introducing theQpsurface radiation model[9],and to validate this improved algorithm and the retrieval accuracy usingin situmeasured data[10-11].In addition,regression analysis relatingin situdata to the remote sensing products reduces the error in soil moisture estimation with the AMSRE[11,12].For instance,Feng et al.[13]used monthly regression analysis and the results on the soil moisture variations over the Poyang Lake basin in China were improved.
In order to determine the most effective method, we intend to compare and validate the various AMSR-E soil moisture products in this study,including those retrieved by the dual-channel retrieval algorithm with theQpmodel(SMD),those using the linear regressioncorrected method(SML),and the AMSR-E official soil moisture(SMO).We will then apply these results to the analysis of the spatial and temporal variation in soil moisture over the SRYR in China.The SRYR,located in the Qinghai-Tibet Plateau(QTP),is also the world's most important high-altitude biodiversity nature reserve[14].In recent decades,particularly as a result of climate change and human activity in the area,the SRYR has experienced environmental deterioration,including the loss of runoff flow in the main river,theshrinking of associated lakes,soil erosion,continued degradation of area wetlands,deterioration of adjacent grassland ecosystems,and increasing desertification. These problems have had a serious impact on the local ecology,economics such as livestock production,and sustainability of water resources within the Yellow River basin[15-17].
Soil moisture is crucial to many ecological processes in alpine grasslands,including the ecological carrying capacity,grassland resilience,and grassland recovery and reconstruction from degradation[18].Soil moisture can cause variations in atmospheric heat content,which would impact the shift in seasons in the SRYR[19].Generally,few studies have examined the long-term or large-scale soil moisture dynamics as they relate to climate change.This research uses the AMSR-E soil moisture products,along within situdata,to examine the spatial and temporal variations of soil moisture in the SRYR,to assess the contributing factors to these variations,and to understand the response of soil moisture to climate change as well as regional ecological and hydrological processes.Finally,this research assesses water resources management and ecological restoration options for the study area.
1 Materials and methods
1.1 Study area
The SRYR is a catchment with an area of approximately 145 300 km2above the Longyangxia Reservoir in the mainstream of the Yellow River,and its geographic range is between 32°10'and 36°59'N in latitude and between 95°54'and 103°24'E in longitude(Fig. 1).The climate in SRYR is a typical continental plateau,with an average annual air temperature of-3 to -4.1℃and an annual average precipitation of 300-700 mm.The landform of the Yellow River is mainly three basic types of the mountains with an average altitude of>4 000 m,hill terraces and plain,with undulating plateau planation surface as the main form.The underlying surface primarily consists of seasonal permafrost,alpine meadows,alpine swamps,alpine lakes, and wetlands[20].Based on the division of the Qinghai-Tibetan Plateau natural zone[21],the main regions of the SRYR are as followings:the wide valley basin of the YRSR(I),Zoige hummocky plateau(II),Golog Yushu plateau gully(III),Huangnan mountains(IV),and the eastern margin of the Qaidam mountains (V).
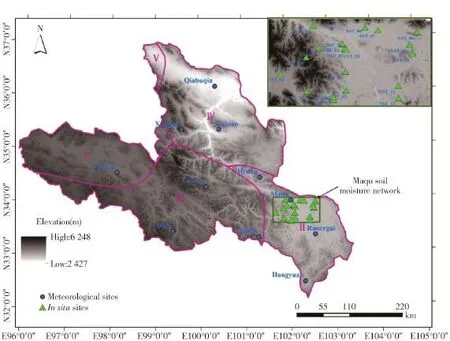
Fig.1 DEM of the SRYR,displaying meteorological and in situ soil moisture sites.The purple bold lines represent the boundary of natural zonation
1.2 AMSR-E data of soil moisture
The AMSR-E L3 daily surface moisture data during June 2002 to October 2010 from the National Snow and Ice Data Center(NSIDC)was applied for this study,AMSR-E was on the Aqua satellite launched by NASA in 2002.It had 6 observation channels of 6.9, 10.7,18.7,23.8,36.5,and 89.0 GHz,each with dual vertical and horizontal polarized radiation measurements,totally 12 channels.The data were available twice daily from an ascending track(overpasses at 13∶30 local time)and a descending track(overpasses at 1∶30 local time)with EASE-Grid as projection method and a spatial resolution of 25 km.Because the AMSRE data in each day cannot cover a full day in the middle and low latitudes,we spliced the data from two adjacent days into one using the stitching algorithm.
1.3 Measured soil moisture,meteorological data and NDVI
The soil moisture data from the Maqu Soil Moisture Monitoring Network(MSMMN)located in the SRYR was utilized to calibrate and validate the AMSRE soil moisture product downloaded from the International Soil Moisture Network.The soil moisture was measured at different depths(5 cm,10 cm,30 cm,50 cm,and 80 cm below the surface)at 15-min intervals by the EC-TM ECH2O probe(Decagon Devices,Inc., USA).The EC-TM ECH2O is a capacitance sensor that measures the dielectric permittivity of the soil surrounding the probe's pins,and the root mean square error (RMSE)was 0.02-0.06 m3/m3[22].Since microwave can only reach a few centimeters deep in the ground,the soil moisture at the surface of the 5 cm observed in this paper will be used for analysis and verification.The MSMMN is located at Zoige hummocky plateau of the Southeast SRYR,near to the first big bend of the Yellow River,Maqu County of Gansu province;the underlying surface is alpine meadow.The MSMMN consisted of 20 sites(as shown in Fig.1 and Tab.1).The data from 8 sites of CST-01,CST-04, NST-02,NST-04,NST-07,NST-10,NST-12,and NST-13 were used for the calibration of AMSR-E soil moisture product,while the data from other 12 sites for the verification.In order to obtain the actual surface soil moisture during the passage of the satellite,the average measured soil moisture adjacent to the satellite transit time was chosen to represent the surface soil moisture of AMSR-E transit time.
Mean monthly air temperature and precipitation data were obtained between 2002 and 2011 from 11 National Meteorological Information Center(http:∥data.cma.cn)stations located across the SRYR(as shown in Fig.1).Using ARCGIS10.2,we conducted a Kriging interpolation of the air temperature and precipitation point data,and then generated raster image datasets with the same spatial resolution and soil moisture by pre-processing such as projecting,clipping, and re-sampling.
MOD13A3 is monthly vegetation index developed by the land group of NASA MODIS via a common algorithm,and can be downloaded from Geospatial Data Cloud(http:∥globalchange.nsdc.cn),and the data were pre-processed by radiation,geometrical and atmosphere calibration.The data for this study was the maximum monthly NDVI through the Maximum Value Composite(MVC)method with spatial resolution of 1 km.The re-sampled data calibrated by projection matched the data of soil moisture.
1.4 Dual-channel retrieval algorithm withQpmodel
In the retrieval of surface soil moisture from passive remote sensing data,how to remove the influence of the surface roughness is an important issue.Shi et al[9]solved this problem through the development of theQpmodel.TheQpmodel is a surface radiation model aimed at AMSR-E sensor parameters based on the Advanced Integral Model(AIEM),applied to high frequency and wide surface roughness.It can be expressed as:

whereepis the rough surface emissivity(equivalent toevandehin formula 2 shown below),tqis the polarized fresnel transmittance,tpis the fresnel transmittance, andQpis the roughness parameter.The subscriptprepresents polarization(vertical or horizontal polarization).
In this study,theSMDdataset is processed by a dual-channel retrieval algorithm withQpmodel devel-oped by Shi et al.[9].This algorithm is based on a single-channel retrieval algorithm developed by Jackson et al.[23],and calculates the land surface temperature on the basis of a 36.5-GHz vertical polarized brightness temperature[24].The algorithm eliminates the influence of vegetation on the microwave signal by determining the vegetation's optical thickness using the empirical relationship between the vegetation water content and the NDVI.The dual-channel retrieval algorithm withQpmodel is then introduced into the model in order to eliminate the influence of land surface roughness.The resulting soil moisture data is then taken as the inverse of the 10.65-GHz brightness temperature.The algorithm[11]can be expressed as follows:

Tab.1 Overview of sites in the regional observation net for analyzing the soil moisture in Maqu

where theSMDis the retrieved soil moisture data andevandehare the vertical and horizontal polarized rough surface emissivity,respectively,calculated as the ratio between the brightness temperature and land surface temperature.
1.5 Monthly regression analysis
Because the AMSR-E soil moisture retrieval algorithm is strongly influenced by seasonal changes in vegetation cover,applying a monthly regression analysis to the AMSR-E soil moisture product increased the accuracy of the soil moisture measurements.In the monthly regression analysis,thein situdata was used to calibrate the AMSR-E soil moisture[13].The regression can be expressed as:

whereSMLis the calibrated final product,andSMAMSREis the original AMSR-E soil moisture product,whileaandbare the regression coefficients.
1.6 Data analysis
The trend of the soil moisture during 2003-2010 served as the changing rate representing drier or wetter conditions,annually.We used the trend line method to analyze the change in soil moisture in different areas and months during 2003-2010,with the slope of thetrend line calculated as:

wherenis the number of years(for this study,n=8, year 2003-2010),xjis the soil moisture value injth year,andθis the slope of the trend line(θ>0 indicates that the change in the soil moisture innyears is increased).
In this study,the validation accuracy of three soil moisture products has been proposed based on observed data.The coefficient of determination(R2),betweenin situdata and the soil moisture product,and the RMSE were computed as criteria for goodness of fit.
The RMSE is defined as:

whereSMinsituandSMvare the observed and validated values forith pair,andnis the total number of paired values.Smaller RMSE values corresponded to smaller differences between the validated values and the observed values.
2 Results
2.1 Calibration and verification of AMSR-E soil moisture data
First,according to the dual-channel retrieval algorithm withQpmodel,we calibrated the AMSR-E soil moisture usingin situsoil moisture from eight sites in the MSMMN,and then validated them with data from the other 12 sites.Tab.2 shows that the accuracy ofSMDis higher thanSMO,and the RMSE is reduced from 0.041 to 0.036.At the same time,using the NST-14 site in 2009 as an example(see Fig.2),the range ofSMOis small(0.070-0.180 cm3/cm3),andSMDwas significantly higher than thein situsoil moisture in general situation,especially so in the months with little moisture.SMDis generally lower than thein situdata,and in periods with less precipitation and vegetation,SMDis similar to thein situdata.However,in periods with more precipitation and vegetation,SMDis much lower than thein situdata.Tab.2 shows that the AMSR-E soil moisture retrieval algorithm is not strongly influenced by precipitation,but rather seasonal changes in vegetation cover[3].Applying monthly regression analysis to the AMSR-E soil moisture product could mitigate the effect of the change in vegetation cover for increasing the accuracy of the soil moisture measurements.
Next,we calculated the monthly calibration coefficient using equation(2)based onSMDbydual-channel retrieval algorithm withQpmodel as well asin situdata from eight sites,and obtained the soil moisture product(SML)using the linear regression-corrected method.Then,the accuracy ofSMLwas validated by data from the 12 sites.Tab.2 shows that the accuracy of theSMLis higher thanSMDandSMO.The range and trend curve ofSMLmost closely approximate those ofin situdata(see Fig.2).Consequently,we calibrated the AMSR-E soil moisture through the dual-channel retrieval algorithm withQpmodel and monthly regression analysis,and analyzed the spatial and temporal variations in soil moisture over the SRYR from 2003 to 2010.

Tab.2 Validation accuracy of three soil moisture productscm3/cm3
2.2 Spatial and temporal variations in soil moisture
Average annual land surface soil moisture is 0.140-0.380 cm3/cm3as shown in Fig.3,the overall spatial distribution presented as high in the southeastern part and low in the northwestern part of the study area,i.e.,gradually rising from northwestern to southeastern part.It is similar to the soil moisture calculated for the Qinghai-Tibet Plateau[11],but smallerthan the range of 0.2-0.5 cm3/cm3in the SRYR from August to October 2009 by the Advanced Synthesis Aperture Radar(ASAR)[25].The average soil moisture in the Zoige hummocky plateau of the Southeast SRYR is 0.332 cm3/cm3,and this is the highest in the SRYR,and the area near the first bend of the Yellow River is of the highest soil moisture,and it is a key water conservation area in the SRYR.Correspondingly,Chen et al.[26]found that the soil moisture in the Zoige wetland was approximately 0.3 cm3/cm3from their soil moisture simulation experiment.The average annual soil moisture in the Golog Yushu plateau gully of the South SRYR is 0.275 cm3/cm3with the trend of high in the southeast and low in the northwest of the area.The soil moistures in the Huangnan mountains of the North SRYR,and the wide valley basin of the Northwest YRSR are low at averagely 0.215 cm3/cm3and 0.241 cm3/cm3,respectively.The soil moisture in the eastern margin of the Qaidam Mountains in the most northern part of SRYR is the lowest at 0.213 cm3/cm3.
The soil moisture tends to decrease from 2003 to 2010 in the SRYR at a rate of 0.012 cm3/cm3yearly (see Fig.4).There is also a slight trend of drying in the northern Tibetan over a period of nearly ten years[27].Furthermore,the soil moisture in different natural zonation is inconsistent.In the Zoige hummocky plateau,Golog Yushu plateau gully and Huangnan mountains,the soil moisture gradually decreases at a rate of 0.067 cm3/cm3,0.011 cm3/cm3,and 0.012 cm3/cm3,respectively.In the wide valley basin of the YRSRandtheeasternmarginoftheQaidam mountains,the soil moisture increases at a rate of 0.026 cm3/cm3and 0.019 cm3/cm3,respectively.
Fig.5 shows the spatial variations in the soil moisture averaged across the study period(2003-2010). Regarding to varied seasons and areas,the soil moisture in the spring(March,April,and May)decreases in most areas,especially in the Zoige hummocky plateau and in the Huangnan mountains;while the spring soil moisture in the wide valley basin of the YRSR and in the Golog Yushu plateau gully shows an increasing trend.In the summer(June,July,and August),the soil moisture increases in the eastern margin of the Qaidam Mountains and in the western Eling Lake in the wide valley basin of the YRSR,and decreases in the southern area of both Golog Yushu plateau gully and Huangnan mountains.In the autumn(September,October,and November),there are significant fluctuations in the soil moisture in the southern Zoige hummocky plateau and Golog Yushu plateau gully.In the winter(January,February,and December),the SRYR experiences freezing soils,as the mean air temperature drops below zero at times,resulting in minimal fluctuations in the soil moisture.On an individual monthly basis,the averaged soil moisture gradually increases in June,July,and September(when the moisture shows a significant increase of 0.036 cm3/cm3.In all other months,the averaged soil moisture decreases, with the greatest rate occurring in May(0.009 cm3/ cm3and November 0.008 cm3/cm3.
2.3 Analysis of factors influencing soil moisture
Tab.3 shows a significant positive correlation between precipitation,NDVI,and soil moisture in the SRYR,while air temperature is not correlated with the annual averaged soil moisture.Using monthly data, there is lower correlation between the precipitation and soil moisture in the January and December than the other months,likely due to hindered infiltration when the ground is frozen.From April to September inclusive,air temperature and soil moisture show a negative correlation,particularly in May and June when the soil moisture is most strongly subjected to evaporative influences from high ambient temperatures.From January to March and from October to December,air temperature and soil moisture are positively correlated,likely because in the freeze-thaw cycles when increased air temperatures facilitate the thaw of accumulated snow and frozen water,therefore increasing the soil moisture.The NDVI is also significantly correlated with the soil moisture,and it is consistent with previous studies[10,28].Vegetation affects the soil moisture by intercepting rainfall as well as regulating evaporation and infiltration.The correlations in May to July are generally lower than the other months,likely as the effect of air temperature on the soil moisture during this period increases,while the effect of vegetation alleviates.

Fig.2 Comparisons of three types of soil moisture products and the measured soil moisture at the NST-14 site in 2009
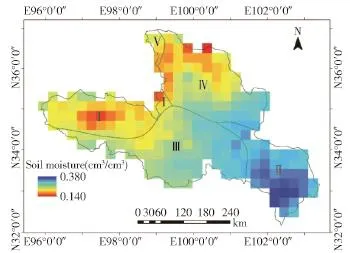
Fig.3 Average annual soil moisture during 2003-2010 in the SRYR
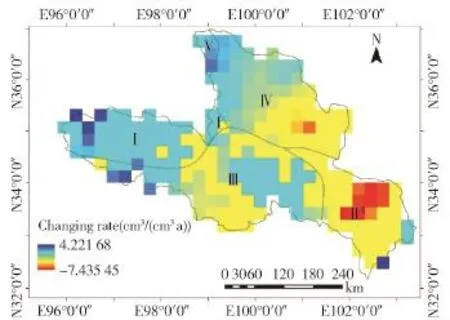
Fig.4 Annual variance ratio of the soil moisture from 2003 to 2010 in the SRYR
3 Conclusions and discussions
With the validation ofin situdata,the accuracy of the soil moisture data by the dual-channel retrieval algorithm and monthly regression analysis is better than that by official AMSR-E product,i.e.,by which the soil moisture is accurately measured.However,due to the low spatial resolution of the passive microwave sensor,it cannot be applied in the retrieval of soil moisture in the middle and low-scales.In the subsequent measurement,the downscaling method that combines the high resolution data should be employed to acquire the soil moisture with more accurate and spatially higher.
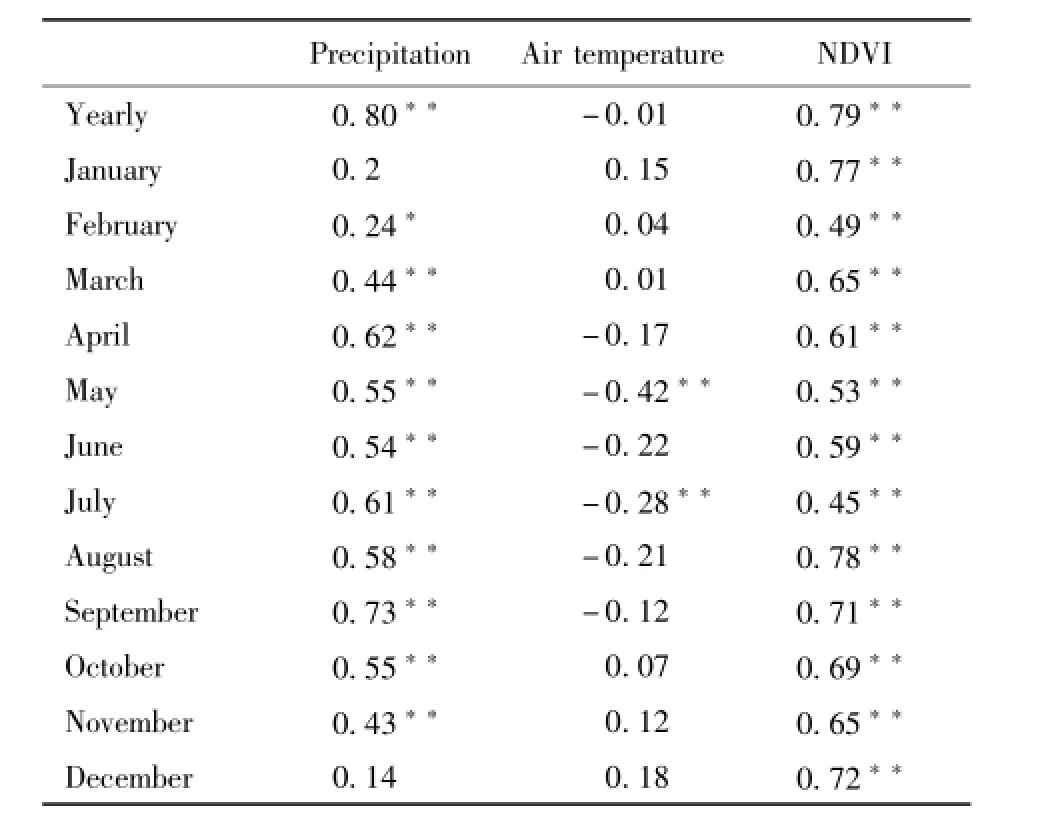
Tab.3 Correlation coefficients between the soil moisture and environmental factors including precipitation,air temperature,and NDVI
In this study,we analyzed the temporal and spatial characterization of the soil moisture over the SRYR using the retrieval AMSR-E soil moisture products.
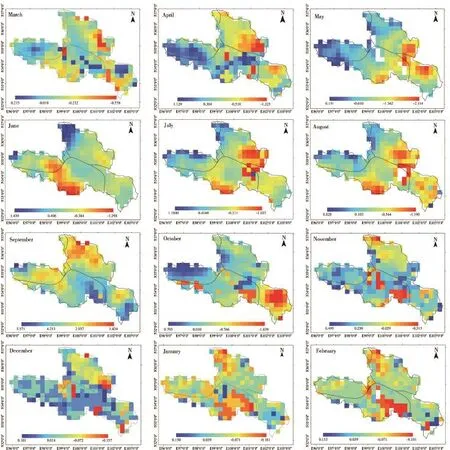
Fig.5 Monthly variance ratio of the soil moisture from 2003 to 2010 in the SRYR(Unit:cm3/(cm3·a))
Temporally,soil moisture is the highest in July and August and the lowest in January and December.Soil moisture generally tends to decrease in the spring, while increase again in the summer,have fluctuation in the autumn,and have little change in the winter.Spatially,the soil moisture is high in the southeastern section of the study area,and low in northwestern section; of which is the highest in the Zoige hummocky plateau, and lowest in the eastern margin of the Qaidam mountains.On the changing trend,the average soil moisture tends to decrease over the study period(2003 -2010)at a rate of 0.012 cm3/(cm3·a),with the highest rate of decrease(0.067 cm3/(cm3·a))in the Zoige hummocky plateau.The soil moisture in the wide valley basin of the YRSR and in the eastern margin of the Qaidam mountains increases slightly,i.e.,the soil moisture decreases the most in the areas with initially high soil moisture,while increases in the areas that originally had low soil moisture.
Among all considered influencing factors,precipitation results in the greatest impact on soil moisture. Air temperature is negatively correlated with soil moisture during periods of high temperature,and positively during periods of low temperature.Actually,the climate in the SRYR shows a significant trend towards warmer and wetter during the study period[16,29],while the soil moisture in the SRYR generally decreases,indicating that the increase of precipitation is not enough to offset the evaporative loss from warming trends and the amount ofsoilwateravailableforvegetative growth.Previous study[30]stated that when the air temperature increased by 2℃and precipitation increasedby less than 15%,evapotranspiration prevailed and the drought-related stress on the ecosystem increased; which could be eliminated only precipitation increased b 15%at the same time.Warming trend must,therefore,be offset by large increases in precipitation in order to ensure sufficient soil moisture and stabilize vegetative growth.In the next 90 years,air temperature in the QTP expectedly increases by 2.5℃[31],while the increase of precipitation will not exceed 5%over the next 30-50 years[32].In another words,the increasing precipitation would not enough to compensate the negative effect of increasing air temperature,which would thereby intensify the drought trend in the SRYR. The NDVI and soil moisture is positively correlated.Vegetation degradation further contributes to lowering soil moisture,especially significantly in the surface soil layers,and the highest reduction to the surface soil moisture was 38.6%[28].In the source region of 3 Rivers(Yangtze River,the Yellow River,and Lancang River)in the QTP,the ecological degradation of meadows also showed a strong impact on soil water conservation[33],and thus,restoration and reconstruction of degraded ecosystems should play a positive effect on suppressing drought trend in the SRYR.Other than precipitation,air temperature,and NDVI,environmental factors such as topography,soil physical properties,and human activities cause certain impacts on soil moisture,and therefore they should be taken into the further research in the SRYR.
4 References
[1] FAMIGLIETTI J S,RUDNICKI J W,RODELL M.Variability in surface moisture content along a hillslope transect:Rattlesnake Hill,Texas[J].Journal of Hydrology, 1998,210(1/2/3/4):259.
[2] KOSTER R D,SUAREZ M J,HIGGINS R W,et al. Observational evidence that soil moisture variations affect precipitation[J].Geophysical Research Letters,2003, 30(5):45.
[3] NJOKU E G,JACKSON T J,LAKSHMI V,et al.2003. Soil moisture retrieval from AMSR-E[J].IEEE Transactions on Geoscience&Remote Sensing,41(2):215.
[4] LU H,KOIKE T,OHTA T,et al.Development of a soil moisture retrieval algorithm for spaceborne passive microwave radiometers and its application to AMSR-E and SSM/I[C]∥IEEE International Geoscience and Remote Sensing Symposium,2007:1177.
[5] DRAPER C S,WALKER J P,STEINLE P J,et al. 2009.An evaluation of AMSR-E derived soil moisture over Australia[J].Remote Sensing of Environment,113(4): 703.
[6] ZAHID M,RASUL G.Spatial trends of AMSR-E soil moisture across agro-climatic zones of pakistan 2003-2010[J].Pakistan Journal of Meteorology,2013,9 (18):23.
[7] CHEN J,YANGang Z D,WU S L.Validation of AMSRE soil moisture products in the Xilinhot grassland plots [J].Meteorological Monthly,2011,37(3):334.
[8] XI J J,WEN J,TIAN H,et al.Applicability evaluation of AMSR-E remote sensing soil moisture products in Qinghai-Tibet plateau[J].Chinese Society of Agricultural Engineering,2014,30(13):194.
[9] SHI J,JIANG L,ZHANG L,et al.Physically based estimation of bare-surface soil moisture with the passive radiometers[J].IEEE Transactions on Geoscience&Remote Sensing,2006,44(11):3145.
[10] WANG A,SHI J,GONG H,et al.A quantitative model of soil moisture and instantaneous variation of land surface temperature[C]∥Geoscience and Remote Sensing Symposium.IEEE,2012:698.
[11] LIU Q,DU J Y,SHI J C,et al.Analysis of spatial distribution and multi-year trend of the remotely sensed soil moisture on the Tibetan Plateau[J].Science China, 2013,56(12):2173.
[12] BROCCA L,HASENAUER S,LACAVA T,et al.2011 soil moisture estimation through ASCAT and AMSR-E sensors:an intercomparison and validation study across Europe[J].Remote Sensing of Environment,115 (12):3390.
[13] FENG H H,LIU Y B.Spatial and temporal variation of soil moisture and its controlling factors over the Poyang lake basin from 2003 to 2009[J].Resources&Environment in the Yangtze Basin,2015,24(2):241.
[14] FENG J,TAO W,XIE C.Eco-Environmental Degradation in the Source Region of the Yellow River,Northeast Qinghai-Xizang Plateau[J].Environmental Monitoring &Assessment,2006,122(122):125.
[15] WANG G,LIU G,LI C.Effects of changes in alpine grassland vegetationcoveronhillslopehydrological processes in a permafrost watershed[J].Journal of Hydrology,2012,444-445(12):22.
[16] LAN C,ZHANG Y,GAO Y,et al.The impacts of climate change and land cover/use transition on the hydrol-ogy in the upper Yellow River Basin,China[J].Journal of Hydrology,2013,502(2):37.
[17] MENG F,SU F,YANG D,et al.Impacts of recent climate change on the hydrology in the source region of the Yellow River basin[J].Journal of Hydrology Regional Studies,2016,6:66.
[18] GE Y,LU C,XIE G,et al.Grassland ecosystem services and their economic evaluation in Qinghai-Tibetan Plateau based on RS and GIS[C]∥Geoscience and Remote Sensing Symposium,2005.IGARSS'05.Proceedings.IEEE International,2005:2961.
[19] YANG M,YAO T,GOU X,et al.The soil moisture distribution,thawing-freezing processes and their effects on the seasonal transition on the Qinghai-Xizang(Tibetan)Plateau[J].Journal of Asian Earth Sciences, 2003,21(21):457.
[20] WEN J,XIN L,SHI X,et al.Numerical simulations of fractional vegetation coverage influences on the convective environment over the source region of the Yellow River[J].Meteorology&Atmospheric Physics,2013, 120(1/2):1.
[21] ZHENG D,ZHANG R Z,YANG Q Y.On the natural zonation in the Qinghai-Xizang Plateau[J].Acta Geographica Sinica,1979,34(1):1.
[22] DENTE L,VEKERDY Z,WEN J,et al.Maqu network for validation of satellite-derived soil moisture products [J].International Journal of Applied Earth Observation &Geoinformation,2012,17(1):55.
[23] JACKSON T J,VINE D M L,HSU A Y,et al.Soil moisture mapping at regional scales using microwave radiometry:the Southern Great Plains Hydrology Experiment[J].Geoscience&Remote Sensing IEEE Transactions on,1999,37(5):2136.
[24] HOLMES T R H,DE JEU R A M,OWE M,et al. Land surface temperature from Ka band(37 GHz)passive microwave observations[J].Journal of Geophysical Research Atmospheres,2009,114(4):83.
[25] HE Y,WEN J,ZHANG T T,et al.A study on estimating soil moisture using microwave remote sensing combined with optical over the source region of the Yellow River[J].Remote Sensing Technology and Application,2013,28(2):300.
[26] CHEN B L,LUO S Q,LU S H,et al.Simulation and improvement of soil temperature and moisture at Zoige station in source region of the Yellow River during freezing and thawing[J].Plateau Meteorology,2014,33 (2):337.
[27] FU X,SONG C Q,ZHONG X K.On spatial and temporal variation of land surface moisture in Northern Tibetan[J].Advance in Water Science,2012,23(4): 464.
[28] ZENG C,ZHANG F,WANG Q,et al.Impact of alpine meadow degradation on soil hydraulic properties over the Qinghai-Tibetan Plateau[J].Journal of Hydrology, 2013,478(2):148.
[29] TIAN H L,LAN Y C,WEN J,et al.Evidence for a recent warming and wetting in the source area of the Yellow River(SAYR)and its hydrological impacts[J]. Journal of Geographical Sciences,2015,25(6):643.
[30] LI Y N,WANG Q J,ZHAO X Q,et al.The influence of climatic warming on the climatic potential productivity of alpine meadow[J].Acta Agrestia Sinica,2000,8 (1):23.
[31] YU L,FENG C Y.Recent progress in climate change over tibetan plateau[J].Plateau&Mountain Meteorology Research,2012,32(3):84.
[32] LIU X D,CHENG Z G,ZHANG R.The A1B scenario projection for climate change over the tibetan plateau in the next 30-50 Years[J].Plateau Meteorology,2009, 28(3):475.
[33] WANG Y B,WANG G X,WU Q B,et al.The impact of vegetation degeneration on hydrology features of alpine soil[J].Journal of Glaciology&Geocryology,2010,32 (5):989.
基于AMSR-E的黄河源区表层土壤水分时空变化
王蕊1,朱清科1,马浩2,王瑜1
(1.北京林业大学水土保持学院,100083,北京;2.国家林业局西北林业调查规划设计院,710048,西安)
黄河源区生态环境和水文过程对气候变化的响应是该区域研究的热点问题,但相对于其他环境和水文要素____而言,大尺度长序列的土壤水分时空分布特征研究不足。本文基于AMSR-E被动微波遥感数据和地面实测数据,首先采用引入Qp模型的双通道反演算法校正AMSR-E土壤水分数据,获得的土壤水分产品(SMD)精度高于官方提供的土壤水分产品(SMO),但其波动范围与实测数据有差异。之后采用逐月回归分析法对SMD进行二次校正,其土壤水分产品(SML)具有更高的精度且变化趋势与实测数据一致。基于SML土壤水分产品,对黄河源区及其5个自然分区表层土壤水分的时空变化特征及其影响因素进行分析。黄河源区年平均表层土壤水分为0.140~0.380 cm3/cm3,在2003—2010年间呈下降趋势,在东南部土壤水分较高的若尔盖丘状高原区、黄南山地区和果洛玉树高原宽谷区土壤水分呈下降趋势,其中若尔盖丘状高原区的下降速率最快,而在西北部土壤水分较低的黄河源宽谷湖盆区和柴达木东缘山区呈增加趋势;春季土壤水分呈下降趋势,夏季呈增加趋势,秋季的波动较大,冬季的变化的不大,其中9月土壤水分增加率和5月减少率最大。土壤水分受降水和植被指数的影响最大,气温表现为在年高温月份与土壤水分呈负相关,在年低温月份呈正相关。研究结果为AMSR-E土壤水分数据的研究与应用提供了依据,有助于深化对区域尺度土壤水分格局及其对气候变化响应的研究,对高原生态环境建设有重大意义。
AMSR-E;表层土壤水分;黄河源区
S152.7;TP79
:A
:2096-2673(2017)01-0022-11
2016- 10- 31
2017- 02- 07
10.16843/j.sswc.2017.01.004
Funded:National Science and Technology Support Plan(2015BAD07B02)
WANG Rui(1985-),female,doctoral student.Main research interests:soil erosion and remote sensing.E-mail:wangrui227@126.com.
†Corresponding author:ZHU Qingke(1956-),male,professor.Main research interests:Soil and water conservation,forestry ecological engineering.E-mail:zhuqingke@sohu.com.

