A Model to Describe the Fracture of Porous Polygranular Graphite Subject to Neutron Damage and Radiolytic Oxidation
G.Smith,E.Schlangen,P.E.J.Flewitt,A.G.Crocker,A.Hodgkins
1 Introduction
Magnox gas cooled reactors operating in the UK have Pile Grade A(PGA)graphite bricks as moderators.During their manufacture a mixture of needle coke,coke flour and coal pitch binder is extruded and baked.The needle coke particles are elongated,0.1 to 1.0 mm in length and during the extrusion process become aligned,resulting in orthotropic properties in the graphite.After extrusion,additional pitch is added and then the bricks are graphitized at 2800°C.This process is described in Heard,Wootton,and Moskovic(2011);Heard,Wootton,Moskovic,and Flewitt(2010);Hodgkins,Marrow,Wootton,Moskovic,and Flewitt,(2008);Kelly(2000).At manufacture,approximately 20%of the volume consists of porosity and flaws in the particles and the matrix.Within the particles,Mrozowski cracks form by shrinkage during graphitization.Porosity in the matrix occurs as networks of connected pores at the nano-scale and micro-scale,see Hodgkins,Marrow,Wootton,Moskovic,and Flewitt(2008);Hughes,Heard,and Wootton(2008).There is a large percentage of open porosity.Neutron irradiation and radiolytic oxidation change the microstructure of the virgin graphite during service life.The neutron irradiation increases the strength of the graphite dependent on the temperature and irradiation dose by creating point defects in the crystal lattice.The nuclear fission generates gamma rays which,in turn,result in radiolytic oxidation by hot carbon dioxide gas.This second mechanism decreases the material strength and causes mass loss,see Heard,Wootton,and Moskovic(2011);Hodgkins,Marrow,Wootton,Moskovic,and Flewitt(2008);Hughes,Heard,and Wootton(2008);Kelly(2000).The density of the graphite decreases;pores grow larger and their connected networks extend decreasing the inter-pore spacing and changing the relative proportions of porosity in the particles and the matrix.These microstructural changes are reflected in the mechanical and physical properties of the graphite bricks.
The graphite microstructure is similar to that of concrete and other aggregate materials[Hodgkins,Marrow,Wootton,Moskovic,and Flewitt(2010);Schlangen,(2008);Yaghi,Hyde,Becker,and Walker(2004);Kelly(1981);Schlangen and Garboczi(1997);Karihaloo(1995)].The porosity of reactor core graphite influences its fracture behaviour.This was recognised in a review by Hodgkins,Marrow,Wootton,Moskovic,and Flewitt,(2010),who proposed that graphite fractures in a quasi-brittle manner.Localised distributed micro-cracking before failure,typical of quasi-brittle fracture,is responsible for the non-linear load-displacement(stress-strain)curves[Moskovic,Heard,and Flewitt(2013);Brown(2012),Becker,Marrow,and Tait(2011);Schlangen(2008),Marrow,Hodgkins,Joyce,and Marsden(2006)].Unlike metals and alloys,polygranular graphite does not deform plastically by dislocation motion Becker,Marrow and Tait(2011).Consequently,departure from an initial linear load-displacement response is attributed to microcracking and as a consequence linear elastic fracture theories are inappropriate.The microstructure of porosity and distributed,but aligned filler particles and the stress state govern the fracture[Becker,Mostafavi,Tait,and Marrow(2012);Becker,Marrow,and Tait(2011),Karihaloo(1995)].
A number of models have been developed at different length/volume scales to represent the deformation and fracture of these graphites.Adopting numerical methods,[Tucker,Rose and Burchill(1986)];Rose and Tucker(1982)]combined the features of the weakest link Weibull analysis with a fracture mechanics approach.In the more general case of finite element models(FE)these may be characterised by reference to the type of model element used,either continuum or lattice,the post peak response to loading of the elements,either discrete or smeared crack approaches,and the number of spatial dimensions,either two-dimensional or threedimensional,[Schlangen and Qian(2009);Tsang and Marsden(2008);Berton and Bolander(2006);Tsang,Shi,Fok,and Marsden(2003);Bazant and Planas(1998);Burchell(1996);Schlangen and van Mier(1992)].An important input to these models is to provide a realistic representation of the microstructure,both the size and distribution of filler particles.Moreover this must take account of the length-or volume-scale of the model adopted.Damage models employ the most appropriate option from each of these categories and adapt them to a specific application.It is generally recognised that none of the models is capable of predicting crack propagation at all length/volume scales.As a consequence,hybrid methods have been developed to:(i)produce an FE mesh that can represent variability in the strength and stiffness of the microstructure and(ii)simulate the formation of distributed micro-cracks and their coalescence into a continuous macro-crack.Discrete models are limited by the need to simulate specific features in the microstructure and this places a significant constraint on the size of the elements selected.The properties of each element may be varied to provide a realistic response to an applied force.However,this pre-supposes that the distributions of the strength and stiffness of the matrix and filler materials are known and in PGA graphite these properties have not been determined previously.The capacity to scale the models to the size of structural members is the limiting feature of this type of model.This is demonstrated in both the Rose and Tucker and the Burchell models[Rose and Tucker(1982);Burchell(1996)]where probability functions are used to define the likelihood of fracture in a large volume of material.Both approaches use an analytical method to define behaviour in very small cross-sections.The variation in the spatial distribution of the complex graphite microstructure in the meshed volume then governs the prediction of structural fracture.
To address the issue of scaling,the continuum damage mechanics and the ligament theory models[Tsang,Shi,Fok,and Marsden(2003)]are often used to describe a representative volume.These elements represent regions which may consist of filler particles,pores,matrix graphite or a combination of these phases.However,this introduces other problems since the properties assigned to the representative volume element should reflect the distribution in properties produced by an aggregate microstructure over an equivalent volume.Of equal importance,the softening behaviour should reflect the post peak behaviour of an equivalent volume of material in an appropriate condition.Furthermore,there is a need to accommodate ran-domization in the microstructure,mechanical properties and softening behaviour.In this paper we produce microstructural and finite element computer models that include a representation of PGA reactor core graphite,filler particles,matrix and porosity,appropriate to the virgin and neutron irradiated conditions.This localised model provides a basis for evaluating the role of key microstructural parameters.However the additional porosity associated with neutron irradiation is produced in the model independently of the growth mechanism.It is designed to be a simple but realistic representation.Similarly the complex geometry of the filler particles is simplified to cylindrical representation.These models are used to examine the relationship between these different microstructures and the load-displacement characteristics,elastic modulus and crack propagation of the graphite.

Figure 1:Microstructure for(a)virgin PGA graphite(b)irradiated graphite with filler particles(F)in yellow and pores(P)in green.
2 Characteristics of reactor core graphite
In this section we provide relevant experimental information related to PGA reactor core graphite in both the unirradiated(virgin)and irradiated oxidised condition.The information is appropriate for constructing and evaluating the model predictions.Typical microstructures for PGA graphite in the unirradiated condition and after service exposure are shown in Fig.1(a)and 1(b)respectively.X-ray tomography has been used to provide information about the overall microstructure of radiolytically oxidised PGA graphite with a weight loss of 20%.This particular sample was removed from a reactor core brick after extended service.Fig.1(a)shows the overall microstructure,whereas Fig.1(b)is the corresponding X-ray two dimensional tomographic image.It is possible to demonstrate that the filler particles F and matrix containing porosity P can be separated with appropriate greyscale threshholding.Here a colour has been assigned to the image to aid interpretation.However there are challenges associated with resolving the skeletal structure within the highly porous region P.More detail can be obtained relating to the latter by reference to Moskovic,Flewitt,Schlangen,Smith,Crocker,Hodgkins,Heard,and Wootton(2014).
Surveillance monitoring samples were installed in the reactors when they were commissioned.In addition to these samples,others were periodically trepanned from the reactor cores over the service life.Material measurements of physical,chemical and mechanical properties were undertaken from both of these sources[Flewitt and Wootton(2013)].In particular,elastic modulus and fracture strength were evaluated[Hodgkins,Marrow,Wootton,Moskovic,and Flewitt(2010)].The heterogeneity of the material results in small test specimens containing different levels of porosity.Ideally measurements would be made on specimens with no porosity to determine these values.However inspection of nanoscale specimens taken from apparently porosity free volumes of matrix,show that small pores are present.
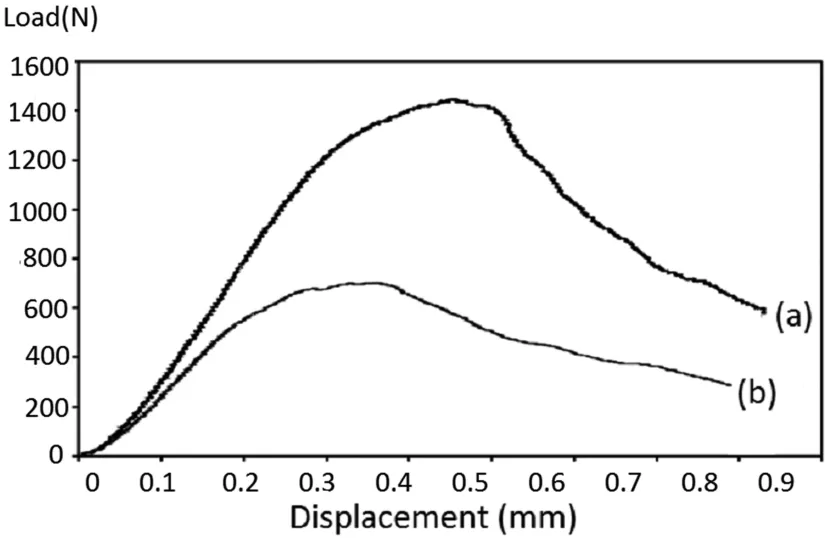
Figure 2:Typical load versus displacement curves for(a)unirradiated and(b)irradiated PGA graphite.
Typical load versus displacement curves,for the unirradiated and irradiated graphite are shown in Fig.2.After bedding in of the specimens each showed a linear response in the load-displacement.However this is followed,to a greater or lesser extent,by a non-linear response pre-peak load and post-peak softening characteristics.In general variability arises from the inherent heterogeneity within the graphite microstructure.Non-linearity commences between 0.3 and 0.9 times the value of the peak load.
Typical data obtained from measurements of dynamic modulus and fracture strength show that both of these parameters decrease monotonically with graphite weight loss.The change of elastic modulus is shown in Fig.3(a).It is clear that in the early stages of weight loss there is competition between contributions of neutron radiation hardening which would increase the modulus and mass loss leading to an increase in the amount of porosity.The variation in flexural strength is shown in Fig.3(b).The formation of micro-cracks is related to the presence of process zones of up to 2 mm to 3 mm in length.These process zones contain a distribution of micro-cracks and account for the pre-peak non-linearity.Compared to the micro-cracks,the macro-cracks follow an irregular tortuous path across the test specimens.
3 Modelling
The models described focus on the volume of matrix between two adjacent filler particles to investigate the effect of porosity in the matrix on the initiation and propagation of cracks under tensile loading.The modelling process has two stages.Firstly models that incorporate key characteristics of the microstructure are generated.These have elongated filler particles with a biased alignment and complex networks of pores.The data are held as three-dimensional geometric shapes as this provides an economic way to hold and manipulate complex structural information.These data are then transposed into a format suitable for input to FE software.This transformation introduces roughness to the previously smooth geometric shapes when the data is discretised.Each voxel in the new representation is identified as either part of a particular filler particle or within a pore or part of the matrix.The fracture simulations are performed by software that has been developed specifically for use with aggregate materials.
3.1 Modelling the microstructure
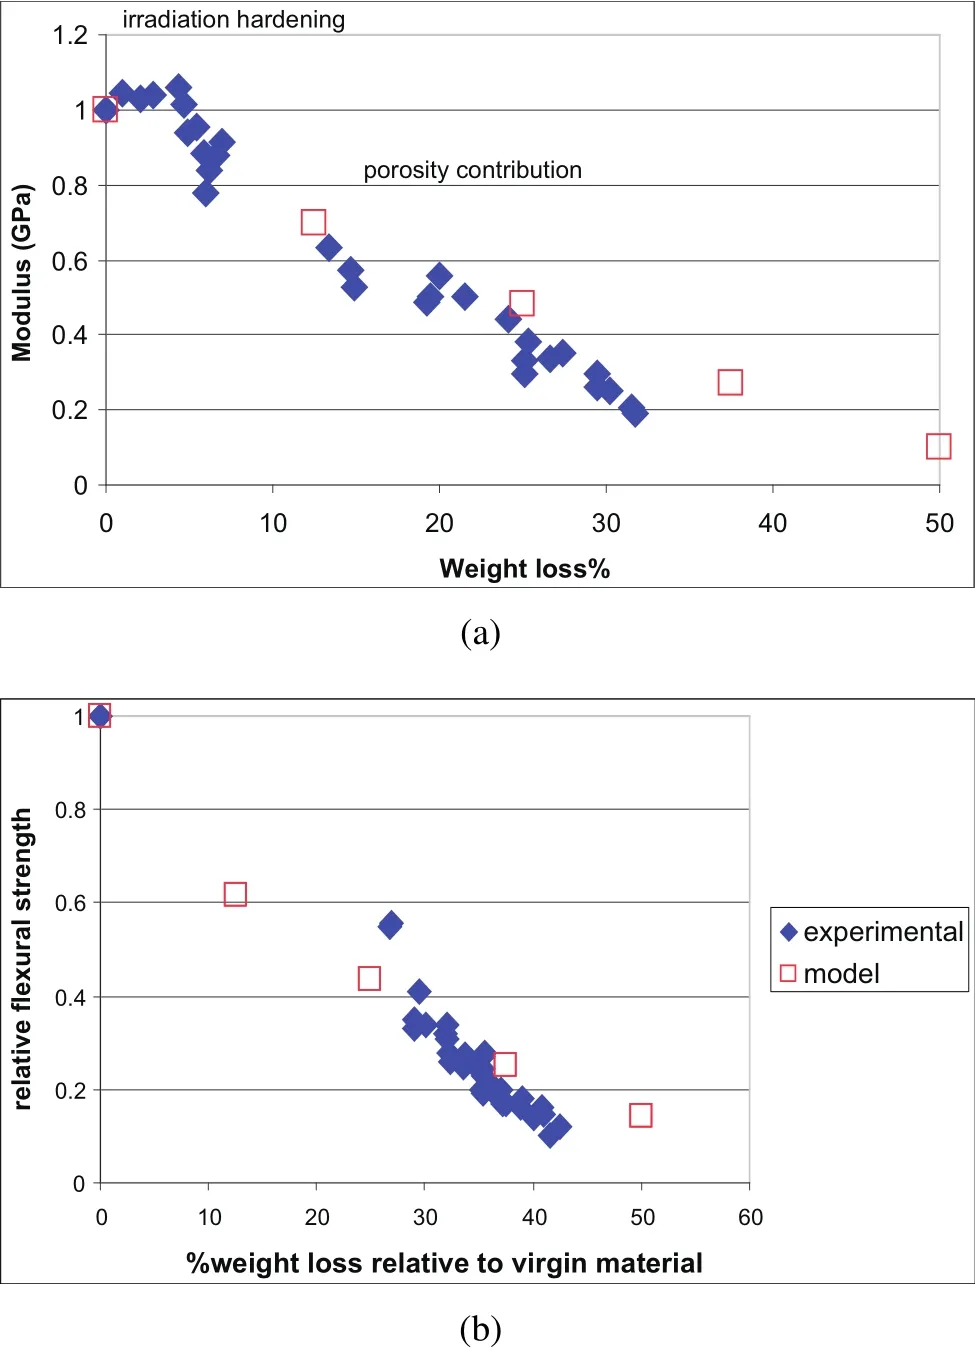
Figure 3:Comparison of experimental results and model predictions for PGA reactor core graphite for(a)variation of elastic modulus with%weight loss,normalised to virgin sample modulus and(b)variation of normalised fracture strength.Irradiation hardening and porosity dominated ranges are also shown.
The modelling described in this paper generates a representative microstructure of PGA graphite consisting of filler particles and pores embedded in a matrix.It is based on known volume fractions of the different constituents in virgin PGA reactor core graphite and the size distribution of filler particles.The range of length-scales for reactor bricks,experimental test specimens and microstructural components makes constructing a single model appropriate for FE analysis impractical and requires a multi-scale approach.Fracture simulations reported in this paper provide the first step in such an approach to identify the effect of filler particles and porosity on the fracture strength and the fracture path in 1 mm model cubes.The model size selected determines the number of filler particles and,based on the microstructure shown in Fig.1(a),it is considered appropriate to include just two filler particles in these small models.The microstructural models form the input for FE simulations of fracture to track distributed cracking and identify the crack path.Larger models representing 1 cm cubes,the subject of a different paper,see Smith,Flewitt,and Schlangen(2013),provide data that may be compared with results from experimental test specimens.Porosity occurs as irregular linked networks and is modelled as individual pore centres that grow and coalesce as porosity increases,which is representative of radiolytic oxidation.Two different schemes for generating the pores are described.These produce different size distributions for isolated pores but as porosity increases and pores coalesce,the difference reduces.All models and fracture simulation results presented in this paper relate to 1 mm cubes of PGA graphite.
3.1.1 Pores
Porosity in virgin graphite is known to account for approximately 20%of the material volume and to occur predominantly in the matrix.During service,the porosity increases as a result of radiolytic oxidation,either by existing pores enlarging or new pores forming[Heard,Wootton,and Moskovic(2011);Heard,Wootton,Moskovic,and Flewitt(2010);Hodgkins,Marrow,Wootton,Moskovic,and Flewitt(2008);Kelly(2000)].The microstructure modelling supports both processes and allows different initiation and growth laws to be investigated.In the models,pores are initiated at random points within the matrix and grow spherically outwards with time.Whichever laws are implemented,pores that are initially isolated spheres,coalesce to form more complex shapes as shown in Fig.4.Both their centres and future growth are constrained to lie within the matrix.
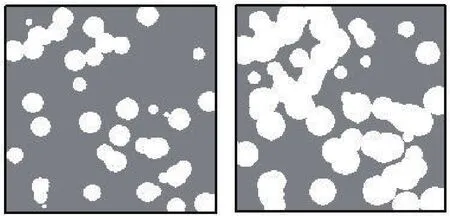
Figure 4:Spherical pores that have coalesced,seen in cross-section for 20%and 40%porosity in a mm.cube.
Two systems have been implemented for the initiation of pores in the model graphite.For the first case,all pores initiate simultaneously and,for low porosity,this results in isolated pores that all have the same radius although their cross sections in particular planes will differ.This relationship is irrespective of the growth law.As porosity increases,the spheres grow and coalesce to form complex networks.Then the concept of radius becomes inappropriate.For the second case,pore initiation is distributed over a period of time as shown for 500 pores in Fig.5.
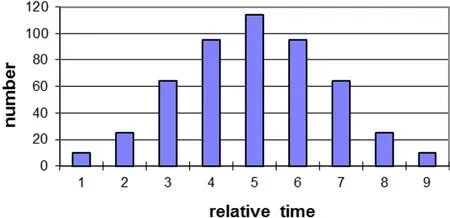
Figure 5:Histogram of initiation times for pores,in the case where initiation occurs over a period of time following a normal distribution pattern.Time units are chosen so that half the pores have initiated when the matrix porosity is 20%..
Here the total initiation time is divided into nine equal intervals and values allotted to produce a normal distribution.The scale factor is chosen so that half the pores have initiated when the volume of the porosity is 20%.This scheme matches the porosity introduced during the manufacturing process and the increase in porosity during service.It produces a distribution of pore sizes.Actual initiation times are chosen randomly within each time interval.Pores are numbered in time sequence as the co-ordinates for their random centres are generated throughout the model cube.This ensures that sequentially numbered pores are unlikely to be neighbours in space but will initiate at similar times so that the range of pore sizes is distributed randomly throughout the model.
Two possible growth laws for pores have been simulated;growth inversely proportional to the radius and growth inversely proportional to the volume of each pore.If all pores initiate at the same time,the only effect of changing from an inverse radius to an inverse volume relationship(radius cubed)is to slow the increase in porosity with time.For example to achieve 20%porosity with a particular number and position of pores,the radius must be the same for both growth laws and for the first law the pore radius is proportional to the square root of time and for the second law to the fourth root of time.If pores initiate over time,the effect of the growth law is more complex.At any time there will be pores with a range of radii determined for each by the time that has elapsed since it initiated.Any inverse growth relationship makes the radii of large pores grow more slowly than the radii for smaller ones.This effect is magnified if the growth law is inverse cubic(volume).
3.1.2 Filler particles
In PGA graphite,filler particles are generally elongated and roughly aligned with the extrusion direction.Filler particles are modelled geometrically as cylinders with flat circular ends and long axes biased towards the extrusion direction.The software has been written more generally to allow any orientation of particles to be selected.The parameters used to define each particle are:(i)Cartesian co-ordinates(x,y,z)for the centre of the circular end face,(ii)the radius of the particle(r),(iii)the direction cosines for the central axis(a,b,c two independent values),(iv)the extent of the particle relative to the end face(“up”/“down”Boolean).All the lengths are in model units where the model cube has edge length of a 100 units.The modelling software can accommodate any number of filler particles but the simulations covered by this paper focus on the matrix volume between two particles to investigate crack propagation between neighbouring particles.Each filler particle has one end face within the model and is positioned to extend beyond the surface of the model cube(Fig.6a).This scheme avoids introducing any variations in particle length and focuses attention on the matrix volume between and around the ends of the particles.
Data sets for a range of porosities from 20%to 60%were generated on a 100×100×100 grid for the finite element modelling.The same pore initiation centres were used for the different porosity data sets.The files consist of integer values for each voxel,indicating the material contents(Tab.1).By retaining different identifiers for each filler particle,it is possible to assign different properties to each particle and ensure consistency across all its voxels.

Table 1:The representation used for the different material components of the model.
Pore radii increase with time according to the growth law and replace matrix voxels with pore voxels.Although in practice,filler particles are subject to limited oxidation,in this model we assume oxidation of the matrix is dominant.Pores are not permitted to grow into filler particles but the filler-pore interface area increases with their radius.As the geometry of the filler particles is well defined,the voxels forming their surface can be identified and the filler surface area calculated by distinguishing which filler voxels share a face with a matrix voxel and which with a pore voxel.This enables pore coverage as a percentage of the total filler surface area to be calculated.
3.2 Modelling fracture
The different components of the microstructure,particles,matrix and porosity for a 1 mm cube of PGA graphite(as described in section 3.1),are transferred to FE lattice meshes by the following procedure:
·A cubic network of beams is created with a grid of 100×100×100 nodes.
·This microstructure is mapped on to the grid and beam elements are assigned properties according to their associated microstructural component.
·If a node lies within a pore,the beams connected to this node are removed from the network.If the node is within a filler particle or matrix,the node is assigned the appropriate physical parameters.
The boundary conditions in the simulations are chosen as follows:
·The nodes at the bottom face of the mesh are restrained in the vertical direction
·The nodes at the top face of the mesh are given a positive(tension)vertical displacement
·The sides of the mesh are free to move(unconstrained).
The fracture simulation processes of the lattice model are described in detail in work described by Schlangen(2008);Schlangen and Garboczi(1997).Basically,linear elastic analysis is performed on the FE mesh of the microstructure and the beam with the highest stress to strength ratio is removed,resulting in a small crack in the mesh where the beam was previously.Then the linear elastic analysis is repeated on the new mesh and the next beam is removed in the same way.The load and corresponding displacement of the system is recorded at each step,capturing the stress-strain response of the material.When performing the simulations,the FE beam elements for the matrix,the particles and the bonds between them are allocated the following properties:elastic modulus 10 GPa,Poisson ratio 0.22 and critical failure strain 0.25%.These property values are supported by measurements made on macro-scale cantilever beam specimens of virgin PGA graphite.The bulk properties of the material are not appropriate because they are predicted by the models.At present property values rely on data readily available but in the longer term it is hoped to have values that represent the matrix and individual filler particles but this requires measurements at the micro-scale.The need for such data has been identified and indeed work is in progress to make such measurements using techniques described by Darnborough,Liu,and Flewitt(2013).In addition the particle strength is reduced by 25%in the weak plane containing the long axis through the particle but the stiffness is not changed.The interface between filler particle and matrix is modelled with a single beam element with the mechanical property equal to the matrix elements.At locations where a pore is connected to a filler particle,there is no interface present.
The FE model was initially developed to simulate fracture in quasi brittle cement based materials.Examples can be found in Schlangen and Garboczi(1997);Schlan-gen and van Mier(1992);Schlangen and Qian(2009).The beams used in the lattice model are Timoshenko beams,[Karihaloo,Shao,and Xiao(2003);Timoshenko(1921)];they can transfer normal force,shear force,bending and torsion moments.In three-dimensions,the nodes have six degrees of freedom.As a consequence,every beam connected to a node will have the same translation and rotation.The basic theory behind two-dimensional models is explained in Schlangen and Qian(2009);Schlangen and Garboczi(1997);Schlangen and van Mier(1992).In Schlangen and Qian(2009)the changes and additions required for three-dimensional models are explained.
4 Models
The microstructural models involve two close filler particles representative of those seen in Fig.1(b).Four families of microstructural models were created:(i)no filler particles(for comparison purposes),(ii)one filler particle parallel to the second with varying overlap(d)and both parallel to the z-axis,(iii)one filler particle parallel to the z-axis and perpendicular to the second and(iv)two parallel filler particles neither parallel to a major axis.Initial simulations were for two filler particles both parallel to the z-axis of the cube;having an overlap with one extending in a positive z direction and the other in the opposite direction(Fig.6(a)).Their centres were positioned off the cube diagonal(Fig.6(b))to allow two different finite element fracture simulations to be performed with the same data set by rotating the cube.Both filler particles had radius 16 model units and the same volume(in total 13%of model cube).All pores were initiated at the start of the simulation.Data sets were generated for 20%,30%,40%,50%and 60%porosity.
In the previous model the filler particles overlapped by 60 model units.Data files for 40%porosity were generated for the same filler particles but with their overlap reduced to 40 and 20 model units,achieved by changing the z co-ordinates of the centres of the internal faces.These changes reduced the volume fraction of the model space occupied by the filler particles.All other parameters were kept constant(Tab.2).

Figure 6:Schematic representations of model cubes.Turquoise circular faces and curved cylindrical faces together form the filler surface area within the model cube.The particles have been truncated beyond the model cube(a)two parallel filler particles with overlap d(b)Cross section showing filler particles positioned off the diagonal to give asymmetry(c)two filler particles,one parallel to the z-axis and the other parallel to the x-axis and offset from the first.
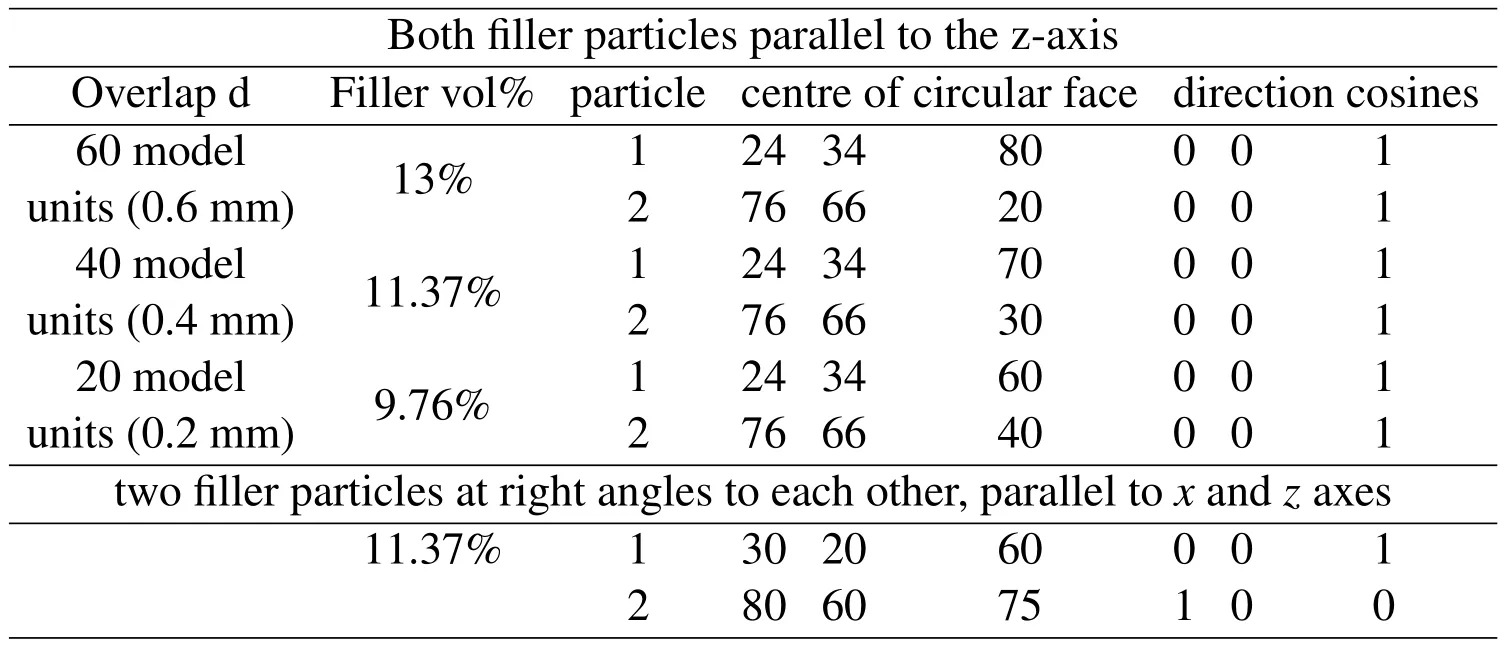
Table 2:Parameters for two filler particles.

Table 3:The time taken for the radius of the pores to grow large enough to create 40%porosity within the matrix and the percentage coverage of the surface area of the filler particles by the pores for an overlap of 40.
The relationship between the overlap and the matrix-filler connection is shown in Tab.3.The case of two perpendicular filler particles was chosen to investigate the most extreme orientations that could arise relative to the stress axis.As the filler particles were allocated different strengths axially and longitudinally in the fracture model,the orientation relative to the stress axis was considered to be important in promoting fracture during the finite element analysis.Each filler particle,as before,was modelled as a circular cylinder with one planar face within the model and radius equal to 16 model units.In order to accommodate the different orientations it was necessary to make one particle smaller than the other.One particle occupies 4.87%of the model cube,the other 6.50%giving a total of 11.37%filler.The same number of pores was included as in the previous arrangement.Table 4 shows the porosity within the matrix component and the time taken for the pores to reach the required radius.The final column gives the percentage by area of the surfaces of the filler particles covered by pores.The growth simulation was repeated using the same geometry but with the pores initiating at different times.The time scale was determined by identifying the factor which produced 20%porosity in the matrix when half of the pores had initiated.
Previous models had the axis of each filler particle positioned parallel to one of the model cube faces.In order to introduce a more general arrangement,the filler particles were tilted differently while retaining their mutually parallel relationship.Models were produced for 20%,30%,40%,50%,60%porosity.The change in orientation was extended and combined with changes to the positions of the filler particles to investigate the role of the overlap between the two filler particles.In total six models were generated with permutations of two different orientations and three different overlaps all for 40%porosity.The positions were chosen asymmetrically so that by rotating the model cube,more geometries could be investigated using the finite element fracture software(Tab.5).
5 Results
Results for the data sets given with their reference codes in Tab.6 are presented in Fig.7.Unless otherwise stated all sets have 40%porosity.The model characteristics of the reference data set,fill2a40 are:(i)loading in z-axis,(ii)particles are parallel to each other and parallel to z-axis,(iii)overlap of particles is 60 modelunits,(iv)40%porosity in matrix and(v)particle strength is reduced to 25%in direction which is not the axis of the particle.

Table 5:Parameters for two parallel filler particles with varying overlap.
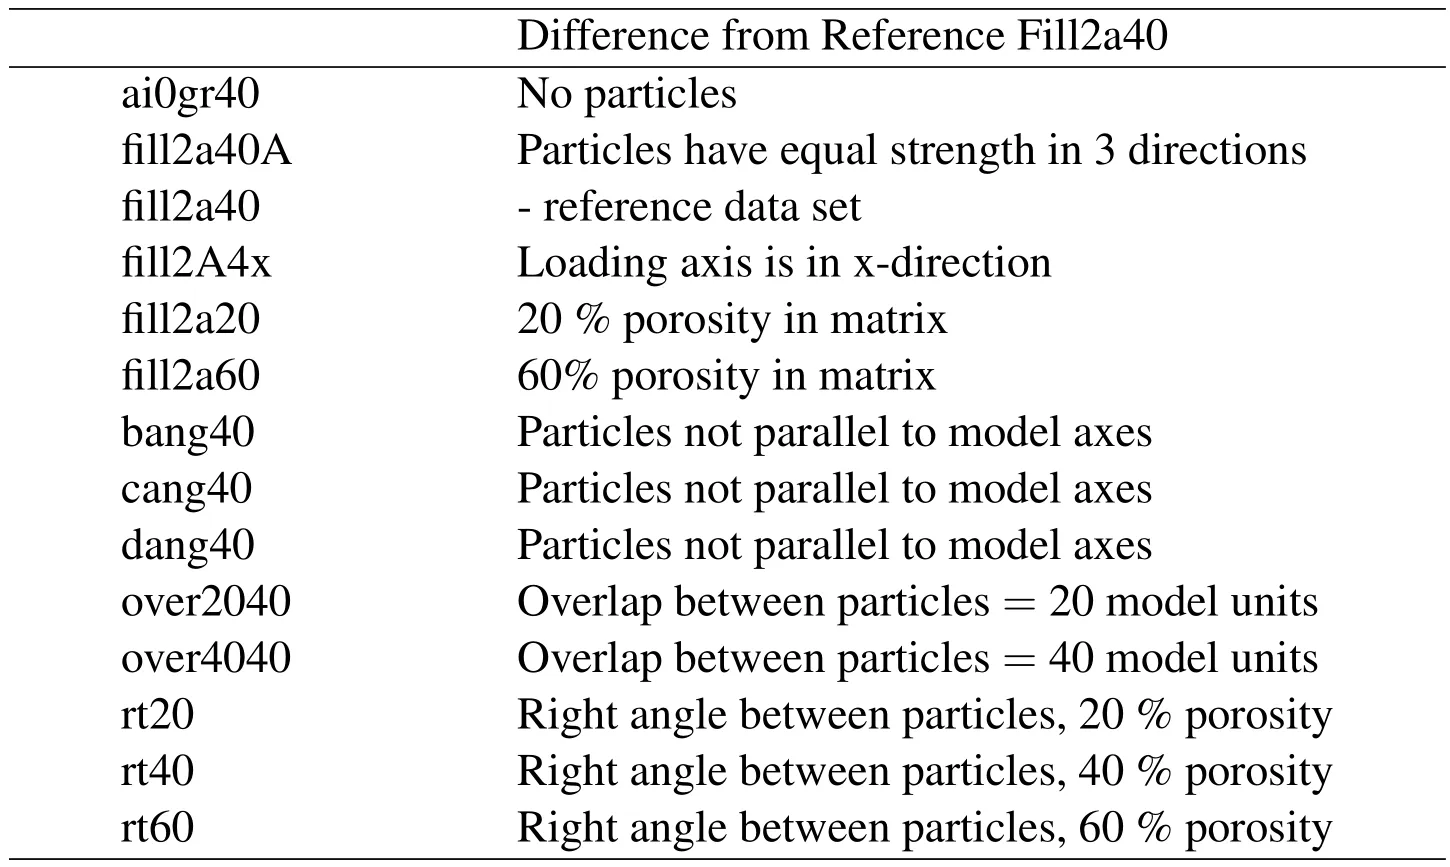
Table 6:Data sets subject to FE fracture analysis.
Fig.7(a)shows the stress-strain curves for three models:one with no filler particles,one with filler particles with equal strengths in all three directions and one with a strength reduction to 25%in one direction.There is little difference in the response between the two models with filler particles.The failure of single beam elements in the lattice create small drops in the stress strain curves.The next beam fails at a smaller strain than the previous failure leading to a decrease in strain in the model.These local snap-backs occur in the model as each step represents the fracture of one beam.Experiments under deformation control do not produce this snap back because the deformation increases monotonically.In an experiment a crack which propagates over a somewhat larger distance would be the result of such a local snap-back.Fig.7(b)compares stress-strain curves for the same parallel filler particles when the loading direction is changed.Fig.7(c)shows the stress strain curves for four models with parallel particles that are not parallel to the major axes.Fig.7(d)shows the stress-strain curves for models with two parallel filler particles and porosity of 20%,40%and 60%.Lower stiffness,lower strength and more post-peak strain are seen as porosity increases.The simulation “fill2A40”with 40%porosity shows a drop in the post-peak stress-strain curve that corresponds to the moment when the filler particle breaks.
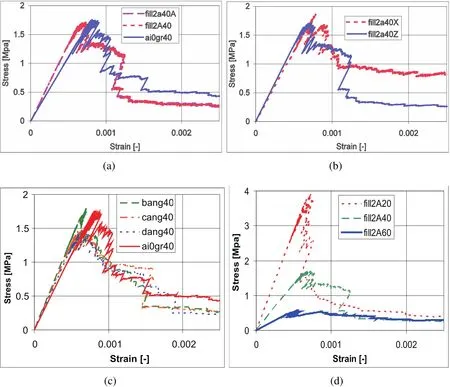
Figure 7:(a)Effect of filler particle presence and strength on the stress-strain curve,(b)effect of loading direction,(c)stress-strain curves for models with particles tilted to the stress axis and(d)stress-strain curves for simulations with 20%,40%and 60%porosity.
Fig.8 shows the crack patterns,both with and without the particles as porosity increases.Cracks that occur in the pre-peak regime of the stress-strain curve are plotted in blue and those in red occur post-peak.In all cases the crack bypasses one particle and fractures the other.As the porosity increases,the cracks become more distributed.The final case(60%porosity)includes a partial pull-out of the filler particles.The overall stress-strain and fracture characteristics predicted by the model are consistent with quasi-brittle fracture and many of the experimental observations of polygranular graphite.

Figure 8:Final crack patterns in simulations for 1 mm cubes with 20%(a),40%(b)and 60%(c)porosity;in the first three the complete final crack pattern is shown;in the others the same crack pattern is shown with the particles.Blue elements show cracks prior to the peak load while red elements show cracks after the peak load.
6 Discussion
The validation of analytic and computer-based models of materials is based on their ability to predict the physical properties that are observed experimentally.In materials with several microstructural components,the distribution of these may not be uniform leading to a wider spread in measured and predicted values than in less complex materials.Samples trepanned from reactor bricks are used to create test specimens to measure the physical properties of the graphite.Examination of these samples shows that the microstructure of PGA graphite is very variable even within a single specimen.Fig.9(a)and(b)shows respectively both high and low porosity regions within the same sample of PGA graphite arising from the manufacturing process.
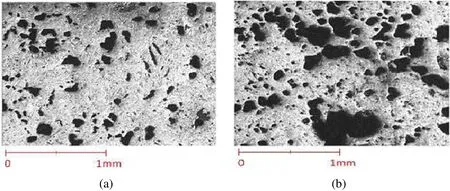
Figure 9:Typical porosity in a sample of PGA graphite showing the heterogeneity in the material(a)lower porosity and a local region containing larger pores(b).
Polygranular aggregate graphites do not deform plastically and are generally regarded as quasi-brittle materials[Heard,Wootton,and Moskovic(2011);Heard,Wootton,Moskovic,and Flewitt(2010);Hodgkins,Hodgkins,Marrow,Wootton,Moskovic,and Flewitt(2010);Hughes,Heard,and Wootton(2008);Marrow,Wootton,Moskovic,and Flewitt(2008)].They exhibit strain softening that occurs after the peak load and macro-crack initiation involves a prior formation of a process zone see Nakhodshi,Smith,and Flewitt(2013).Propagation of the crack is achieved by the release of elastic strain energy which exceeds the crack growth resistance but at some point becomes lower than this resistance.The resulting outcome is crack arrest prior to a complete break of the specimen.Indeed it is the formation of micro-cracks which limits the ability of the graphite to store elastic strain energy[Moskovic,Heard,and Flewitt(2013);Burchell(1996)].Load versus displacement results,for example Fig.2,obtained from mechanical testing provide evidence of this fracture behaviour.Different non-linearity and cracking behaviour are seen in flexural and diametral compression tests and are associated with different stress states.The formation of stable micro-cracks,occurring on the rising part of the load versus displacement curve prior to the peak load(force),result in non-linearity in flexural tests[Nakhodshi,Smith,Flewitt(2013)].If stable microcracking continues,the load(force)may continue to decrease but more slowly as displacement increases.The initiation and propagation of a large micro-crack is accompanied by a large load drop and limits post-peak stable displacement.The release of some elastic strain energy during the formation of small micro-cracks reduces the potential energy and if the rate of energy release is greater than that absorbed by the creation of new surfaces,propagation will continue.If this condition is not met,cracks become inactive and stationary.As a consequence,a growing crack may be forced to deviate from a straight path to avoid obstacles,generally filler particles.The microstructural models have been created to allow investigation of the direction change imposed by filler particles.
The FE results for the computer models show that as the percentage porosity increases,the non-linearity of the stress-strain curves pre-peak load become more pronounced and the susceptibility to micro-crack initiation and growth increases.Experimental observation and computer modelling support the same conclusions.Both show that micro-cracking is an energy absorbing process accompanied by a continual increase of elastic stress and strain.This leads to an increase in stored elastic strain energy.Although the modelling is based on a simplified representation of the microstructure,it allows the stress-strain and fracture characteristics to be explored at the microscale.It provides an insight into the response of reactor core graphites for a range of input parameters.The predicted cracking involves a combination of cracking of the matrix and filler particles and debonding at the matrix to particle interfaces.As porosity increases,the micro-cracks become more distributed.In the case of all the specific geometries modelled,the crack avoids one particle and fractures the other.Higher porosity in the matrix results in partial pull-out of filler particles.In addition to porosity in the matrix,for PGA graphite another important factor is the loading direction relative to the direction of alignment of the particles.The overall stress-strain relationship and the fracture characteristics are broadly consistent with many of the quasi-brittle experimental observations for polygranular graphite,described in section 2 of this paper.
A comparison is made in Figs.3(a)and(b)between the normalised elastic modulus and the fracture strength with weight loss for the model predictions and experimental data acquired for PGA reactor core graphite.Certainly the trends with increasing porosity predicted from the modelling and these experimental data are in reasonable agreement.However,as expected,the absolute values for both moduli and fracture strengths are under-predicted.There are several known reasons for these differences.First the model considers a small representative volume of material so that no account is taken of variation in these parameters within and between samples.These variations are the result of inherent heterogeneity arising from the original manufacturing process.However subsequent extensions of the model to the centimetre length-scale,accommodate such variability[Smith,Flewitt,and Hodgkins(2014);Smith,Flewitt,and Schlangen(2013)].Secondly the input values have been selected from unirradiated PGA graphite.Ideally these values should correspond to the properties of specific regions of the overall microstructure,to filler particles and matrix that do not contain macroscale pores.It is proposed to obtain this data in the future using the microscale cantilever beam testing procedure described by Darnborough,Liu,and Flewitt(2013).However it should be noted that the output from the present model scales linearly with the values of the main input parameters.It is important to recognise that these local models provide information relating to trends in data and also as input to a larger multi-scale approach[Smith,Flewitt,and Schlangen(2013)].
7 Conclusions
From the modelling of the graphite with filler particles and porous matrix the following conclusions can be drawn:
(i)higher porosity lowers stiffness,reduces elastic modulus,
(ii)the model predicts non-linear stress-strain(load-displacement)behaviour prepeak stress and non-linear stress-strain behaviour post-peak stress,
(iii)pre-peak cracking is predicted and more distributed cracking occurs with increased porosity.When the load direction is close to the axis of the particles,cracks bypass one particle but fracture the other.
(iv)when the loading direction is perpendicular to the long axis of the particles,particles crack(pre-peak cracking)especially at lower porosities,because in that case the matrix component is stronger.At higher porosity particles may debond
Acknowledgement:This work was supported by Magnox Ltd and the Engineering and Physical Sciences Research Council[grant EP/J0 19801/1].The authors would also like to thank Magnox Ltd.for their permission to publish this paper.
Bazant,Z.P.;Planas,J.(1998):Fracture and size effect in concrete and other quasi-brittle materials,CRC Press,Boce Raton,USA.
Becker,T.H.;Marrow,T.J.;Tait,R.B.(2011):Damage,crack growth and fracture characteristics of nuclear grade graphite using the double torsion technique.J Nuclear Materials,vol.414,pp.32–43.
Becker,T.H.;Marrow,T.J.;Tait,R.B.(2011):An evaluation of the double torsion technique.Exp Mech,pp.1–16.
Becker,T.H.;Mostafavi,M.;Tait,R.B.;Marrow,T.J.(2012):An approach to calculate the j-integral by digital image correlation displacement field measurement.Fatigue&Fracture of Eng Materials&Structures,pp.35.
Berton,S.;Bolander,J.E.(2006):Crack band model of fracture in irregular lattices.Computer Methods in Applied Mechanics and Engineering,vol.195,pp.7172–7187.
Brown,L.M.(2012):Constant intermittent flow of dislocations:central problems of plasticity.Mat.Sci and Tech,vol.28,pp.1209–1232.
Burchell,T.D.(1996):A microstructurally based fracture model for polygranular graphites.Carbon,vol.34,no.3,pp.297–316.
Darnborough,J.;Liu D.;Flewitt,P.E.J.(2013):Measurement Science and Tech,vol.24,pp.5010.
Flewitt,P.E.J.;Wootton,M.R.(2013):Structural integrity of nuclear power plant.Proceedings of the TAGSI/FESI Symposium,editors J.F.Knott and B.Tomkins,EMAS Pub.
Heard,P.J;Wootton,M.R.;Moskovic,R.(2011):Deformation and fracture of irradiated polygranular pile grade A reactor core graphite.J.Nuclear Material,vol.418,pp.223–232.
Heard,P.J.;Wootton,M.R.;Moskovic,R.;Flewitt,P.E.J.(2010):Crack initiation and propagation in pile grade A(PGA)reactor core graphite under a range of loading conditions.J.Nuclear Materials,vol.401,pp.71–77.
Hodgkins,A.;Marrow,T.J.;Wootton,M.R.;Moskovic,R.;Flewitt,P.E.J.(2008):A consideration of the effect of radiolytic oxidation on fracture of reactor core graphites;securing the safe performance of graphite reactor cores,Nottingham,Ed.G.Neighbour.R.Soc.Chem(London),pp.171–177.
Hodgkins,A.;Marrow,T.J.;Wootton,M.R.;Moskovic R.;Flewitt,P.E.J.(2010):Fracture behaviour of radiolytically oxidised reactor core graphites:a view.Mat Sci and Tech,vol.26,pp.899–907.
Hughes,G.M.;Heard P.J.;Wootton,M.R.(2008):Examination of the pore structure of virgin PGA graphite using focussed ion beam microscopy and Amira 3-Dreconstruction software.University of Bristol,Interface Analysis Centre Report GMH/IAC/06/07/C01(available on request).
Joyce,M;Marrow,T.J.;Mummery,P.;Marsden,B.J.(2008):Observation of Microstructure deformation and damage in nuclear graphite.Eng Fracture Mechanicsx,pp.3633–3645.
Karihaloo,B.L.(1995):Fracture mechanics and structural concrete,Longmans Scientific and Technical(Harrow).
Karihaloo,B.L.;Shao,P.F.;Xiao,Q.Z.;(2003):Lattice modelling of the failure of particle composites.Eng Fracture Mech,vol.70,pp.2395–2406.
Kelly,B.T.(2000):The structure and manufacture of nuclear graphite in irradiation damage in graphite due to fast neutrons in fission and fusion systems,IAEATECDOC-1154,IAEA.
Kelly,B.T.(1981):Physics of graphite,Applied Science(London).
Marrow,T.J.;Hodgkins,A.;Joyce,M.;Marsden,B.J.(2006):Damage nucleation in nuclear graphite.Energy Materials,vol.1,pp.167–170.
Moskovic,R.;Flewitt,P.E.J.;Schlangen,E.;Smith,G;Crocker,A.G.;Hodgkins,A.;Heard,P.;Wootton,M.R.(2014):Understanding fracture behaviour of PGA reactor core graphite:a perspective.Mat Sci and Tech,vol.30,pp.129–145,Doi 10 1179/17432847138.0354.
Moskovic,R.;Heard,P.J.;Flewitt,P.E.J.(2013):Overview of strength propagation and fracture in nuclear reactor moderator graphite.Nuc Energy and Design,vol.263,pp.431.
Nakhodshi,S.;Smith,D.J.;Flewitt,P.E.J.(2013):J Mat Science,vol.4,pp.720–732.
Rose,A.P.G.;Tucker,M.O.(1982):A fracture criterion for nuclear graphite.J Nuclear Material,vol.110,pp.186–195.
Schlangen,E.(2008):Crack development in concrete,Part 1:fracture experiments and CT scan observation,in advances in fracture and damage mechanics VII.Key Eng Mat,vol.699,pp.385–388.
Schlangen,E.;Garboczi,E.J.(1997):Fracture simulations of concrete using lattice models:computational aspects.Eng.Fracture Mech,vol.57,pp.319–332.
Schlangen,E.;van Mier,J.G.M.(1992):Experimental and numerical analysis of micromechanisms of fracture of cement-based composites.Cem.Conc.Composites,vol.14,pp.105–118.
Schlangen,E.;Qian,Z.(2009):3D modelling of fracture in cement-based material.J Multiscale Modelling,vol.1,no.2,pp.1–17.
Smith,G.E.;Flewitt,P.E.J.;Hodgkins,A.(2014):Modelling porosity in quasibrittle reactor core graphite.Key Eng.Mat,vol.577–578,pp.337.
Smith,G.E.;Flewitt,P.E.J.;Schlangen,E.(2013):Multi-scale modelling of nuclear reactor core graphite.J Multiscale Modellingvol.5,no.1,pp.135004.
Timoshenko,P.(1921):On the correction factor for shear of the differential equation for transverse vibrations of bars of uniform cross-section,Phil Mag,pp.744.
Tsang,D.K.L.;Marsden,B.J.(2008):Constitutive model for the prediction of stresses in irradiated anisotropic compounds.J Nuc Mat,vol.381,pp.128.
Tsang,D.K.L.;Shi,L.;Fok,S.L.;Marsden,B.J.(2003):Development and application of continuum damage mechanics model for nuclear graphites,University of Manchester,U.K.Report MAN/MSE/NGRG/R/115.
Tucker,M.O.;Rose,A.P.G.;Burchill,T.D.(1986):Carbon,vol.24,pp.581.
Yaghi,A.Y.;Hyde,T.H.;Becker,A.A.;Walker,G.(2004):The integrity of graphite blocks in nuclear reactors,University of Nottingham Report,GRA/AHY/040806.(available on request).
 Computers Materials&Continua2016年3期
- Computers Materials&Continua的其它文章
- Higher-Order Line Element Analysis of Potential Field with Slender Heterogeneities
- Fracture Characterization of High-Density Polyethylene Materials Using the Energetic Criterias
- A Numerical Study Comparing The Effect on Residual Stresses of Two Different Types of Projectiles During Shot Peening
