The hydraulic characteristics of end-dump closure with the assistance of backwater-sill in diversion channel*
He LU (陆贺), Zhi-gen HU (胡志根), Quan LIU (刘全), Guo-xuan LÜ (吕国轩), Jian-quan YE (叶建群),Jin-ming Ren (任金明)
1. The State Key Laboratory of Water Resources and Hydropower Engineering Science, Wuhan University,Wuhan 430072, China, E-mail: luhe_sd@whu.edu.cn
2. Huadong Engineering Corporation Limited of Powerchina, Hangzhou 310014, China
The hydraulic characteristics of end-dump closure with the assistance of backwater-sill in diversion channel*
He LU (陆贺)1, Zhi-gen HU (胡志根)1, Quan LIU (刘全)1, Guo-xuan LÜ (吕国轩)2, Jian-quan YE (叶建群)2,Jin-ming Ren (任金明)2
1. The State Key Laboratory of Water Resources and Hydropower Engineering Science, Wuhan University,Wuhan 430072, China, E-mail: luhe_sd@whu.edu.cn
2. Huadong Engineering Corporation Limited of Powerchina, Hangzhou 310014, China
The river closure is a key step in the water dam construction, and the end-dump closure is a general way to cut off the river flow. The hydraulic characteristics at the closure gap are the main factors which affect the extent of closure difficulty. A method is proposed to reduce the difficulty of diversion channel closure by pre-building a closure structure called the backwater-sill at the downstream toe of the closure gap to change the flow pattern at the closure gap. The results of the physical model test and the threedimensional numerical simulation indicate that the backwater-sill has the effects of raising the water level at the downstream toe of the closure gap, decreasing the water surface gradient, and reducing the closure drop and the flow velocity at the closure gap. The schemes with different dike widths, different closure gap widths, and different backwater-sill widths and heights are simulated. The results show that the height of the backwater-sill is the key factor affecting the hydro-indicators at the closure gap, while the influence of the dike width, the closure gap width or the backwater-sill width can be ignored. The higher the backwater-sill is, the lower the hydro-indicators will be. Based on the numerical simulations and the physical model tests on the hydraulic characteristics at the closure gap of the backwater-sill assisted closure, the hydro-indicators and its calculation method are proposed to provide a theoretical support for the river closure.
diversion channel closure, closure structure, end-dump closure, backwater-sill, hydraulic characteristics
Introduction
In the construction of water dam projects, the flow in the riverbed should be cut off, and then the upstream and downstream cofferdams can be filled to temporarily protect the construction pit against the river water. In this way, the hydraulic structures (dam base) can be constructed in a dry riverbed. The process of cutting off the river and leading the flow into a discharge structure is called the river closure. The closure by dike or dikes is the most frequently-used method of river closure[1], which begins with casting the riprap and other materials into the water flow, forming a closure dike, and gradually narrowing the river flow,and ultimately ends with closing the river. The closure methods of the dike can be classified into the transverse-dump, the end-dump and the transverse-end-dump,as well as the single dike, the wide dike, the double dikes and the multiple dikes. The difficulty of a closure project can be evaluated in 3-D[2]. The first dimension is the scale of the closure project, which includes the dumping quantities, the diversion structure scale and the construction intensity, and can be represented by the closure flow discharge Q. The second dimension is the construction safety, which is related to the slump scale of the dike head during the process of the closure dike construction, and can be represented by the water depth at the closure gap. The last dimension is the diameter of the closure material, which is determined by the hydro-indicators at the closure gap,such as the closure drop and the average velocity. For a particular river closure project, the first two factors can be considered to be fixed, determined by the envi-ronment where the closure project is located. Thus, the effective way to reduce the closure difficulty is to reduce the hydro-indicators at the closure gap.
The flow pattern and the mechanical conditions of the riverbed at the closure gap determine the stability of the closure materials. The hydraulic characteristics of the closure gap is an important issue of the closure design. Meng et al.[3]and Hu et al.[4]studied the hydraulic characteristics of the closure gap in the end-dumping closure with a single dike. Wu and Molinas[5]and Chiang et al.[6]studied the discharge characteristics and the energy losses of local discontinuous contractions. Koken and Constantinescu[7]studied the hydraulic control conditions of the enddump closure with double dikes. Lu and Du[8]studied the hydraulic characteristics of the gap closing with large framed cages. Wang et al.[9]developed and integrated 1-D and 2-D mathematical models to simulate the hydraulic conditions of the TGP's third-stage open channel closure. Chen and Shen[10]studied the hydraulics characteristics of the close gap in large-scale beach reclamation works. Choi et al.[11], Ha et al.[12]and Van Der Sande[13]described the construction of the tidal dikes and predicted the real-time flow fields during the gradual closure operation in the final stage. Another important issue is the stability of the closure materials. Hoan et al.[14]studied the stone stability in non-uniform flow. Escarameia and May[15]studied stability of riprap and concrete blocks in highly turbulent flows. Das[16]studied the stability of rockfill in end-dump river closures. Elkholy and Chaudhry[17]investiga- ted on the trajectory of large sandbags in open channel flow. For the closure in a deep water, Zhou et al.[18]built a theoretical model to calculate the slump of the dike head during the process of the cofferdam construction. For the closure on a deep-thickness covering riverbed, Li et al.[19]suggested some safety control countermeasures.
However, the above-mentioned studies mainly focused on the flow characteristics and the stability of the closure materials, without much discussions on reducing the difficulty of the closure. In a general closure design, the closure dike advancing is regarded as a main approach to break the flow, hence the selection of an appropriate closure method, with a suitable size of the riprap, a dumping intensity, and a discharge capacity of diversion structures, is the main concern,which often means high costs in general. Since all the construction conditions could be taken as the results of the construction scheme, the flow characteristics during the closure dike filling progress can be considered as a disturbance caused by the closure system. And all kinds of closure methods, such as the wide dike, the double dikes, the multiple dikes and the transverse-end-dump, are to create an intentional situation for specified flow characteristics. Therefore, it is feasible and necessary improving the hydraulic characteristics at the closure gap and decreasing the closure difficulty through a temporary closure structure.
Following the above idea and taking account of the diversion channel conditions: with a large closure discharge, a low discharge capacity of the diversion structure, high hydro-indicators in the closure gap, a smooth channel bed and the poor stability of closure materials, a method is proposed to reduce the difficulty of the channel closure by pre-building an auxiliary closure structure called the backwater-sill, as shown in Fig.1. Before the excavation construction of the diversion channel, the upstream and downstream cofferdams will be constructed previously to ensure that the diversion channel can be constructed on a dry ground,which provides a convenient condition for the installation of the backwater-sill. There are three ways to install the backwater-sill. If the bedrock is of good quailty, the backwater-sill can be installed by reserving and reinforcing the rock ridge. If the bedrock is of loose rubble, the backwater-sill can be installed by pouring concrete or installing a rock-filled steel cage. The backwater-sill is essentially a low submerged groin, with little impact on the discharge capacity of the diversion channel in a flood season. The intention of the backwater-sill is to raise the water level at the downstream toe of the closure gap, lower the flow velocity at the closure gap, save the closure materials and finally reduce the difficulty of the channel closure.
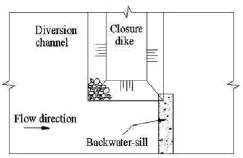
Fig.1 Schematic diagram of end-dump closure with the assistance of backwater-sill
In this paper, the 3-D Reynolds Averaged Navier-Stokes equations and the two-equation RNG -kε turbulence model are employed to investigate the influence of the backwater-sill on the flow pattern at the closure gap of the end-dump closure, and the hydroindicators of the end-dump closure with the assistance of the backwater-sill and its calculation method are proposed.
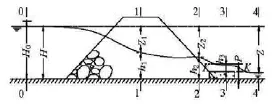
Fig.2 Water surface profile at the closure gap of the backwatersill assisted closure
1. Analyses of hydro-indicators at the closure gap
As shown in Fig.2, according to the energy equation between the cross sections 0-0 and 3-3,

where H, 0α and 0v, respectively, denote the water depth, the kinetic energy correction factor and the velocity at section 0-0, g is the acceleration of gravity,P is the height of the backwater-sill,3h,3α and3v,respectively, denote the water depth, the kinetic energy correction factor and the velocity at section 3-3,1ξ is the local head loss coefficient of the closure gap inlet,2ξ is the local head loss coefficient of the backwatersill, λ is the friction factor of the head loss between sections 0-0 and 3-3.
Let


where0H is the total head at section 0-0, φ is the flow rate coefficient.
From Eqs.(1)-(3), we have

Let
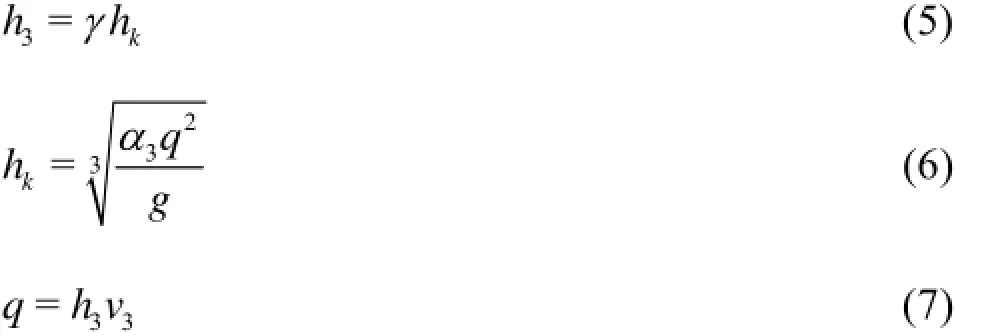
where γ is the submerged coefficient,kh is the critical depth of the cross section 3-3, q is the discharge per unit width.
From Eqs.(4)-(7), we have

Let

then

where0m is the discharge coefficient.
According to the energy equation and the continuity equation between the cross sections 2-2 and 3-3,we have

where2β,2α and2v, respectively, denote the nonhydrostatic coefficient, the kinetic energy correction factor and the flow velocity at section 2-2,2λ is the friction factor of the head loss between sections 2-2 and 3-3.
From Eqs.(5), (6), (11), we have

Let

then

From Eqs.(10), (12), (16), we have

Equation (17) can be solved implicitly for2h and hence for the closure drop2Z if the total head0H,and the discharge coefficients0m and1m are known. H0is typically close to H. The affecting factors and the relationships will be developed below to determine the discharge coefficients0m and1m.The water depth at the axis section of the closure gap which is normal to the flow direction is the foundation of the calculation of other hydro-indicators. Practice shows that the factors affecting the flow depth at the axis section are complex. Zhao et al.[20]suggested that the closure drop between sections 0-0 and 1-1 should be determined by a test curve,

then

where1Z is the closure drop between sections 0-0 and 1-1, 1h is the flow depth at the axis section of the closure gap which is normal to the flow direction.
2. Mathematical model and its numerical method
2.1Mathematical model
2.1.1Governing equations
The flow at the closure gap is governed by the continuity and Reynolds averaged Navier-Stokes equations.
The continuity equation is as follows

And the Navier-Stokes equation is as follows

wherexu,yu and zu are the velocity components in x, y and z directions, respectively,iu,iG andif,respectively, denote the velocity component, the acceleration due to gravity and the viscous forces in the i direction, where i can be the x, y and z directions,ρ is the fluid density, and p is the pressure on the fluid microelement.
The RNG -kε model is accurate in simulating the flow with streamlines of large strain rates and large degrees of curvature, and is suitable for analyzing a complex flow with large curvature, rotation and separation[21]. This model is adopted to simulate the complex flow at the closure gap.
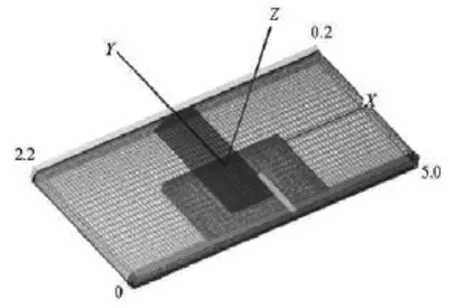
Fig.3 Schematic diagram of mesh (m)
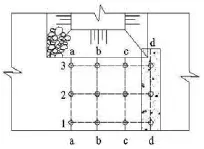
Fig.4 The layout of measurement points at the closure gap of model test

Fig.5 The flow pattern at the closure gap
k-equation

ε-equation


Table 1 Comparison of the simulation results and experimental results
where μ is the molecule viscosity coefficient,tμ is the turbulent viscosity coefficient, which can be obtained from the turbulent energy k and the turbulent energy dissipation rate ε, Cμ=0.0845, Gkis the production of the turbulence kinetic energy due to the velocity gradients, Gk=μt(∂μi/∂xj+∂μj/∂xi)(∂μi/∂xj), αk, αεare respectively, the turbulence Prandtl numbers for k and ε,==1.39,=-η(1-η/)/(1+βη3),, C, β and η are the2ε0empirical coefficients, C2ε=1.68, C1ε=1.42, β=modulus of the mean strain tensor.
2.1.2Boundary conditions
The interfaces between the water and the riverbed are rigid boundaries, where the boundary condition is the no-slip condition. The inflow boundary is a specified pressure boundary, and the outflow boundary is the free flow boundary or a specified pressure boundary.
The boundary condition of the water-air interface is treated by the VOF method, which was first proposed by Hint, see Refs.[22,23]. The basic principle is to determine the position and the shape of the saturated surface by solving the function F, which is defined as the ratio of the fluid volume over the total volume in a computational cell. There are three cases for the water volume fraction, namely: =0F, =1F and 01F<<, which means, respectively, that the cell is full of gas, full of water and contains the water-air interface[24]. The saturated surface can be obtained by solving the following transport equation

2.2Numerical method
In the numerical simulation, structured rectangular grids are used and mesh-nesting techniques are adopted to cut down the number of grids, as shown in Fig.3. The finite volume method (FVM) is used to discretize the governing equations over the control volume, and the GMRES algorithm[25]is used to handle the coupling between the pressure and the velocity in the numerical simulation.
2.3Validation
To verify the accuracy of the numerical model in simulating the flow at the closure gap, a comparative analysis is performed based on the results of physical model tests and those of numerical calculations. The channel model is 2 m wide and 12 m long, with overflow weirs for discharge. The top width of the closure dike is 0.5 m and the bottom width is 0.8 m. The backwater-sill is 0.6 m long, 0.025 m high and 0.086 m wide. The flow discharge is 0.05 m3/s. In the experiment, the point velocity and the water level are measured with the handheld current meter and the level gauge.
The measuring point layout at the closure gap is shown in Fig.4. Figure 5 is a photograph of the flowpattern at the closure gap. Only a 5 m long channel,2.5 m upstream of the closure dike axis, is taken as the computational domain. The upstream water depth and the downstream water depth of the closure gap measured in the physical model are used as boundary conditions in the numerical model. In the numerical model,the roughness of the channel, the backwater-sill and the closure dike are, respectively, 0.013, 0.013 and 0.037. A comparison between the simulation results and the experimental data is presented in Table 1 and Fig.6. The simulation results generally agree with the experimental data.

Fig.6 Comparison of hydro-indicators at the closure gap between calculation and experiment
2.4Conditions in the experiment
The following analysis is related to the results of physical model tests and numerical simulation experiments. Table 2 shows the parameters evaluated. Results and discussions
3. Results and discussions
3.1Impact of the backwater-sill on the flow pattern at the closure gap
In order to study the effect of the backwater-sill on the flow pattern at the closure gap, a comparative analysis of end-dump closure with or without the assistance of backwater-sill is made. The sizes of the diversion channel and the closure dike are the same as those of the physical model. The crest width of the closure gap is 0.6 m and the bottom width is 0.35 m,and the backwater-sill is 0.038 m high and 0.086 m wide. The inflow boundary of the model is a specified pressure boundary, and the water depth is 0.121 m. The outflow boundary of the model is a free flow boundary.
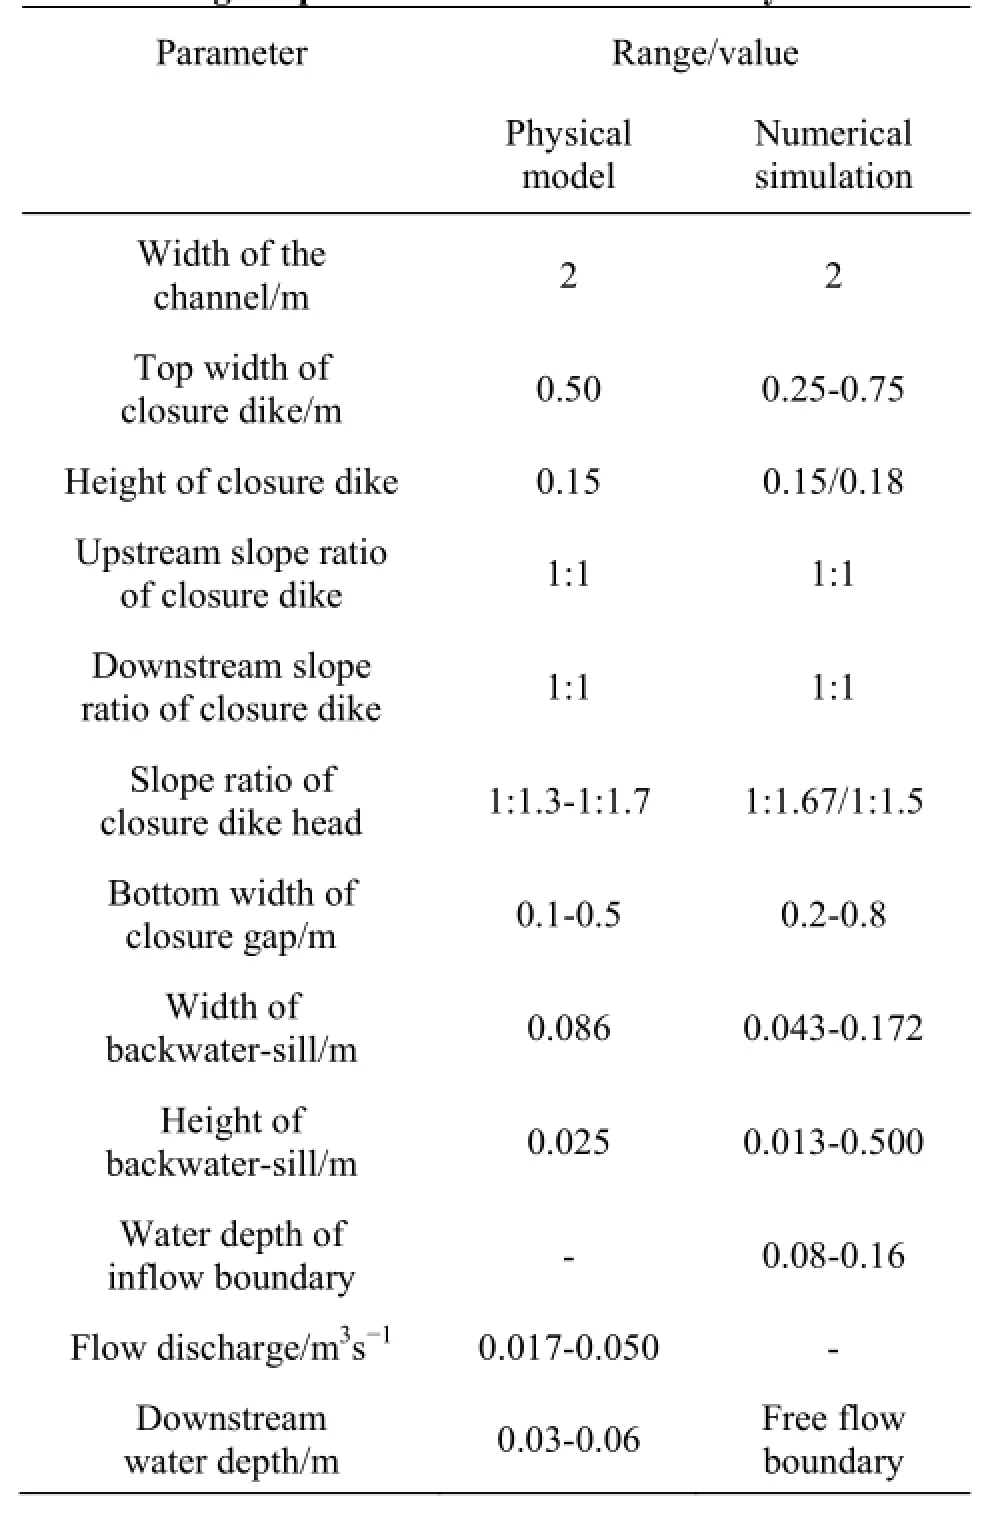
Table 2 Range of parameters evaluated in study
3.1.1Water free-surface
The water free-surface contour maps of the single dike closure and the backwater-sill assisted closure are shown in Fig.7, where FD means flow direction and TFD means transverse to the flow direction. Along the flow path, the water level of the single dike closure always drops, while the water level of the backwatersill assisted closure first drops and then rises. The water level at the closure dike upstream the toe of the backwater-sill assisted closure is 0.115 m and the water level at the downstream toe is 0.100 m. In contrast, the water level at the closure dike upstream the toe of the single dike closure is 0.110 m and the water level at the downstream toe is 0.060 m. These results indicate that the backwater-sill is quite effective in raising the water level at the downstream toe of the closure dike while having little influence on the water level at the upstream toe. The total drops of the backwater-sill assisted closure and the single dike closure are mostly the same, approximately, 0.08 m. The dropbetween the upper toe and the downstream toe of the closure dike of the single dike closure is 0.05 m,whereas the drop of the backwater-sill assisted closure is 0.01 m. The backwater-sill has the effects of raising the water level at the downstream toe of the closure gap, dividing the closure drop into two parts and decreasing the water surface gradient at the closure gap.

Fig.7 Contour map of water free-surface at the closure gap (m)
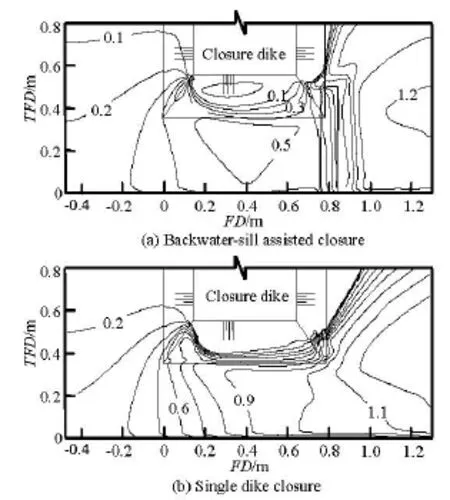
Fig.8 Contour map of average depth velocity at the closure gap (m/s)
3.1.2Average depth velocity
The distribution of the average depth velocity at the closure gap is shown in Fig.8. The backwater-sill has little influence on the flow velocity at the upstream of the closure dike. The average depth velocity in the single dike closure increases sharply along the flow path with the average depth velocity at the dike axis which is perpendicular to the flow line of 0.9 m/s. The average depth velocity changes little at the upper section of the backwater-sill with the average depth velocity of the dike axis which is perpendicular to the flow line of 0.5 m/s. The velocity increases rapidly as the water flows over the backwater-sill where the flow field has no effect on the size and the stability of the riprap. The average depth velocity at the closure dike upstream the toe of the backwater-sill assisted closure is 0.4 m/s and the average depth velocity at the closure dike downstream the toe is 0.5 m/s. In contrast, in the single dike closure scheme, the average depth velocity at the closure dike upstream the toe is 0.55 m/s and the average depth velocity at the downstream toe is 0.95 m/s. The backwater-sill has the effect of reducing the flow velocity significantly at the closure gap, decreasing the size of the riprap required, thus reducing the difficulty of the closure.
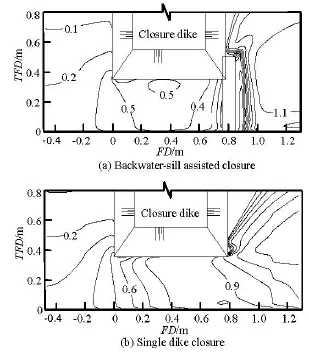
Fig.9 Contour map of channel-bed velocity at the closure dike (m/s)
3.1.3Channel-bed flow velocity
The flow velocity distribution at the channel-bed of the closure gap is shown in Fig.9. The channel-bed velocity of the single dike closure increases along the flow path, between the upper and downstream toes of the closure dike, resulting in an increase of the riprap loss and is not conducive to the stability of the riprap. The channel-bed velocity of the backwater-sill assisted closure first increases and then decreases. There is a low channel-bed flow velocity region in front of the backwater-sill that maintains the stability of the riprap. The channel-bed velocity at the closure dike downstream the toe of the backwater-sill assisted closure is0.2 m/s, which is far less than that at the single dike closure of 1.0 m/s.

Table 3 Summary of the main hydro-indicators at the closure gap
3.2Sensitivity analysis of backwater-sill assisted closure
The important specifications of the closure design with backwater-sill include parameters as follows: the closure dike width (CDW), the closure gap width(CGW), the backwater-sill width (BWSW) and the backwater-sill height (BWSH). The influence of the four aforementioned factors on the difficulty of the river closure could be analyzed by changing the CDW(0.25 m, 0.50 m, 0.75 m), the CGW (with bottom width of 0.2 m, 0.35 m and 0.5 m, crest width of 0.45 m, 0.60 m and 0.75 m), the BWSW (0.043 m,0.086 m, 0.129 m, 0.172 m), and the BWSH (0 m,0.013 m, 0.025 m, 0.038 m, 0.050 m), respectively, on the basis of Section 3.1.
As shown in Table 3 and Fig.10, where WTF means water free-surface, with the increase of the closure dike width, the water free-surface at the closure gap becomes more gentle, the water depth at the axis of the closure dike decreases slightly, the average velocity at the axis section of the closure dike increases slightly, the discharge per unit width of the closure gap and the closure drop between the upstream of the closure dike and the downstream toe of the closure dike basically stay the same. With the increase of the closure gap width, the water level at the downstream toe of the closure dike increases slightly, the closure drop between the upstream and the downstream toe of the closure dike decreases slightly, the average velocity at the axis section of the closure dike and the discharge per unit width of the closure gap basically stay the same. With the increase of the back-water-sill width,the water level at the downstream toe of the closure dike increases slightly, the closure drop between the upstream and the downstream toe of the closure dike,the average velocity at the axis section of the closure dike, and the discharge per unit width of the closure gap decrease slightly at a decreasingly slow rate. This is due to the fact that with the increase of the backwater-sill width, the behavior of the backwater-sill turns from that of a thin-plate weir to that of a broadcrested weir, while the discharge capacity decreases slightly at a decreasingly slow rate. The height of the backwater-sill has a great impact on the flow pattern at the closure gap. Higher backwater-sill results in more obvious backwater effects, gentler upstream flow patterns, and lower hydro-indicators at the closure gap.
The results show that the height of the backwatersill is the main factor affecting the hydro-indicators at the closure gap, such as the flow discharge, the closure drop and the flow velocity, while the influences of the width of the closure dike, the width of the closure gap and the width of the backwater-sill can be ignored.
3.3Hydraulic calculation of closure gap
According to the above analysis, the flow pattern at the closure gap is mainly affected by the height of the backwater-sill, so are the hydro-indicators at the closure gap. The discharge coefficients0m and1m can be expressed as functions of the height of the backwater-sill P. Based on the results of numerical simulations and physical model tests in Section 2.4,the empirical formulas of the discharge coefficients m0and m1can be obtained by the regression analysis.
Figure 11 shows the relationship between m0and P/(H-P). Using the computer program Statistical Package for Social Sciences (SPSS), v19, a non-linear regression analysis is performed. The resulting regression equation, with a coefficient of determination=0.804, is

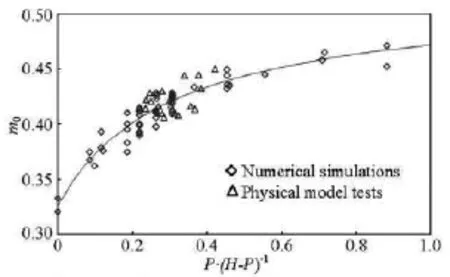
Fig.11 Discharge coefficient m0versus P/(H-P)
Figure 12 shows the relationship between1m and P/(h2-P). Using the computer program statistical package for social sciences (SPSS), v19, a non-linear regression analysis is performed. The resulting regression equation, with20.721 R=, is

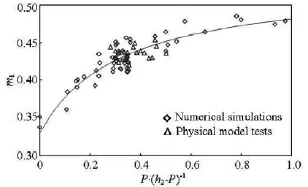
Fig.12 Discharge coefficient m1versus P/(h2-P)
Figure 13 shows the relationship between1/ZH and2/ZH. Using the computer program SPSS, v19,a non-linear regression analysis is performed. The resulting regression equation, with a coefficient of determination=0.819, is

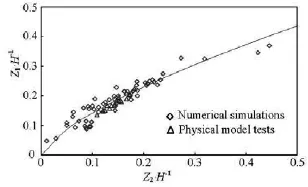
Fig.131/ZH versus2/ZH
4. Conclusions
For a particular river closure project, the hydroindicators at the closure gap are the key factors in determining the extent of the closure difficulty. The river closure is carried out under special conditions,and the hydro-indicators at the closure gap can be reduced by an auxiliary closure structure. Under the diversion channel conditions, an auxiliary closure structure is proposed, named the backwater-sill by prebuilding it at the downstream toe of the closure gap in the diversion channel to reduce the difficulty of the channel closure.
A 3-D mathematical model is employed to simulate and analyze the influence of the backwater-sill on the flow pattern at the closure gap of the end-dump closure with a single closure dike. The simulation results agree well with the results of physical model tests. Both results show that the backwater-sill has the effect of increasing the water level at the downstream toe of the closure dike, and decreasing the water surface gradient along the flow path upstream the back-water-sill,therefore the flow pattern at the closure gap becomes gentle and the velocity decreases. The sensitive analysis of the indicators shows that the backwater-sill height is the key factor that influences the flow pattern while the influence of the widths of the closure dike,the closure gap and the backwater-sill can be ignored. The higher the backwater-sill is, the lower the hydroindicators will be.
Discharge per unit width of the closure gap, the water depth and the velocity at the axis of the closure dike, and the closure drop between the upstream and the downstream of the closure dike are the main factors in estimating the difficulty of the closure. As the backwater-sill has the effect of increasing the water level at the downstream toe of the closure dike, the drop between the upstream of the closure dike and the downstream toe of the closure dike is employed to replace the closure drop between the upstream and the downstream of the closure dike in the hydraulic calculation. According to the theoretical analysis, the hydroindicator computational formulas of the end-dump closure with the assistance of the backwater-sill are deduced, which would provide a basis of the closure design.
Acknowledgements
The authors would like to thank QIU Ya-feng,ZHOU Jian, XIONG Yi, ZHENG Qiang and ZHU Wei for their help to complete the model test, and thank WANG Xin, SHU Wan for their help of proofreading the manuscript.
References
[1]DAI Hui-chao, HU Chang-shun and ZHU Hong-bing. The development of theory and science technology on diversion and closure of river[J]. Journal of Hydroelectric Engineering, 2005, 24(4): 78-83(in Chinese).
[2]BO Lin, GUO Hong-min and LIU Li-zhong. An understanding of difficulty and its countermeasures in river closure with end dumping method[J]. Journal of Yangtze River Scientific Research Institute, 2001, 18(4): 7-8(in Chinese).
[3]MENG Y., JIANG D. and JIN H. et al. Hydraulic analysis of Huaihe closure for Linhuaigang flood control project[C]. Advances in Water Resources and Hydraulic Engineering-Proceedings of 16th IAHR-APD Congress and 3rd Symposium of IAHR-ISHS. Nanjing, China, 2009, 1026-1031.
[4]HU Zhi-gen, MENG De-qian and HUANG Tian-run et al. Experimental study on hydraulic characteristics of gap in end-dumping closure with single embankment[J]. Journal of Hydraulic Engineering, 2011, 42(4): 414-418(in Chinese).
[5]WU B. S., MOLINAS A. Energy losses and threshold conditions for choking in channel contractions[J]. Journal of Hydraulic Research, 2005. 43(2): 139-148.
[6]CHIANG T. P., SAU A. and HWANG R. R. Asymmetry and bifurcations in three-dimensional sudden-contraction channel flows[J]. Physical Review E Statistical, Nonlinear and Soft Matter Physics, 2011, 83(4): 1-14
[7]KOKEN M., CONSTANTINESCU G. An investigation of the flow and scour mechanisms around isolated spur dikes in a shallow open channel: 2. Conditions corresponding to the final stages of the erosion and deposition process[J]. Water Resources Research, 2008, 66(22): 297-301.
[8]LU Yong-jin, DU Xiao-tao. Research on the hydraulic characteristics of gap closing with large framed cages[J]. Journal of Hydrodynamics, 2010, 22(5): 975-979.
[9]WANG G., WU B. and XIA J. Modeling of the diversion channel closure for the third stage of the Three Gorges Project[J]. International Journal of Sediment Research,2004, 19(1): 75-82.
[10] CHEN K. F., SHEN J. Hydraulics characteristics of the close gap in large-scale beach reclamation works in radial sandbanks[J]. Applied Mechanics and Materials, 2012,204-208: 2379-2383.
[11] CHOI B. H., HA Jae Wan and KO Kwang Oh et al. Tidal forecast for final closure of saemangeum tidal dike[J]. China Ocean Engineering, 2010, 24(3): 467-480.
[12] HA J. W., EO D and KIM K. O. et al. Final closure of the saemangeum tidal dike, South Korea[J]. Proceedings of the Institution of Civil Engineers-Maritime Engineering, 2010, 163(4): 147-156.
[13] Van Der SANDE M. B. Computational modeling on the final closure gaps in the Saemangeum dam[D]. Doctoral Thtsis, Delft, The Netherlands: Delft University of Technology, 2006.
[14] HOAN N. T., STIVE M. J. F. and BOOIJ R. et al. Stone stability in non-uniform flow[J]. Journal of Hydraulic Engineering, ASCE, 2011, 137(9): 884-893..
[15] ESCARAMEIA M., MAY R. W. P. Stability of riprap and concrete blocks in highly turbulent flows[J]. Ice Proceedings Water Maritime and Energy, 1995, 112(3): 227-237.
[16] DAS B. P. Stability of rockfill in end-dump river closures[J]. Journal of the Hydraulics Division, 1967, 98: 1947-1967.
[17] ELKHOLY M., CHAUDHRY M. H. Investigations on the trajectory of large sandbags in open channel flow[J]. Journal of Hydraulic Engineering, ASCE, 2012,138(12): 1060-1068.
[18] ZHOU Hou-gui, LIU Guang-ting and WANG Guang-qian. Calculation and prediction of the dyke end slump for deep water closure of the Three Gorges Project[J]. Journal of Tsinghua University (Science and Technology), 2002,42(2): 87-89(in Chinese).
[19] LI X., HUANG G. and CHENG Z. Deep-thickness covering layer riverbed closure difficulty and safety control countermeasures[C]. International Symposium on Hydraulic Physical Modeling and Field Investigation. Nanjing, China, 2010.
[20] ZHAO J., ZHANG H. and CHEN Z. et al. On-the-fly measurements of large-drop water level and high flow velocity in the closure gap[J]. Flow Measurement and Instrumentation, 2015, 45: 198-206.
[21] WANG Wen, HUAI Wen-xin and GAO Meng. Numerical investigation of flow through vegetated multi-stage compound channel[J]. Journal of Hydrodynamics, 2014. 26(3): 467-473.
[22] ZHANG Jian-ming, CHEN Jian-gang and XU Wei-lin et al. Three-dimensional numerical simulation of aerated flows downstream sudden fall aerator expansion-in a tunnel[J]. Journal of Hydrodynamics, 2011, 23(1): 71-80.
[23] ZHONG Deng-hua, ZHANG Xiao-xin and AO Xue-fei et al. Study on coupled 3D seepage and stress fields of the complex channel project[J]. Science China Technological Sciences, 2013, 56(8): 1906-1914.
[24] JIANG Chang-bo, DENG Bin and HU Shi-xiong et al. Numerical investigation of swash zone hydrodynamics[J]. Science China Technological Sciences, 2013, 56(12): 3093-3103.
[25] ZHAO L., OUYANG J. and ZHOU W. et al. The simpler GMRES method combined with finite volume method for simulating viscoelastic flows on triangular grid[J]. Advances in Engineering Software, 2015, 87: 57-67.
(November 14, 2015, Revised April 6, 2016)
* Project supported by the National Natural Science Foundation of China (Grant No. 51279137).
Biography: He LU (1988-), Male, Ph. D. Candidate
Zhi-gen HU,
E-mail: zhigenhu@163.com
- 水动力学研究与进展 B辑的其它文章
- The 2nd Conference of Global Chinese Scholars on Hydrodynamics 2016.11.11~14, Wuxi
- The mechanism of flapping propulsion of an underwater glider*
- A new design of ski-jump-step spillway*
- A water quality model applied for the rivers into the Qinhuangdao coastal water in the Bohai Sea, China*
- The numerical and experimental investigations of the near wake behind a modified square stay-cable*
- Natural convective heat transfer and nanofluid flow in a cavity with top wavy wall and corner heater*

