
Evaluation of cable tension sensors of FAST reflector from the perspective of EMI①
2016-12-05 01:28ZhuMingWangQimingDennisEganWuMingchangSunXiao
High Technology Letters 2016年2期
Zhu Ming(朱 明), Wang Qiming, Dennis Egan, Wu Mingchang, Sun Xiao
(*National Astronomical Observatories, Chinese Academy of Sciences, Beijing 100012, P.R.China) (**National Radio Astronomy Observatory, PO Box 2, Green Bank, WV 24944, USA)
Evaluation of cable tension sensors of FAST reflector from the perspective of EMI①
Zhu Ming(朱 明)②*, Wang Qiming*, Dennis Egan**, Wu Mingchang*, Sun Xiao*
(*National Astronomical Observatories, Chinese Academy of Sciences, Beijing 100012, P.R.China) (**National Radio Astronomy Observatory, PO Box 2, Green Bank, WV 24944, USA)
The active reflector of FAST (five-hundred-meter aperture spherical radio telescope) is supported by a ring beam and a cable-net structure, in which nodes are actively controlled to form series of real-time paraboloids. To ensure the security and stability of the supporting structure, tension must be monitored for some typical cables. Considering the stringent requirements in accuracy and long-term stability, magnetic flux sensor, vibrating wire strain gauge and fiber bragg grating strain gauge are screened for the cable tension monitoring of the supporting cable-net. Specifically, receivers of radio telescopes have strict restriction on electro magnetic interference (EMI) or radio frequency interference (RFI). These three types of sensors are evaluated from the view of EMI/RFI. Firstly, these fundamentals are theoretically analyzed. Secondly, typical sensor signals are collected in the time and analyzed in the frequency domain, which shows the characteristic in the frequency domain. Finally, typical sensors are tested in an anechoic chamber to get the EMI levels. Theoretical analysis shows that Fiber Bragg Grating strain gauge itself will not lead to EMI/RFI. According to GJB151A, frequency domain analysis and test results show that for the vibrating wire strain gauge and magnetic flux sensor themselves, testable EMI/RFI levels are typically below the background noise of the anechoic chamber. FAST finally choses these three sensors as the monitoring sensors of its cable tension. The proposed study is also a reference to the monitoring equipment selection of other radio telescopes and large structures.
five-hundred-meter aperture spherical radio telescope (FAST), cable tension monitoring, magnetic flux, vibrating wire, fiber Bragg, electro magnetic interference (EMI)
0 Introduction
Five-hundred meter aperture spherical radio Telescope (FAST), a project belonging to the National “Eleventh Five-Year” major scientific projects, will be the world’s largest single-dish radio telescope upon its completion. FAST will work in the frequency ranging from 70MHz to 3GHz[1].
As one of the three independent innovations of FAST, a main active reflector is realized through the initiative configuration of the cable-net. The initiative configuration of the cable-net will be controlled to form series of 300m-aperture paraboloids in different regions of the 500m-aperture reflector[2].
To acquire the initiative displacement characteristics of the telescope, a cable net structure with about 6670 main cables and 2225 pull-down cables is used as the main supporting structure to support its reflecting panels. Actuators are used to pull the cable net nodes by pull-down cables to form a series of dynamic 300m diameter paraboloids to seek and track astronomical radio sources. The cable elements will experience elastic deformation in operation. The expected long-term operation of FAST determines that the cable elements will withstand long-term, reciprocating fatigue loads. The fatigue stress range for the cable-net structure is about 500MPa which is more than twice as defined by related national standard[3]. Therefore, for the large-span, high-precision cable net structure, long-term monitoring and assessment of cable tension must be implemented for necessary and timely maintenance. Cable tension monitoring is of great significance in evaluating the condition of the supporting structure FAST reflector.
Several types of methods for cable tension measurement have been investigated, which include magneto elastic, anchor cable, fiber Bragg grating, smart cable, frequency method, resistance strain gauge, three point loading flexure, vibrating wire strain gauge method and Fiber grating strain gauge method and so on. The FAST cable-net will experience high stress amplitude tension and must meet 30 years life; two kinds of sensors are not suitable for the cable tension monitoring requirements of FAST, which are series cable sensors and methods for applying additional stress to the cable. By principle analysis and feasibility screening, magnetic flux method, vibrating wire strain gauge method and FBG strain gauge method have been checked for FAST cable tension monitoring. In addition to the general principles and performance requirements, FAST have special requirements for EMI of electronic equipments, which must meet the standards of the ITU RA769[4], whose EMI requirements are more stringent than GJB151A[5]. Therefore, the three cable tension measurement methods should be analyzed from the perspective of EMI.
With the background of cable tension monitoring of FAST, the paper aims to select the most appropriate cable tension monitoring sensor, which will be evaluated in the view of EMI. Firstly, the three sensors are theoretically screened by analyzing the fundamentals to decide if further analysis is necessary. Secondly, digital oscilloscope is used to collect excitation pulse and return signal of sensors. After analyzing sensor signals in the time and frequency domains, the characteristic in the frequency domain can be found. Then, the sensors are tested in the anechoic chamber for comparison. Finally, after summarizing all the analysis and testing, the three sensors are evaluated if they meet the requirement of FAST cable tension monitoring from the perspective of EMI.
1 Principle
The basis of magnetic flux sensor[6](Fig.1) is the magneto-elastic effect of ferromagnetic material. The internal magnetization (magnetic permeability) of ferromagnetic material varies with the external mechanical load exerted. By this principle, when correctly calibrated, the internal force of a structure can be deduced from the magnetic permeability of the component made of ferromagnetic material. The magnetic elastic instrument is used to provide excitation voltage to magnetic flux sensor and collect feedback signals.
The basic principle of vibrating wire strain gauge (Fig.2) is that strain of surface changes correspondingly with the internal stress of the target structure.
Furthermore, strain gauge can be used to measure the deformation of the target structure. The deformation is assumed to be the same with the change of the distance between the front and rear block of the strain gauge. The distance between the front and rear block of the strain gauge and the internal stress of the vibrating wire can be calculated from the natural frequency of the vibrating wire, which can be measured by the excited signal of the electromagnetic coil. The feedback signals from wire strain gauge can be collected by data acquisition box, which has another function of transmitting pulse signals to wire strain gauge.

Fig.1 Magnetic flux sensor

Fig.2 vibrating wire strain gauge
As a type of fiber optic sensors, fiber grating sensor is a wavelength modulation type optical fiber sensor. The external physical loads modulate the wavelength of the fiber Bragg sensor[7]. The measured wavelength is used to obtain the interested load information.
Theoretically, Fiber Bragg Grating strain gauge does not lead to EMI. Further analysis is necessary for vibrating wire strain gauge and magnetic flux sensor. The main technical parameters of vibrating wire strain gauge and magnetic flux sensor are listed in Table 1.
2 Signal acquisition and analysis
To find out the EMI level of vibrating wire strain gauges and magnetic flux sensors from the perspective of interference sources, typical time domain excitation pulse and return signal are collected during normal operation of these two types of sensors. Frequency spectrum of these signals is then acquired using the Fast Fourier Transformation (FFT) analysis[8].

Table 1 Main technical parameters of vibrating wire strain gauge and magnetic flux sensor
Any periodic signal or a finite length signal y(t) in the time domain can be represented by series of cosine functions.
(1)
where fkis componential frequency k, A(fk) is the amplitude of the componential frequency k, φ(fk) is the phase of the componential frequency k. Variation curve of A(fk) along with fkis the amplitude spectrum of y(t).
The basic process of calculating the amplitude spectrum of y(t) based on FFT is as follows[9]:
1) The time-domain signal of y(t) is sampled with interval to beN-point discrete signal y(n) suitable for further analysis.
2) Discrete FFT algorithm is used to speed up the calculation.
(2)
3) The amplitude and phase of frequency fkcan be calculated as

k≥1
where Re(Y(k)) is the real part of Y(k), Im(Y(k)) is the imaginary part of Y(k).
The interference from the excitation pulse and return signal of the sensor in corresponding frequency band can be estimated following the above steps.
For vibrating the wire strain gauge, typical excitation pulse and return signal are shown in Figs3 and 4.

Fig.3 Excitation pulse of vibrating wire strain gauge

Fig.4 Return signal of vibrating wire strain gauge
For magnetic flux sensors, typical excitation pulse and return signals are shown in Figs5 and 6.
From the analysis of signals for the vibrating wire strain gauge and magnetic flux sensor, the amplitude and phase information for these two sensors are shown in Table 2.

Fig.5 Excitation pulse of magnetic flux sensor
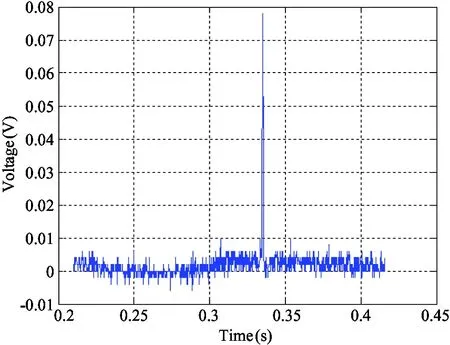
Fig.6 Return signal of magnetic flux sensor
Table 2 Amplitude and phase information of vibrating wire strain gauge and magnetic flux sensor

SensortypeMagneticfluxsensorVibratingwirestraingaugeAmplitude12.8V38VPhase0.5s2.5ms
The sampling frequency of time domain signals for vibrating wire strain gauge is 6kHz. For the magnetic flux sensor, the sampling frequency is 10kHz. Using Matlab software to perform FFT for excitation pulses and return signal of these two types of sensors. Corresponding frequency spectrums are acquired, as shown in Figs7~10.
3 EMI level test
For equipments to be used real time in radio telescopes, EMI levels are lower than the restriction of ITU-R RA.769. Currently, it is difficult to find an anechoic chamber suitable for EMI test based on ITU-R

Fig.7 Amplitude-frequency characteristics of excitation pulse for vibrating wire strain gauge

Fig.8 Amplitude-frequency characteristics of return signal for vibrating wire strain gauge

Fig.9 Amplitude-frequency characteristics of excitation pulse for magnetic flux sensor
RA.769 in the world. As estimation, the EMI levels of these two types of sensors in operation are tested in an anechoic chamber according to the test method of GJB151A. The frequency range of 30MHz~5GHz is selected to meet the FAST operating frequency range of 70MHz~3GHz. Typical specifications of selected antennas are shown in Table 3.

Table 3 Typical specifications of EMI test antenna for GJB151A
Fig.11 shows the inside structure and antennas of anechoic chamber. The background noise of the anechoic chamber and test system are firstly tested shown in Fig.12. GJB151A is used to control the electromagnetic emission characteristics of electronic, mechanical and electrical equipment and subsystems for military. Fig.12 also marks the EMI limits of GJB151A between 30MHz and 5GHz. However, the background noise of the anechoic chamber can fully meet the requirement of RE102_3 of GJB151.

Fig.11 Inside structure and antennas of anechoic chamber

Fig.12 Background noise of the anechoic chamber and test system
An ESU40 receiver of which the frequency range is from 20Hz to 40GHz is for measuring and analyzing the electromagnetic interference. Fig.13 shows the equipment and its operator interface.

Fig.13 ESU40 receiver and its operator interface
To reduce the EMI from the magnetic elastic instrument and data acquisition box, which are necessary for the operation of the two types of sensors, a shielded cabinet of class C whose shielding effect can reach 100dB in 30MHz~5GHz band is manufactured according to GGBB1-1999 test standards[10].
Fig.14 shows the result of EMI for vibrating wire strain gauge and data acquisition box. These equipments have obvious noise with nearly 50db between 70MHz and 1GHz. Then put the data acquisition box into the shield cabinets. The power and signal wires of the sensors are connected to the instrument and data acquisition box located in the shielded cabinet through power filters and signal filters which are placed on the outer wall of the shielded cabinet. The EMI result of vibrating wire strain gauge is shown in Fig.15, as compared to the RE102_3 restrictions of GJB151. No EMI levels exceeding the background noise of anechoic chamber have been tested.

Fig.14 EMI test results of vibrating wire strain gauge and data acquisition box

Fig.15 EMI test results of vibrating wire strain gauge when data acquisition box in shielded cabinet
The EMI from the data acquisition box has been effectively shielded by the shielded cabinet. The result is in accordance with the previous analysis that the vibrating wire strain gauge does not produce noise which exceeds the background noise of anechoic between 70MHz and 3GHz.
Fig.16 shows the result of EMI for magnetic flux sensor and magnetic elastic instrument. These two equipments have obvious noise between 70MHz and 1GHz. Then the magnetic elastic instrument is put into the shield cabinets. The power and signal wires of the sensors are connected to the instrument and magnetic elastic instrument located in the shielded cabinet through power filters and signal filters which are placed on the outer wall of the shielded cabinet. The EMI result of the magnetic flux sensor is shown in Fig.13, as compared to the RE102_3 restrictions of GJB151. No EMI levels exceeding the background noise of anechoic chamber have been tested. The EMI from the magnetic elastic instrument has been effectively shielded by the shielded cabinet. The result is in accordance with the previous analysis that the magnetic flux sensor does not produce noise which exceeds the background noise of anechoic between 70MHz and 3GHz.

Fig.16 EMI test results of magnetic flux sensor and magnetic elastic instrument

Fig.17 EMI test results of magnetic flux sensor when magnetic elastic instrument in shielded cabinet
From the results of the EMI test for the two types of sensors, it can be known that in current test conditions the EMI test results are consistent with the results of previous theoretical and numerical analysis of the time domain signals of the two types of sensors. Analytically, the EMI for the two types of sensors is concentrated in low frequency of several kHz, and is considerably low in frequency range of 70MHz~3GHz of FAST. No EMI levels exceeding the background noise of anechoic chamber have been tested.
4 Conclusion
By the principle analysis, time-domain signal analysis and EMI test, the paper evaluates the feasibility of using FBG strain gauge, vibrating wire strain gauge and magnetic flux sensor to monitor the cable tension of FAST reflector from the perspective of EMI. Theoretical analysis results show that Fiber Bragg Grating strain gauge does not lead to EMI. The time domain signal acquisition and analysis of vibrating wire strain gauge and magnetic flux sensor show that EMI of the two types of sensors concentrated in low frequency of several kHz. The EMI to the FAST telescope whose observation frequency range is 70MHz~3GHz will be considerably low. The EMI test results are consistent with the results of previous theoretical and numerical analysis of the time domain signals of the two types of sensors. No EMI levels exceeding the background noise of anechoic chamber have been tested. Based on EMI, in the cases of properly filtered, FBG strain gauge, vibrating wire strain gauge and magnetic flux sensor are all suitable for the monitoring of cable tension of FAST. Under the director of these analyses, these three sensors have been used to the monitoring of cable tension for FAST.
With the astronomical radio telescope developing toward the direction of large-scale, high-precision and
high sensitivity, health monitoring of its main structure is growing. The evaluation of the three types commonly used monitoring sensors in this paper from the perspective of EMI has some referential significance to the selection of monitoring equipment for other radio telescope or large structures.
[1] Nan R D, Ren G X, Zhu W B, et al. Adaptive cable mesh reflector for the FAST.ActaAstronomicaSinica, 2003, 44: 13-18
[2] Qiu Y H. A novel design for giant radio telescopes with an active spherical main reflector.ChineseJournalofAstronomyandAstrophysics, 1998, 22(3): 361-368
[3] Qian H L, Fan F, Shen Z Z, et al. The overall network analysis of the support structure of FAST reflector surface.JournalofHarbinInstituteofTechnology, 2005, 37(6):750-752
[4] RECOMMENDATION ITU-R RA.769-2: Protection criteria used for radio astronomical measurements. ITU-R: ITU-Radio Communications Sector. 2003
[5] GJB151. Military equipment and subsystems electromagnetic emissions and susceptibility requirements. China: The Commission of Science Technology and Industry for National Defense. 1997
[6] Yamada K, Shoji S, Isobe Y. Nondestructive evaluations of iron-based material by magnetic diagnosis tools.InternationalJournalofAppliedElectromagneticsandMechanics, 2000, 11: 27-38
[7] Zhang X S, Du Y L, Ning C X. A new monitoring method of cable tension of cable-stayed bridge—fiber Bragg grating method.JournalofCentralSouthUniversityofTechnology(English Edition). 2005, 12: 261
[8] Zhang X M, Zhao Z H, Meng J, et al. EMI spectrum analysis based on FFT with consideration of measurement bandwidth effect.ProceedingsoftheCSEE, 2010, 30(12): 117 (In Chinese)
[9] Tian W Y, Wu Y C, Li Z M, et al. EMI analysis of PCB excited by external incident wave using a hybrid S-matrix.InternationalJournalofAppliedElectromagneticsandMechanics. 2000, 11: 27-38
[10] GGBB1-1999.Information Device electromagnetic leakage emission limits. China: National Security Bureau Evaluation Center. 1999
Zhu Ming, born in 1985. He is an engineer and a Ph.D student in National Astronomical Observatories, Chinese Academy of Sciences. He received his M.S. degrees from Beijing Jiaotong University in 2008. He also received his B.S. degrees from Shandong Jiaotong University in 2006. His research interests include structure health monitoring and system reliability.
10.3772/j.issn.1006-6748.2016.02.004
①Supported by the National Natural Science Foundation of China (No. 11173035, 11273036, 11303059).
②To whom correspondence should be addressed. E-mail: mzhu@bao.ac.cnReceived on Jan. 20, 2015
 High Technology Letters2016年2期
- High Technology Letters的其它文章
- Buffer allocation method of serial production lines based on improved ant colony optimization algorithm①
- Bionic jumping dynamics of the musculoskeletal leg mechanism for quadruped robots①
- Study on co-simulation model of forging manipulator based on virtual prototyping①
- Removal of jamming using independent component analysis in non-cooperative passive detection system①
- A cooperative user selection scheme based on energy efficiency and interference factor in cooperative communication systems①
- Abnormal activity detection for surveillance video synopsis①