Tesla’s Strategic Analysis in Electric Vehicle Market
Wang+Fei
【Abstract】With the advent of new energy era, automobile industry is undergoing a major change of the power transmission. Electric vehicle (EV) with its green technology overwhelms those gasolines combustion vehicles through emission control. As one category of EV, battery electric vehicle (BEV) access the mass market rapidly with its merit of zero emission and generous grants from government. Tesla Motors (Tesla) is an American automobile company, its primary sales revenue come from selling fully electric powered vehicles. This report aims to give an overall look on Tesla and explore its competitive strategies in response to different environments. Porters five forces analysis tool, SWOT, strategic group mapping and key financial ratios are used in this report.
【Key words】Tesla; Electric Vehicle(EV); Battery Electric Vehicle(BEV); strategic analysis
Note: Electric cars include battery electric, plug-in hybrid electric, and fuel cell vehicles (BEVs, PHEVs, and FCVs). The report is limited to BEVs and PHEVs segments. Any references to EV used in this report shall be denoted to only these two categories.
1. Current Situation
1.1 History
Tesla Motors was incorporated in July 2003 with businesses consisting of design, manufacture and sales. Its products cover electric vehicles, energy storage applications, battery packs and powertrain. Amongst the product lines, Tesla is primarily committed to produce energy efficient electric vehicles with high performance. This report also focuses on the certain segment.
The chart provides a general recognition of Teslas market share in EV industry last year. It took 10% of volume sold ranking after BYD, a Chinese national brand. As the top on the list, BYD enjoyed a 2% more share than Tesla, largely due to its diversified product lines additionally including passenger bus and taxi, more than BEV.
Tesla possesses the vehicles concentrated on BEV for now. From Tesla Roadster, its first all-electric vehicle, was officially revealed in 2006. Next, Model S, a premium sedan, running purely by electricity was introduced in 2012. It was designed to have both speed and range. After was Model X, a crossover, launched in 2015. While earlier in this year, the spotlight was thrown on Model 3. A four- door compact luxury sedan serves as the linchpin of companys plan in push for mass market and sustainable profitability.
Except for EV department, Tesla also developed solar panel and power wall system used for providing a backup electricity supply. Another “big product” is a lithium-ion battery super factory under construction in Nevada.
In view of its vertical integration, Tesla is transforming to an energy company, more than a vehicle manufacturer.
1.2 Strategic Analysis
1.2.1 Mission
Accelerate the worlds transition to sustainable energy.
1.2.2 Plan
Deriving the clear-cut schedule which CEO Elon Musk outlined initially in 2006, it can be seen that Teslas offerings were following his plan accordingly. It has been almost completed until now unless Model 3s mass production and solar powers electric supply.
After decade of the first plan, Elon Musk released his updated strategy, part deux in company website.
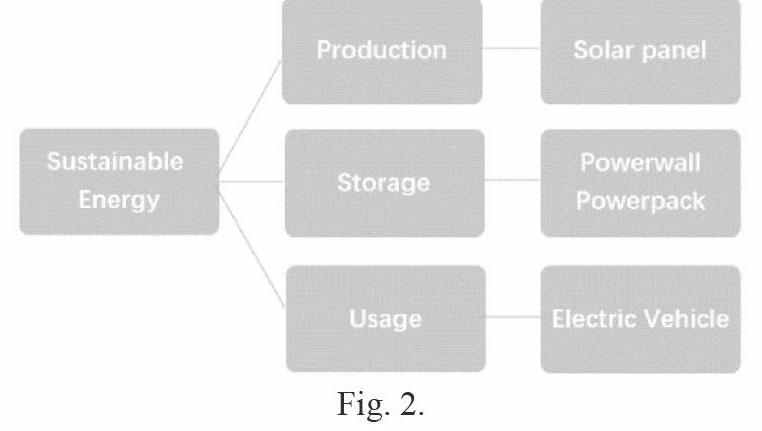
The second plan highlighted integration, subdivision market, autopilot and sharing concept. The picture shows Teslas related diversification strategy. It means that Tesla is zeroing in on its resource structure, transforming to a genuine energy company, rather than a vehicle manufacturer. As a whole, Teslas plan statements in two phases clarified its long- term objectives and complied with its mission as well. If ready, it will greatly reduce the cost of vehicles and it must bring a big impact on entire automobile industry, especially a huge shock on gasoline-powered cars.
2. External Environment
2.1 Socio-cultural environment
2.1.1 Greenhouse gases (GHG) emission issue
The concentration of carbon dioxide (CO2) in the earths atmosphere is directly linked to the average global temperature on earth. From 1880 to 2012, the average global temperature increased by 0.85 °C. As reported, the most abundant GHG is the product of burning fossil fuels. However, over 90% of fuel comes from petroleum based in transportation sector, including gasoline and diesel. That is also the main resource of CO2 emission.
2.1.2 The Paris Agreement
At the Paris climate conference (COP21) in December 2015, 195 countries adopted the first-ever universal, legally binding global climate deal. “The Paris Declaration on Electro-Mobility and Climate Change and Call to Action” calls for a joint effort towards sustainable transport electrification. It suggests that at least 20% of all road vehicles are to be electrically powered by 2030, including cars, 2 and 3-wheelers, trucks, buses and others.
Therefore, the strengthening CO2 regulation became a key driver of EV markets boost.
2.2 Industry environment
2.2.1 Rivalry among competing sellers
Yole Développements report describes a different level of electrified vehicles to suffice the CO2 reduction target with car example accordingly.
Categories on Table 2 point out different types in EV market for meeting various customers demand. Meanwhile, they are also composed the intense competitive environment.
Especially in automobile industries, huge fixed cost is invested at the very beginning of producing. Only by the means of maximizing the yield, can the cost be offset. Therefore, the output is rising along with the price going down, thus caused more contest between rivalry.
Due to the differentiated features, BEV and PHEV constitute the mainsprings of EV development with respective market occupied.
Based on the sales ranking in 1Q this year, I plot a strategic group mapping on the two variable of rough price and ranges only under the electric model. In this way we can classify the cluster of industry rivals and recognize the competitive positions that rival products occupied in EV market.
Note: 1. Data source from EV volume.com. 2.Rough price of Chinese brand vehicles was convert from RMB at exchange rate of 6.63 to dollars of the day after deducting the average government subsidies. 3.Circles are drawn roughly proportional to the sizes of vehicle volumes, based on the global sales in 1Q16.
The group map can be roughly divided into three parts.
a. Additional range — Mitsubishi Outlander, BYD Tang, BMW i3
Given the confined rule on vertical axis, PHEV has lower position on the map. If the hybrid part is added, plus its moderate price tag, PHEV has its indeed innate advantages. Different from Teslas products, PHEV shares the superiorities both of the EV and internal combustion engine (ICE) vehicles. From the perspective of customers, it effectively relives the range anxiety, at the same time, reduces both price and pollution. Mitsubishi Outlander and BYD Tang occupied this certain position of map with very similar tactics. Not bad range with hybrid assist and acceptable price compose their determinant of competitive strength.
Another burgeoning segment need to mention that is extender electric vehicle (EREV). Like BMW i3 extender version. It includes an auxiliary power unit (APU) known as a range extender based on BEV. The range extender drives an electric generator for charging batteries when they are out of power. Same as PHEV, both of them conceive to deal with the range limit by virtue of hybrid method for the purpose of the optimized efficiency. Unfortunately, BMW i3 did not have a satisfied score in 1Q. Probably because of relatively less adopters for the niche market.
Since Tesla concentrates its attention only on 100% electric vehicle. It must be at the expense of losing the profit of the hybrid market. But as far as its financial issue, giving up the certain segment inversely can be conductive to resource concentration, sensitive to target customers. Moreover, it will save the maintain cost and receive more subsidies from government as its completely electric powered superiority.
b. High cost performance— Nissan Leaf, BAIC, JAC
Under the BEV segment, Model S had 3.7 thousand units less than Nissan Leaf ranking number two. From the group map, it can be identified that they are distant rivals. Nissan, BAI and JAC are in the immediately adjacent groups with similar competitive approaches.
When it comes to value for the money, Nissan Leaf is overwhelming strong on its reasonable price. It provides 84 to 107 miles of range versions with quite affordable price over 20,000 dollars after the federal tax credit. Functions of vehicle enough suffice a group of people with simple purpose of commuting on a short distance. So far, the best cost strategy made Nissan Leaf occupy the biggest share in the market.
At the same time, Chinese BAIC EV and JAC J3 EV climbed into the top 10, showing that Chinese EV buyers upgrade from mini-EV into sub-compact. From the group map, BYD e6, a crossover or MPV, had its own middle position, with about one third amount of Model S sold. However, its low ranking did not affect BYDs global strategy and its leading status in worldwide EV market. If Chinese engine technology of internal combustion may fall behind the global rivals, but for the field of EV, enjoys a nearly level. Based on this, Tesla should not take lightly the threats from Chinese automotive enterprises. With government backing, they have potent price strength. And apparently, Tesla has no advantages if competitors engage in protracted price wars. Raising output as soon as possible is vital for Tesla at present.
c. Differentiation— Tesla
Model Ss market share benefits from its first mover strategy and differentiation advantage. Actually, BEV market doesnt count as blue ocean. General Motors (GM) EV1 was the most advanced electric car in the world when it launched in 1996, but the program ends up with the restraint of battery application and weak awareness of environment issue. Two decades later, Tesla seized the opportunity at best timing, capitalizing on the government support along with the cutting edge technology. Model S combined the sport car with electric powertrain, exhibiting its remarkable differentiation of competitive edge.
Under certain conditions, being first to initiate a strategic move can have a high payoff in the form of a competitive strength. Whereas the unique foothold cannot last forever, Internal Revenue Service (IRS) stated:
The total amount of the credit allowed for a vehicle is limited to $7,500. The credit begins to phase out for a manufacturers vehicles when at least 200,000 qualifying vehicles have been sold for use in the United States (determined on a cumulative basis for sales after December 31, 2009).
It means that Tesla will very likely loss a part of potential consumer after out of the tax credit. Moreover, it has to defense the fast followers more attractive next-version products, along with the cost pressure from rivals. Considering the threats thereafter, Tesla launched Model 3 to exploit mass market and broaden its product line with addition of heavy-duty trucks and high passenger-density urban transport.
2.2.2. Potential new entrants
The fact is that EV market has specific difficulties to overcome. Additionally, automobile industry enjoys high entry barriers for new entrants. But investment is always guided by economic laws with the aim at seeking profit. Thus many carmakers, entrepreneurs or even IT giants are appealed by this terrain. likewise, more competitors enter.
a. Apple— Titan project
Although Apple is keeping a lid on leaks, there have been many versions of rumor about Apples electric car initiative back to last year. The car project is codenamed Titan, assumed tipping for either a 2019 or 2020 launch. The expense is a barrier to entry to many potential competitors, but would be less of a hurdle for Apple, which reported holding $178 billion in cash as of December in 2014.
b. Google— Self- driving car project
Unlike Apple, everyone can even download the monthly report of Google self-driving car project. In 2009, Google started its self-driving car project, including team members who had already dedicated years to the technology. the Wall Street Journal reported that Google aimed to forge a partnership with auto makers to build a self- driving car within recent years.
No matter whether auto makers will be hit by those technology companies, Industry 4.0 is coming, vehicles revolution is on the way. The competitive threats from new entrants like Apple and Google are their key technologies on vehicles in the future. Googles sensor and positioning system make vehicle connection and autopilot be possible. While Apples solid financial ground suffices to poach talent resource from traditional car makers. Apparently, the threat of entry is quite strong because of their resources and capabilities well suited for competing in the automobile industry. It demands not only Tesla but also all auto manufacturers launch defensive maneuvers to maintain their foothold in marketplace.
2.2.3 Firms offering substitute products
The worldwide automotive market is highly competitive, especially for alternative fuel vehicles. All of incumbent car makers suffer threats from substitute product with their new technology or new alternative fuel. Another category of new energy vehicle we did not discuss in EV category is fuel cell vehicle (FCV), since it remains in an early stage of development. FCV is powered by hydrogen, emitting water vapor and warm air instead of harmful exhaust. Different from BEV, no need to plug in FCV. Because its fuel cells are recharged by refilling with hydrogen, which can take as little as 5 minutes at a filling station. But for now, few models are available for sale or lease. Owing to the limit availability and hydrogen infrastructure problem, the competitive pressure from FCV is weakened as a substitute product. But when the technology matures, it will be a competitive alternative for consumers.
2.2.4 Suppliers
To realize the integration backward strategy, Tesla is accelerating to build its supper battery factory, and making Panasonic convert from the role of a supplier to a partner.
Facilitating the coordination of battery flows for the sake that battery supply is a major cost component with outsized profit margins. Doing things in-house brings the maximized efficiency, declines high cost of transportation and storage after under the same ceiling.
In fact, vertical integration has no real payoff strategy wise unless it produces cost saving sufficient to justify the extra investment. Considering the total capital expenditures associated with the Gigafactory through 2020 are expected to be $4 to $5 billion, whether integration backward is a favorable option totally depends on its additional benefits afterwards.
2.2.5 Buyers
Similar to Apple, Tesla sells vehicles directly to consumers through an international network of company owned stores. Bypassing the franchised distribution channels produces cost advantage over traditional rivals. While from customers stand, integration forward lower price to end users after cutting distributors from value chain. Whats more, it makes purchasing easier. Consumers dont need worry about the different promotions, insurance packs, or service between different 4S dealers, the full stuck mode makes trade more transparent. Due to the unified price in the world, it staves off the bargaining pressure from the buyers.
3. Internal Environment
3.1 Strengths
a. Innovative powertrain system
b. Strong brand image on innovation, technology and sustainable energy
c. Value chain integration: company owned stores and Gigafactory.
Technology is the core competency for Tesla in comparison with the conventional auto manufacturers.
In addition, vertical integration is conductive to produce coordination effect with extra value.
3.2 Weaknesses
a. Concentrated in full electric vehicles segment
b. High price
c. Delivery delay
Delivery failure expose the limited production capacity and supply chain problem. Tesla should improve manufacturing efficiency and optimize its supply chain management. In regard to price, costly feature prevents Tesla from the mass market.
3.3 Opportunities
a. Environment awareness increasing and various government incentives
b. Increasing oil and gasoline price
c. Related diversification strategy: Energy storage appliance and SolarCity
Once solar and its storage appliance joint, the value chains of different businesses would bring opportunities for cross-business resource transfer, lower costs, and stronger competitive capabilities.
3.4 Threats
a. Aggressive competition
b. Financial issue
c. Government credit use up
Many established and startups companies enter the alternative fuel vehicle market with deep pockets and new technology. Related diversification brings the coordination value as well as the huge business risk.
3.5 Recommendations
a. Retaining key talents with specialized knowledge to enhance the core competency.
b. Considering alliances or joint ventures with partners in other countries to reduce tax and improve international presence.
c. Maximize the strategic fit in its cross businesses achieving the most value by coordination.
4. Finance
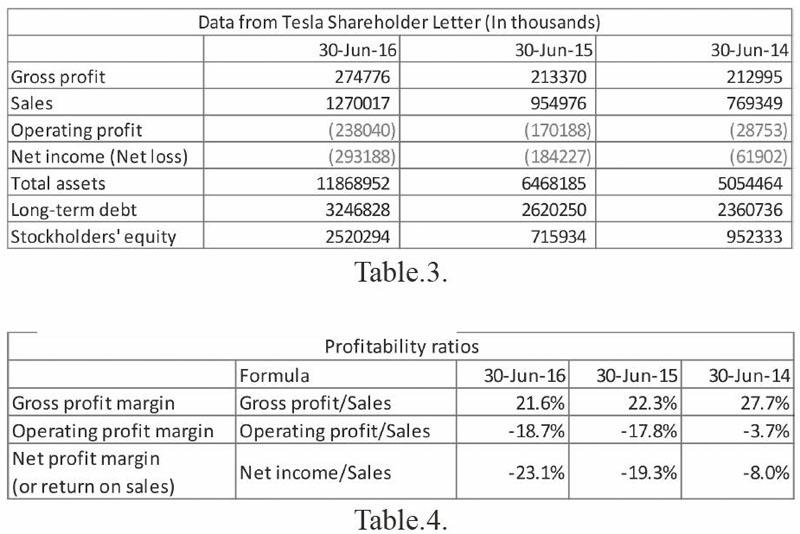
Here list some basic financial ratios calculated through the formulas accordingly. All of original data are extracted from Tesla finance statements in the three consecutive years.
Note: Under GAAP accounting
Note: To simplify, lease accounting for vehicles is not counted in this report. Ending assets or inventory are denoted as the denominator.
On a year-over-year (YoY) basis, Teslas automotive revenues rose by 33% to around 1.27 billion dollars in 2Q this year, more than 1.5 times that of 2014. The jump of revenue partially attributed to the launch of all-wheel drive Model S 85D and 70D earlier in 2015. Operating profit margin gives an idea that the amount of money Tesla made on each dollar of sales. Its downswing related on reducing value for shareholders by operating cash flow. Net margin is also known as the return on sales (ROS) provides a more accurate view of Teslas alarming situation on profitability. In fact, Teslas bullish revenue portrays the favorable market condition, otherwise, the unpromising profit margins disclosures the disjoint of market and profit, which is mainly affected by gross margin and expense ratio.

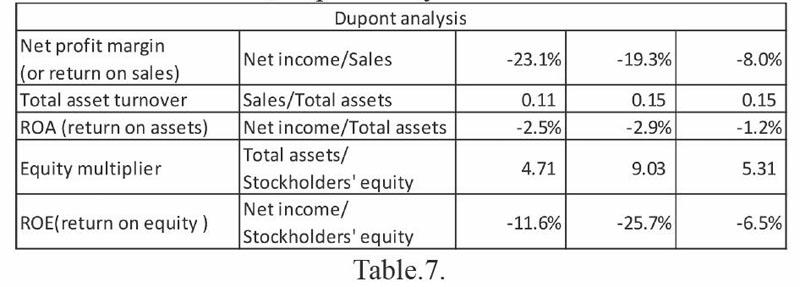
The setback on assets turnover in this past year hints management inefficiency on assets exertion for revenue. Therefore, Tesla should focus more attention on the effective deployment for assets. Besides, two items were put weight in the assets structure. One is lease vehicle operating soaring by 126.2% YoY. The other is property and equipment enjoying a 50% rise. Compared with asset turnover, ROA suggests more about efficiency of earning.
Generally, manufactory industry has the lower ROA in light of their substantial assets demand. But the continuous negative ROA ratio for Tesla is a risky signal.
From Table 6, it appears a slump of long-term debt to total assets stemmed from an increase of denominator. It provides a roughly trend with regard to Teslas financial position.
Equity multiplier measures to assess Teslas finance leverage. The highest result last year indicates the company relies more on debt and other liabilities from financing, probably due to the massive product cost demand. Leverage ratios symbolize the companys financial strategy, which can be a support for the business strategy. To further assess the companys ability on return to shareholders, Dupont analysis is used here.
● ROE= Net income/ Equity = (Net income/ Sales) * (Sales/ Assets) * (Assets/ Equity)
● ROE= ROA* (Assets/ Equity)
ROE is an important matric to evaluate Teslas efficiency at generating profits from every unit of investment. From the decomposed formula above, it discerns that ROA and the equity multiplier generate ROE. Teslas deficit of ROA is magnified by the equity multiplier. Negative number reveals insufficient net income on return of the risk shareholders taken. As one consequence, Tesla will raise money by issuing more stock diluting incumbent investors share, and it could shrink equity valuation and wealth will be transferred and reallocated between shareholders.
This report is only a start point. More financial assessment methods can be extended for strategic analysis.
In conclusion, as far as the ratios above, Tesla did not achieve the objective of maximizing the wealth for shareholders. Its lagging indicators mainly arise from the uphill cost demand for scale economy. However, before on track, its performance has already led the serious doubt over whether it can adapt to the larger market in a long term.
References:
[1]http://bigpicture.unfccc.int/#content-the-paris-agreemenhttps://www3.epa.gov/climatechange/ghgemissions/global.html.
[2]http://newsroom.unfccc.int/lpaa/transport/the-paris-declaration-on-electro-mobility-and-climate-change-and-call-to-action/.
[3]http://www.ev-volumes.com/country/total-world-plug-in-vehicle-volumes/.
[4]Arthur A.Thompson,Jr.Crafting and executing strategy.18th 2012.
[5]https://www.irs.gov/businesses/plug-in-electric-vehicle-credit-irc-30-and-irc-30d.
[6]http://www.wsj.com/articles/apples-titan-car-project-to-challenge-tesla-1423868072.
[7]https://www.google.com/selfdrivingcar/how/.
[8]http://blog.ucsusa.org/josh-goldman/comparing-electric-vehicles-hybrid-vs-bev-vs-phev-vs-fcev-411.
Appendix:
Tesla shareholder letters
Q2_2016_Tesla_Shareholder_Letter
http://files.shareholder.com/downloads/ABEA-4CW8X0/2535691705x0x903036/562D56A1-5426-4D79-8B99-3408D1B60226/Q2_16_Update_Letter_-_final.pdf
Q2_2015_Tesla_Shareholder_Letter
http://files.shareholder.com/downloads/ABEA-4CW8X0/0x0x843991/DCDCCFDA-0709-405B-931A-B2F48A224CE8/Tesla_Q2_2015_Shareholder_Letter.pdf
Q2_2014_Tesla_Shareholder_Letter
http://files.shareholder.com/downloads/ABEA-4CW8X0/0x0x772849/0cdad2cf-0497-41a3-ad2a-788f57412777/Tesla_Q2_14_Shareholder_Letter.pdf
Tesla annual report 2015
http://ir.tesla.com/secfiling.cfm?filingid=1564590-16-13195&cik=
作者简介(Author):王菲(Wang Fei),对外经济贸易大学英语学院在职人员高级课程研修班学员(Advanced education program of On-the-job postgraduates, School of International Studies, University of International Business and Economics.)。

