Numerical simulation of flow and bed morphology in the case of dam break floods with vegetation effect*
Ming-liang ZHANG (张明亮), Yuan-yuan XU (许媛媛), Yang QIAO (乔洋), Heng-zhi JIANG (姜恒志), Zhong-zhe ZHANG (张钟哲), Guo-sheng ZHANG (张国胜)
Numerical simulation of flow and bed morphology in the case of dam break floods with vegetation effect*
Ming-liang ZHANG (张明亮)1, Yuan-yuan XU (许媛媛)1, Yang QIAO (乔洋)1, Heng-zhi JIANG (姜恒志)2, Zhong-zhe ZHANG (张钟哲)1, Guo-sheng ZHANG (张国胜)1
1. School of Ocean Science and Environment, Dalian Ocean University, Dalian 116023, China, E-mail: zhmliang_mail@126.com 2. National Marine Environmental Monitoring Center, Dalian 116023, China (Received June 1, 2014, Revised April 12, 2015)
The purpose of this study is to establish a depth-averaged 2-D hydrodynamic and sediment transport model for the dam- break flows with vegetation effect. The generalized shallow water equations are solved using an explicit finite volume method with unstructured quadtree rectangular grid, and in the hydrodynamic model, a Harten-Lax-Van Leer (HLL) approximate Riemann solver is used to calculate the intercell flux for capturing thetomoving boundary. The sediment transport and bed variation equations in a coupled fashion are calculated by including the bed variation and the variable flow density in the flow continuity and momentum equations. The drag force of vegetation is modeled as the sink terms in the momentum equations. The developed model is tested against lab experiments of the dam-break flows over a fix bed and a movable bed in vegetated and non-vegetated channels. The results are compared with experimental data, and good agreement is obtained. It is shown that the reduced velocity under vegetated conditions leads to a decrease of the peak discharge and a rise of the water level of rivers and also an enhancement of the sediment deposition.
finite volume method, Harten-Lax-Van Leer (HLL) approximate Riemann solver, sediment transport, vegetation effect
Introduction
Vegetations, such as grasses, shrubs and mangro- ves, frequently grow in watercourses, floodplains and places near coastal waters. Vegetations can help to re- gulate the water levels, increase the bank stability, re- store or improve the cleanliness of the water, provide important fish and wildlife habitats, and support re- creational activities. On the other hand, the vegetatio- ns on the floodplain can maximize the flood risk by minimizing conveyance and increase obstruction to the movement of water in the channel[1]. Due to the fa- vorable impacts on the environment, riparian/littoral vegetation zones or wetlands have been constructed for the purpose of river restoration and ecosystem ma- nagement. Flooding waves frequently occur in areas near rivers, reservoirs and lakes and generate serious damages owing to heavy rain or dam break. Recent years, the effective and efficient numerical models were developed for understanding the flooding wave propagation in urban areas, complex open channels and overland flow systems. In order to solve the 2-D shallow water equations, a recent trend is to use the finite volume method (FVM) due to the simplicity of implementation, combined with the good flexibility for space discretization[2-4]. Because the dam-break flows are usually in mixed flow regimes and with dis- continuities, the often used numerical schemes are the shock-capture schemes, such as total variation dimini- shing (TVD) schemes, Godunov type schemes[3-5]. During such a flooding hazard involving rapid transie- nts, the interaction between the flow and the bed can be significant. It is often necessary to account for the process of morphological changes when simulating such severe dam break flows. In early numerical models for simulating dam break flows over mobile beds, uncoupled solutions were often adopted, without accounting for the effects of the sediment transport and the bed deformation on the movement of the flow. One of the problems in movable-bed modeling is that under the dam-break flow conditions the sediment concentration is so high and the bed varies so rapidly that their effects on the flow cannot be ignored. To predict correctly the consequences of a dam failure in a complex topography, the interaction between the flow and the bed morphology must be considered in modeling, several models for simulating dam break flows over mobile beds based on the coupled solutions were developed[6-9]. The flows through rigid and flexi- ble vegetations are primarily studied in vegetated open channels, for the turbulence structure and the related transport processes in vegetated environments[10,11].
How to estimate and mitigate the risk of the inun- dation in a vegetated area is a crucial question. Al- though increasing efforts have been devoted to inve- stigate the characteristics of the vegetation-flow, our understanding of the underlying flood wave-vegeta- tion-sediment interactions is still very limited. In the present study, a depth-averaged 2-D hydrodynamic and sediment transport model is developed to simulate the flooding waves without and with vegetation based on the finite volume method. The quadtree mesh with the local refinement technique is used for improving the simulation accuracy. The proposed model is used to calculate the dam-break flows over a mobile bed with and without vegetation, and then it is verified against measured data.
1. Numerical model
1.1
The numerical model consists of the 2-D shallow water equations describing the mass, the momentum and the sediment transport. The generalized 2-D sha- llow water equations are as follow
The sediment entrainment and deposition are es- timated as[12]
The bed deformation can be determined by
1.2
The effect of the vegetation on the flow can be simulated by an internal source of the resistant force per unit fluid mass added into the momentum equatio- ns, the drag force exerted on the vegetation per unit volume can be expressed as[11]
2. Numerical discretization and scheme
2.1
The numerical representation of the physical do- main for the 2-D model is obtained by using an unst- ructured mesh, composed of quadtree elements. The multiple-level quadtree mesh with the local refineme- nt can be used in order to improve the simulation ac- curacy[13]. Each element must be considered as an ele- mentary control volume. Eq.(1) can be integrated over the control volumeas
Applying the Gauss theorem to Eq.(7), discretizing Eq.(7) over a time interval by using the explicit sche- me in time, one obtains
For the continuity equation, we have
For the momentum equation, we have
2.2
A detailed description of the HLL scheme inclu- de a complete discussion regarding the Riemann problem and the reasons for a special treatment of the cells located on the wave front or the shore line (wet/ dry boundary)[2,13]. The HLL scheme assumes and defines the flux at an interface as:
where
2.3
3. Numerical model validation
3.1
The CADAM group carried out laboratory dam break experiments using a rectangular upstream rese- rvoir connected to an L-shaped open channel, as ske- tched in Fig.1[14]. The channel bed elevation is 0.33 m above the reservoir bed so that there is a vertical step at the entrance of the channel, and there is no slope in the channel and reservoir. Initially, the total still water depth in the reservoir is 0.53 m, and the water depth in the channel is set to 0.01m (wet-bed). The reservoir and the channel are separated by a gate, which is ope- ned suddenly to produce a dam-break flow. The Ma- nning roughness coefficient of the bottom is set to 0.0095. Figure 2 presents the predicted and measured time series of the water level at different gauging poi- nts for the wet-bed case. In this case, the results at Gauge 1 depict the initial steep fall in the free surface elevation in the header tank from 0 s to 15 s after the initial dam break, followed by a more gradual decrea- se in the free surface elevation from 20 to 40s. The predicted and measured primary step-like variations in the water level at Gauges 2-4 are in a close agreement, indicating that the propagation speeds are properly modeled. The calculated and experimental results are reasonably similar at Gauges 5 and 6, located beyond the elbow. At Gauge 5, the general trend of the water level is captured well and the water level is slightly overestimated after 7 s.
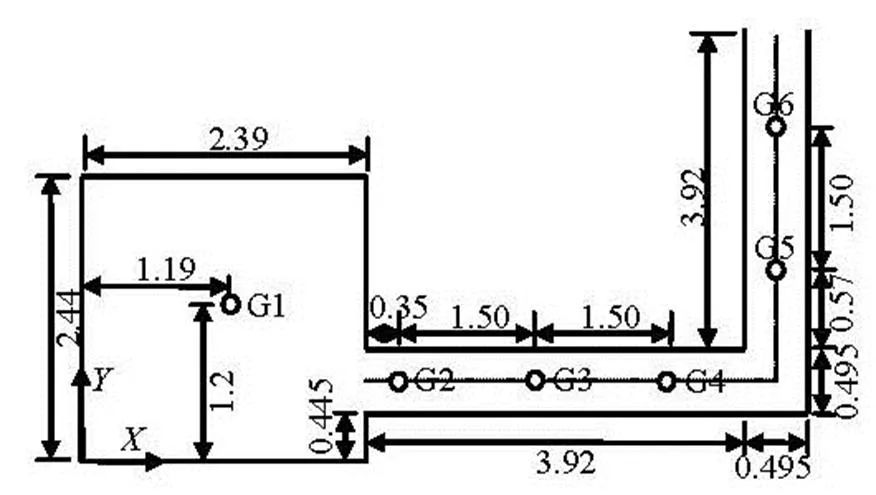
Fig.1 CADAM dam break, laboratory test layout (m)
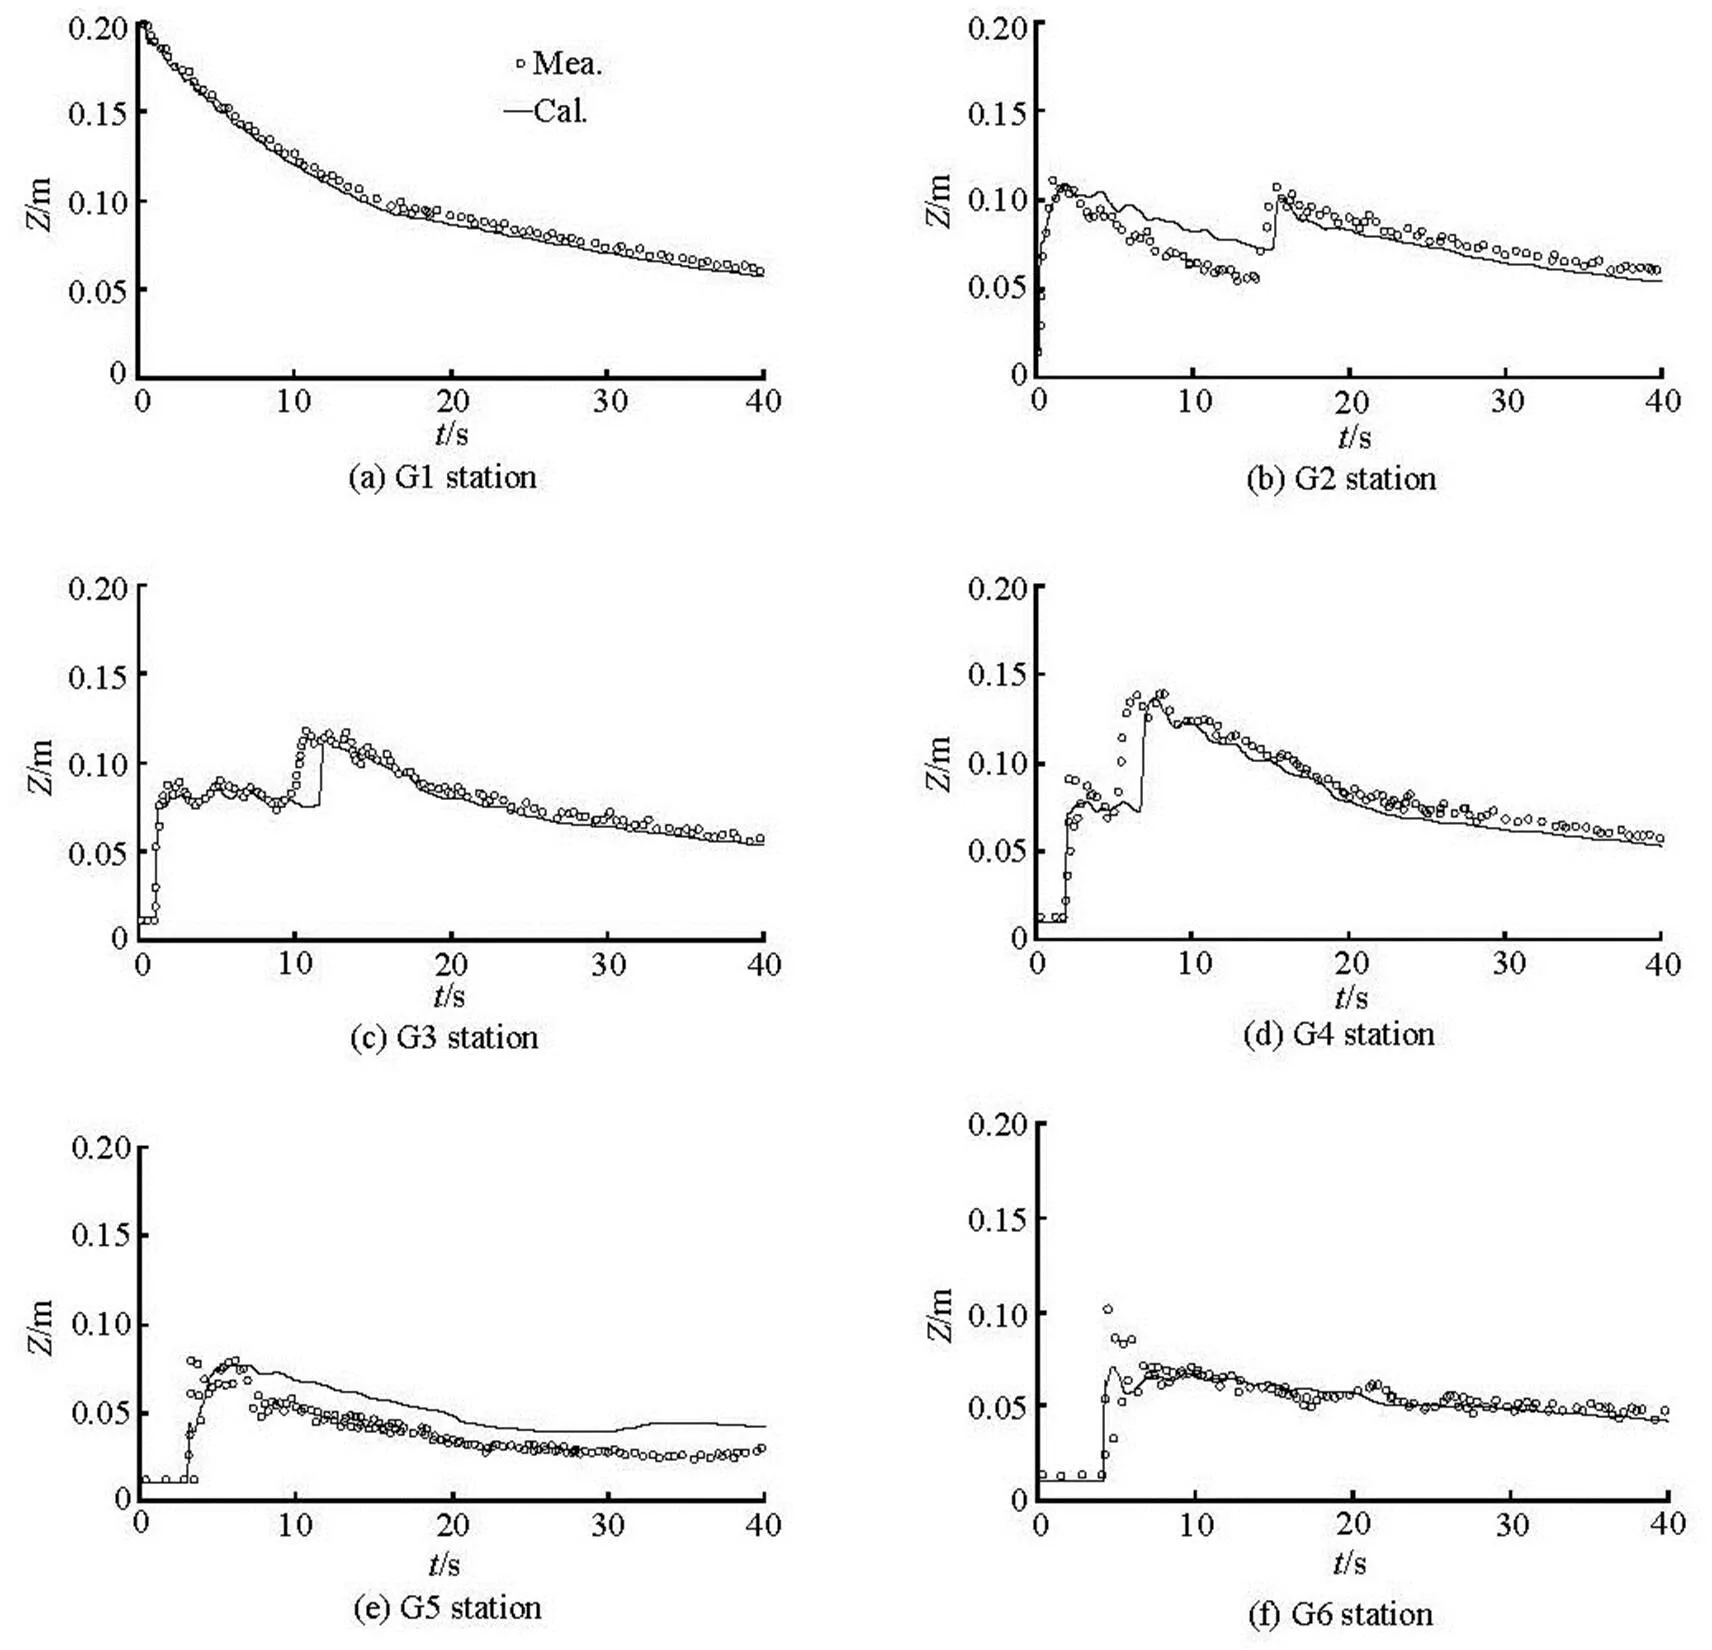
Fig.2 Computed and measured water surface levels at stations
3.2
A case of uniform flow in a flume with vegeta- tion along one side of the bank was described by Nadaoka and Yagi[10]. The flume is 0.4 m wide with a vegetation width of 0.12 m as shown in Fig.3. In this paper, the bed slope is 0.0017 and the Manning rough- ness coefficient is 0.015. Vegetation is simulated by using bamboo stems with a diameter of 0.02 m. The distances between two bamboo stems are 0.028 m and 0.02 m inanddirections. The mean velocity is 0.32 m/s and the flow depth is 0.0457 m. The drag coefficientis set as a bulk constant of 2.49, as re- commended by Nadaoka and Yagi[10]. Figure 4 com- pares the computed depth-averaged velocity distribu- tions with experimental data, and a good agreement is observed. For this case, the computed results show that the existence of vegetation causes the redistribu- tion of the velocity field, the velocity in the vegetated domain is reduced by the presence of vegetation and the velocity in the non-vegetated zone is increased.
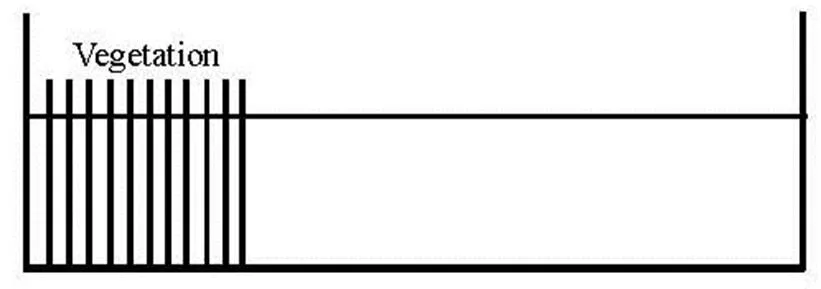
Fig.3 Sketch of vegetative zone in channel
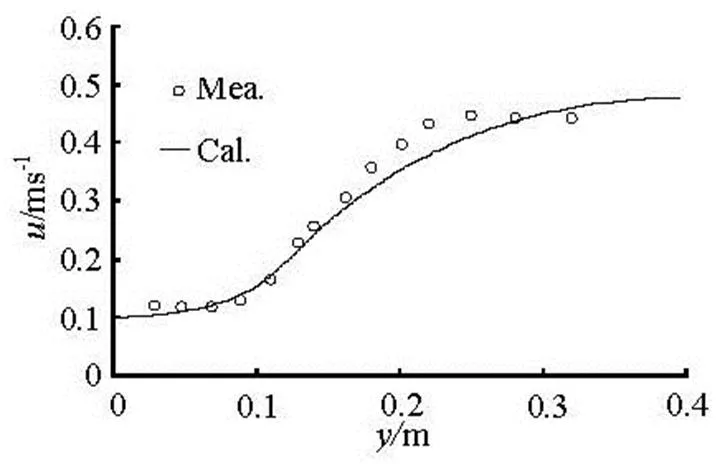
Fig.4 Comparison of calculated and measured depth-averaged velocity
3.3
A case of L-shaped channel is used to investigate the effects of vegetation on the flood inundation level and the discharge. All parameters including the com- putational domain, the mesh element, the Manning roughness coefficient and the time step are the same as the last case with the dam-break flow into an L-shaped channel. The type of trees is wooden sticks, the diameter is 0.010 m, the vegetation height is 0.5 m and the vegetation density is 500 per unit area, and the drag coefficient is 2 in this study. The wooden sticks are arranged at two sides of the channel with a width of 0.08 m as shown in Fig.5. Figure 6 shows the cal- culated time series of the water levels with and without vegetation in stations G1, G3 and G5. The si- mulated water levels with vegetation are significantly higher than those without vegetation at stations G1 and G3. For the nonvegetated case, the water level at station G3 increases suddenly because of a rarefaction wave from the elbow of the L-shaped channel at the downstream. For the vegetated case, theva- riations of the water level at station G3 cannot be found because of the vegetation effect on the dam break wave and its rarefaction wave. The vegetation on the channel floodplain reduces the inundation risk in the downstream areas and increases the flood over- topping by lifting the water level in the upstream areas because of the channel conveyance reduction. Figure 7 shows the calculated time series of the flood discha- rge with and without vegetation along the cross-se- ctions of station G3,stands for the flood discha- rge here. It can be seen that the reduced velocity under the vegetated conditions would be expected to lead to a lengthening of the catchment response time and a consequent decrease of the peak discharge through the cross section, as a result, the flood risk may be maxi- mized in the upstream areas[15].

Fig.5 Laboratory test layout with vegetation arrangement
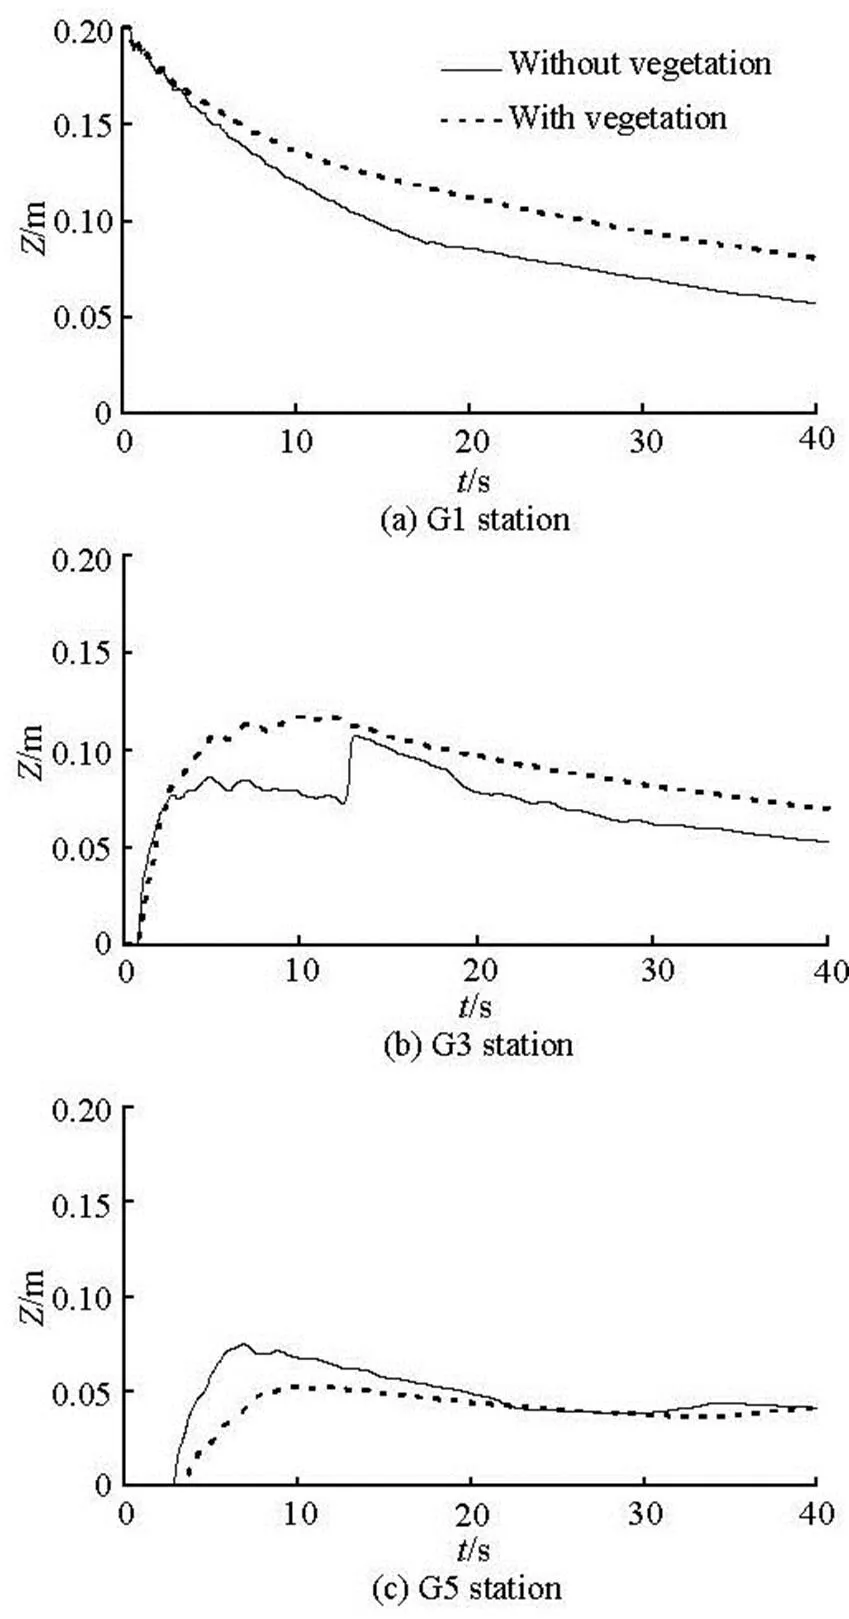
Fig.6 Computed water surface elevations with and without ve- getation
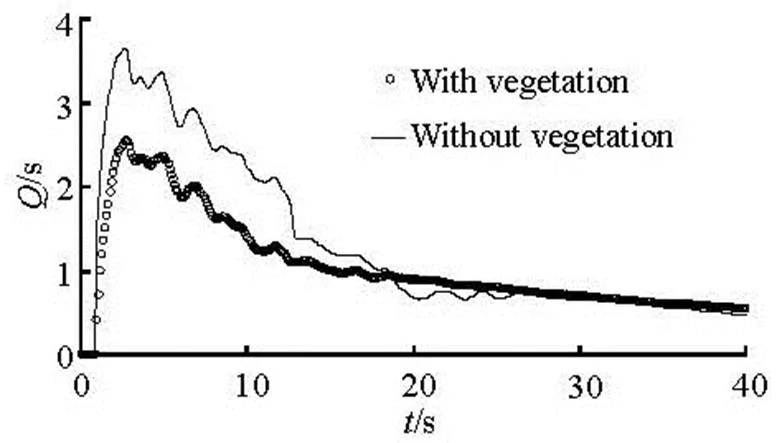
Fig.7 Comparison of computed section discharges with and without vegetation
3.4
An idealized test on the dam-break flow over a mobile bed is numerically investigated, with the expe- riment carried out by Capart and Young in mind[16,17]. The flume is 1.2 m long, 0.2 m wide, and 0.7 m high. It is initially covered by a layer of 0.05 m to 0.06 m thick of light artificial pearls (not natural sand), its diameter is 0.0061 m, the specific gravity is 1.048, and the settling velocity is 0.076 m/s. In this experi- ment, an idealized dam is located in the middle of the flume separating an upstream static flow region of 10 cm deep from a dry downstream part. At, the dam is removed rapidly to create the dam-break flow. The domain is divided into grid cells of 0.0025 m× 0.0025 m, the bed porosity is set to 0.28 and the Manning roughness coefficient is 0.025, the threshold Shields parameter is set to 0.15[12]. The total simula- tion time is 0.6 s.andare equal to 3 and 6 in this study[12]. Figure 8 shows the comparison of the calculated and measured data in various water levels and the bed surface along the channel indirection,stands for elevations water surface and bed, the close agreement can be seen among them. From these figures, the erosion magnitudes and the wavefront lo- cations are well predicted by the present model, a hy- draulic jump is formed near the initial dam site and these discrepancies can be found at the location of the hydraulic jump, These discrepancies are also evident in the results presented by Wu and Li[12,17]. Figure 9 shows the computed longitudinal concentration at the time instant,is the hydrodynamic time scale, the calculated results are close to those simu- lated by Wu and Fraccarollo[16,17].
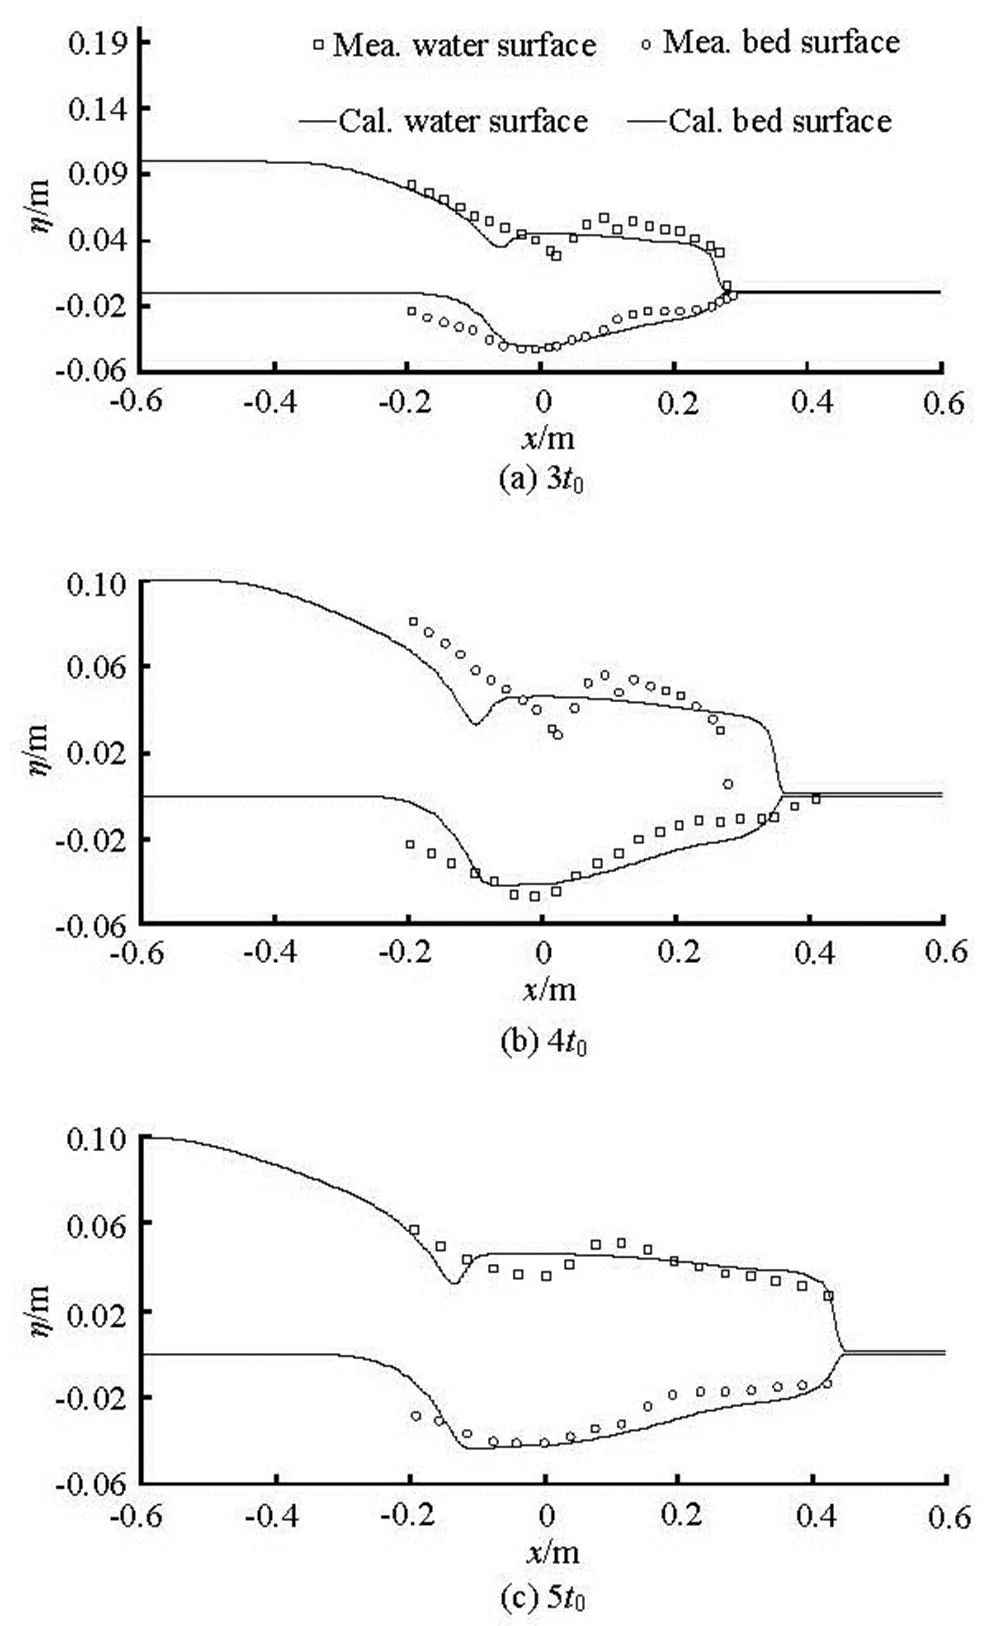
Fig.8 Comparison of computed and measured water surface and bed level
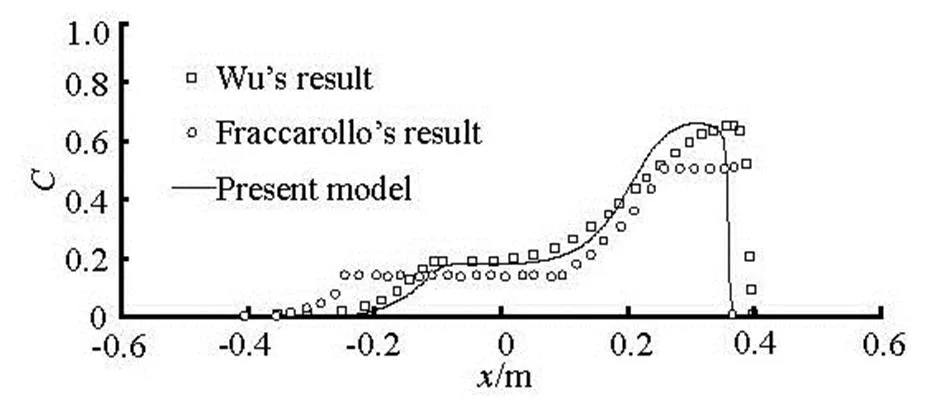
Fig.9 Computed volumetric sediment concentration for the Taipei experiment
3.5
A series of laboratory experiments of dam-break flow over mobile beds were carried out at the Civil Engineering Laboratory of the Université Catholique de Louvain, Belgium[9,18]. The test case considered in this study is conducted in a 6 m long flume with a non-symmetrical sudden enlargement from 0.25 m to 0.50 m width, located 1.0 m downstream of the gate (Fig.10). The initial condition consists of a 0.1 m high horizontal layer of fully saturated sand over the whole flume and an initial layer of 0.25 m clear-water upst- ream of the gate. The sediment used is uniform coarse sand with a median diameter of 0.00182 m and a den- sity of 2 680 kg/m3, its porosity is 0.47. The space stepis 0.025m, andis 0.005m, the local refi- nement is used in the enlargement section. A free out- flow boundary condition is set at the downstream out- let. A Manning roughness coefficient of 0.025 is set according to Refs.[8,17]. The locations of the measu- red nodes are as follows: P1 (3.750 m, 0.125 m), P2 (4.200 m, 0.125 m), P3 (4.450 m, 0.125 m), P4 (4.950 m, 0.125 m), P5 (4.200 m, 0.375 m), and P6 (4.45 m, 0.375 m). The model predictions are compa- red with the experimentally measured water levels at six points and the bed levels at three cross sections. Figure 11 shows the predicted and observed water level time series at the measurement locations. It can be seen that the predicted water level hydrographs agree quite well with the observed data. Figure 12 shows the comparison between the predicted and ob- served bed level profiles at CS1, CS5and CS9. At CS1, the simu- lated maximum depth of scour over-estimates slightly as compared with the measured data. At CS5, the late- ral bed profile is predicted correctly especially for the maximum scouring depth, the evolution of the bed shape general erosion on the left side, and a deposition on the right side are well reproduced at CS9. Because of the rapid flow and the complex process for the mo- bile bed under dam break waves, it is difficult to cap- ture exactly the process of the bed variation. Overally, the same general trend can be found between the cal- culated results and the measured data. From these figures, it may be said that the depth-averaged 2-D model has the capability of predicting hydrodynamic and mobile bed variations for the dam-break flow.
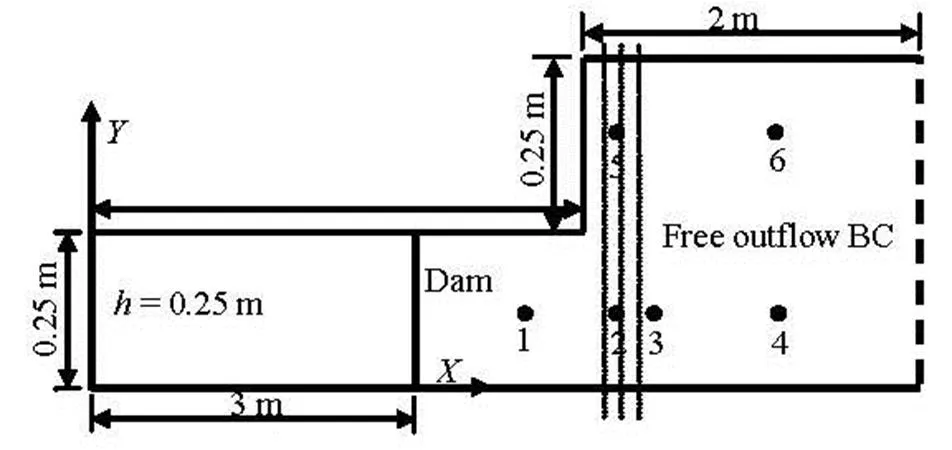
Fig.10 Sketch of a dam-break flow experiment over a mobile bed

Fig.11 Comparison between the observed and calculated water levels
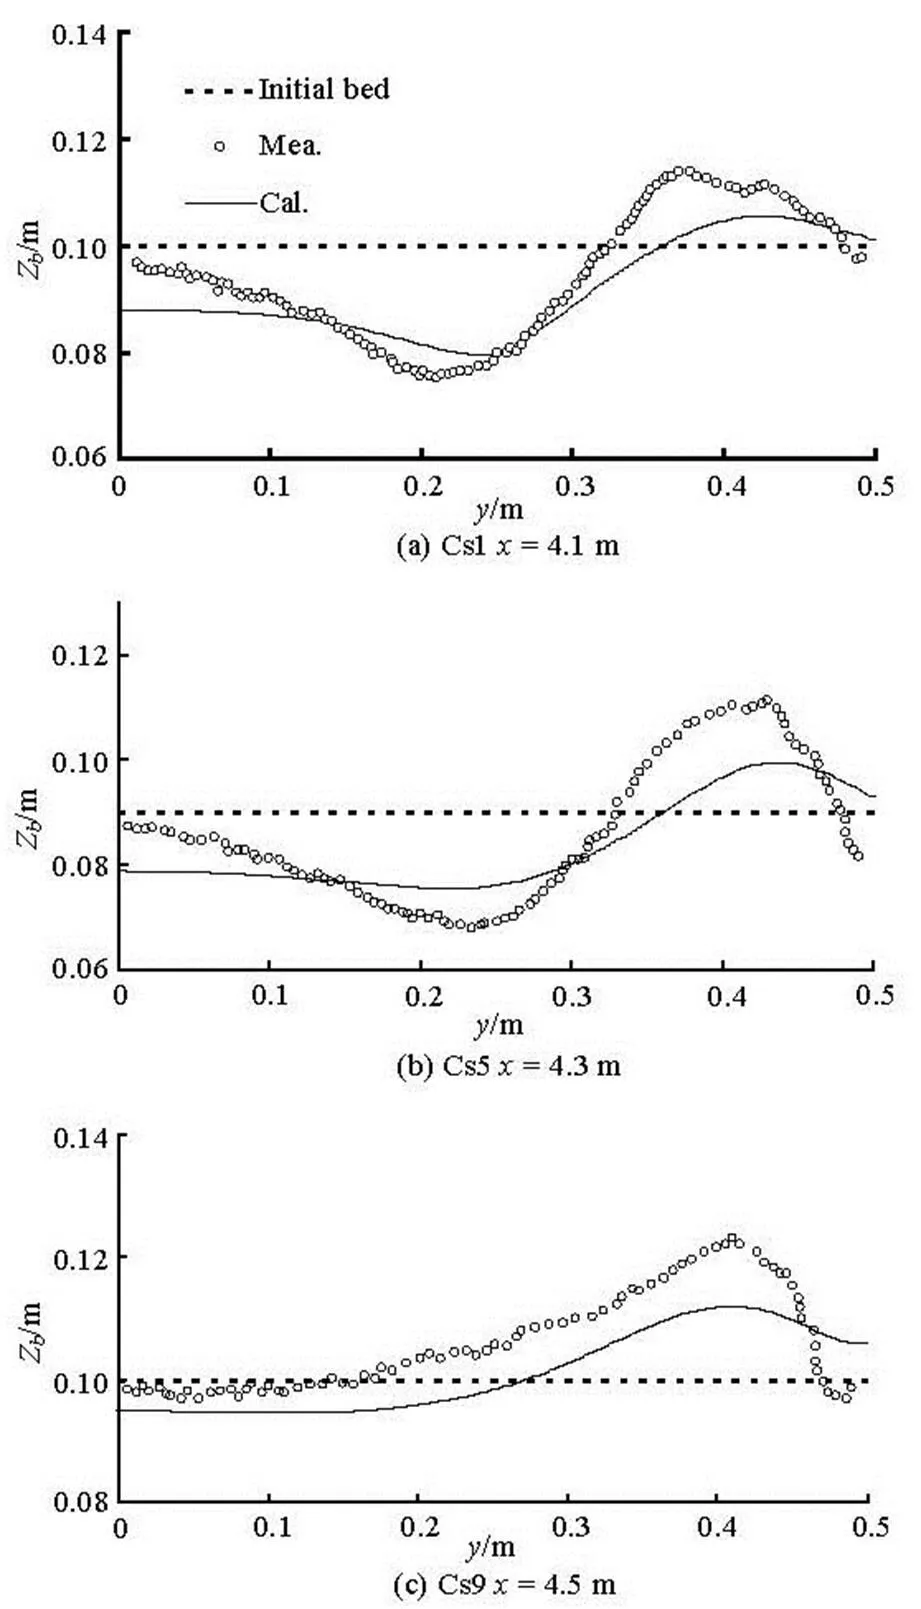
Fig.12 Comparison between the observed and calculated final bed levels for cross-sectional profiles
In order to investigate the effects of the flood- plain vegetation on the flood level and the bed mor- phology during a dam break event, the sudden enlar- gement case in the previous section is re-calculated by adding vegetation in the rectangle zone from4.3 m to 4.7 m and0 m to 0.15 m. The vegetation parameters are: the diameter of trees is 0.010 m, the vegetation height is 0.5 m and the vegetation density is 1 000 per unit area. The drag force coefficientis set to 2.0, the coefficients ofandare equal to 10 and 0.5 in this study[12]. Figure 13 shows the compari- son of the calculated water levels between the cases of with and without vegetation at different stations. From this figure, one can see that the presence of vegetation reduces the conveyance capacity of the river and its floodplain, with a consequent raise of the local flood levels. Figure 14 shows the comparison of calculated final bed levels between the cases of with and without vegetation for cross-sectional profiles. Figure 15 shows the calculated bed variation near the sudden ex- pansion with consideration of vegetated and non-ve- getated resistances. In the case of absence of vegeta- tion, the erosion occurs near the corner of the expan- sion, and the sediment deposits mostly at the expan- sion zone because of the nature of the sudden dam- break flow. By comparison, it can be seen that the flow is diverted away from the vegetation zone toward another side, moreover, the location of erosion and de- position will change as shown in Fig.15. The results of this work suggest that the vegetation generally increa- ses the roughness of the bed surface which directly af- fects the velocity of the flow and the shear stress, and then furthermore enhances the sediment deposition in the vegetation areas, increases the sediment erosion in the non-vegetated areas to keep the sediment conse- rvation.
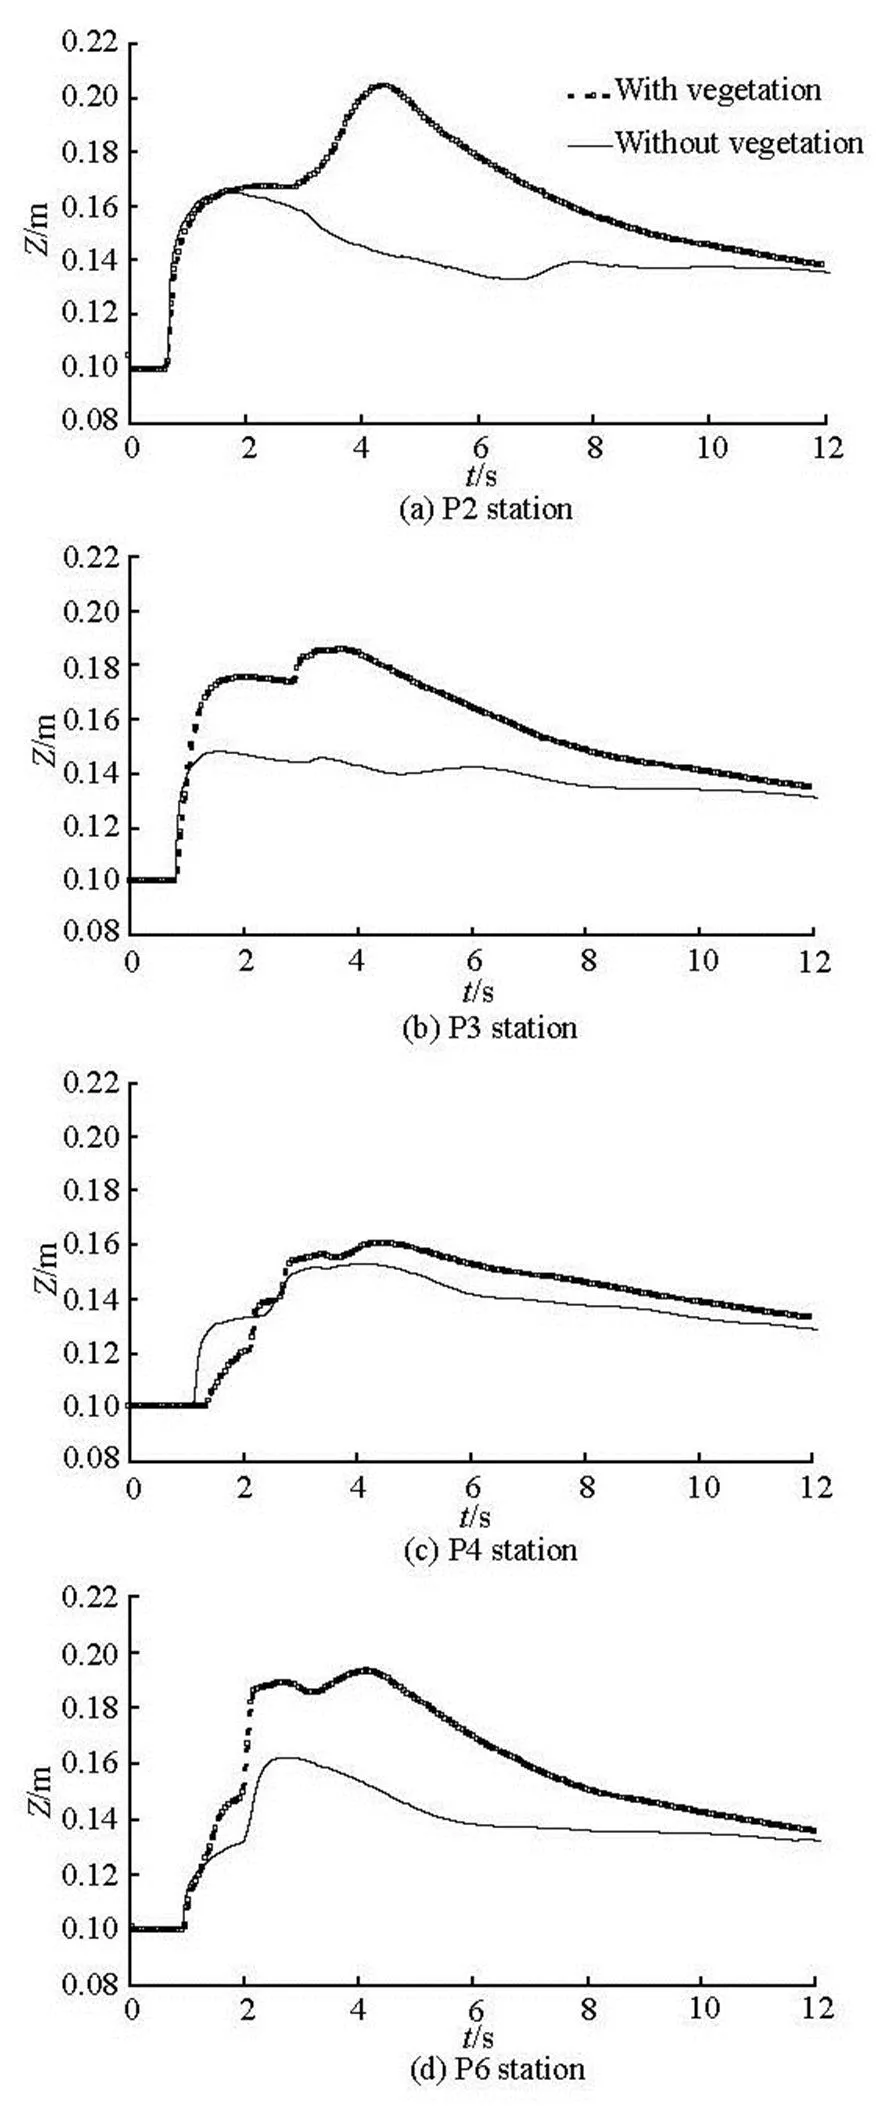
Fig.13 Comparison of calculated water levels between the cases of with and without vegetation
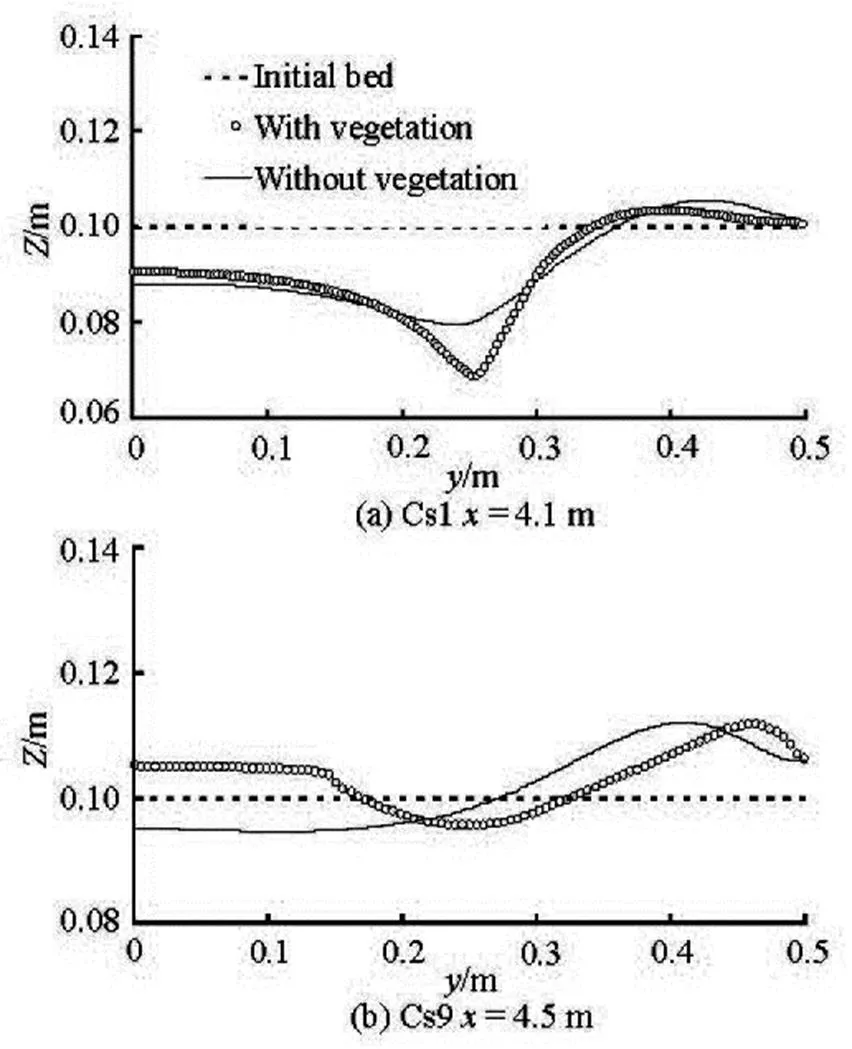
Fig.14 Comparison of calculated final bed levels with and with- out vegetation
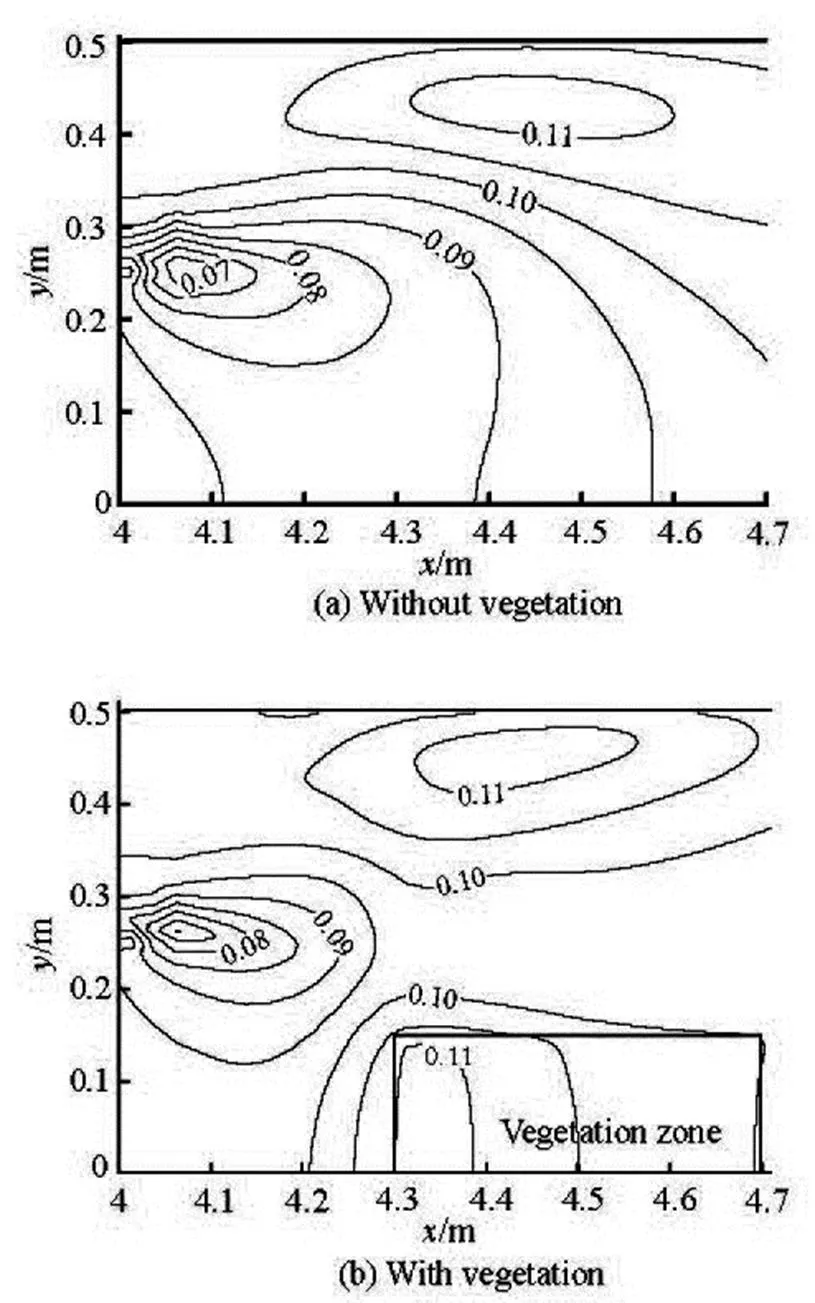
Fig.15 Calculated bed variation and flow pattern near the su- dden expansion with and without vegetation
4. Conclusion
A depth-averaged 2-D model for the dam-break flows with vegetation effect is established to simulate the dam-break wave processes, together with the sedi- ment transport and the bed variation. In the model, the non-staggered grid is adopted, all the primary varia- bles are located at the cell centre, so that the program code is simpler and requires less memory. A quadtree mesh is used to allow the refinement of the grid for important computational domains, such as the dam break location and the enlargement channel. The inter- cell fluxes are evaluated based on the HLL approxi- mate Riemann solver with the shock capture property for capturing accurately the moving waterline. The ef- fects of the pressure and the gravity are included in the source term, which can simplify the computation and eliminate the numerical imbalance between the source and flux terms. The effects of the sediment concentration and the bed variation on the flow are re- presented in the continuity and momentum equations. The calculated results show a good performance of the model in predicting the dam-break flows in fixed and mobile beds with and without vegetation. The prese- nce of vegetation on the floodplain can reduce the flow velocity and the shield stress in the vegetated area for protecting the riverbank and rooting the soil in the bank which in turn raises the water levels with some serious flooding damages. Overally, the riparianvegetation along the main channel sides is both bene- ficial for the riverbank protection and harmful for the flood control, and it is worth to be studied for restori- ng the environment and for the flood risk management. The developed 2-D model in this study can be used to forecast the flooding bed morphology and the flood risk and provide an appropriate guidance for the ma- nagement of the riparian vegetation in flood areas in the future.
References
[1] LEU J. M., CHAN H. C. and JIA Y. et al. Cutting ma- nagement of riparian vegetation by using hydrodynamic model simulations[J]. Advances in Water Resources, 2008, 31(10): 1299-1308.
[2] YING X., JORGESON J. and WANG S. S. Y. Modeling dam-break flows using finite volume method on unstructu- red grid[J]. Engineering Applications of Computational Fluid Mechanics, 2009, 3(2): 184-194.
[3] LIANG Q., MARCHE F. Numerical resolution of well-ba- lanced shallow water equations with complex source terms[J]. Advances in Water Resources, 2009, 32(6): 873-884.
[4] YUAN Bing, SUN Jian and YUAN De-kui et al. Numeri- cal simulation of shallow-water flooding using a two-di- mensional finite volume model[J]. Journal of Hydrody- namics, 2013, 25(4): 520-527.
[5] LAI Wencong, KHAN Abdul A. Time stepping in discon- tinuous Galerkin method[J]. Journal of Hydrodynamics, 2013, 25(3): 321-329.
[6] CAO Z., PENDER G. and WALLIS S. et al. Computatio- nal dam-break hydraulics over mobile sediment bed[J]. Journal of Hydraulic Engineering, ASCE, 2004, 130(7): 689-703.
[7] BENKHALDOUN F., SARI S. and SEAID M. A flux- limiter method for dam-break flows over erodible sedime- nt beds[J]. Applied Mathematical Modelling, 2012, 36(36): 4847-4861.
[8] XIA J., LIN B. and FALCONER R. A. et al. Modelling dam-break flows over mobile beds using a 2D coupled approach[J]. Advances in Water Resources, 2010, 33(2): 171-183.
[9] SOARES-FRAZÃO S., ZECH Y. HLLC scheme with novel wave-speed estimators appropriate for two-dimen- sional shallow-water flow on erodible bed[J]. Internatio- nal Journal for Numerical Methods in Fluids, 2011, 66(8): 1019-1036.
[10] NADAOKA K., YAGI H. Shallow-water turbulence mo- delling and horizontal large-eddy computation of river flow[J]. Journal of Hydraulic Engineering, ASCE, 1996, 124(5): 493-500.
[11] ZHANG M., LI C. W. and SHEN Y. Depth-averaged mo- deling of free surface flows in open channels with eme- rged and submerged vegetation[J]. Applied Mathemati- cal Modelling, 2013, 37(1-2): 540-553.
[12] LI W., VRIEND H. J. D. and WANG Z. B. et al. Morpho- logical modeling using a fully coupled, total variation di- minishing upwind-biased centered scheme[J]. Water Re- sources Research, 2013, 49(6): 1-19.
[13] ZHANG Ming-liang, WU Wei-ming and LIN Li-hua et al. Coupling of wave and current numerical model with un- structured quadtree grid for nearshore coastal waters[J]. Science China Technological Sciences, 2012, 55(2): 568- 580.
[14] SOARES-FRAZÃO S., ZECH Y. Dam break in channels withbend[J]. Journal of Hydraulic Engineering, ASCE, 2002, 128(11): 956-968.
[15] WANG Chao, ZHENG Sha-sha and WANG Pei-fang et al. Interactions between vegetation, water flow and sediment transport: A review[J]. Journal of Hydrodynamics, 2015, 27(1): 24-37.
[16] FRACCAROLLO L., CAPART H. Riemann wave descry- ption of erosional dam-break flows[J] Journal of Fluid Mechanics, 2002, 461: 183-228.
[17] WU W., WANG S. S. Y. One-dimensional modeling of dam break flow over movable beds[J]. Journal of Hy- draulic Engineering, ASCE, 2007, 133(1): 48-58.
[18] ZHANG Ming-liang, XU Yuan-yuan and HAO Zi-ning et al. Integrating 1D and 2D hydrodynamic, sediment tran- sport model for dam-break flow using finite volume me- thod[J]. Science China Physics, Mechanics and Astro- nomy, 2014, 57(4): 774-783.
* Project supported by the Public Science and Technology Research Funds Projects of Ocean (Grant No. 201205023), the Program for Liaoning Province Excellent Talents in University (Grant No. LJQ2013077), the Science and Technology Founda- tion of Dalian City (Grant No. 2013J21DW009) and the Natu- ral Science Foundation of Liaoning Province (Grant No. 2014020148).
Biography: Ming-liang ZHANG (1976-), Male, Ph. D., Associate Professor
10.1016/S1001-6058(16)60604-2 2016,28(1):23-32
- 水动力学研究与进展 B辑的其它文章
- Ski-jump trajectory based on take-off velocity*
- Formation of air-entraining vortices at horizontal intakes without approach flow induced circulation*
- Numerical study of the flow in the Yellow River with non-monotonous banks*
- Numerical and experimental studies of hydraulic noise induced by surface dipole sources in a centrifugal pump*
- Pelton turbine: Identifying the optimum number of buckets using CFD*
- Mass transport in a thin layer of power-law fluid in an Eulerian coordinate system*

