Pelton turbine: Identifying the optimum number of buckets using CFD*
Audrius ŽIDONIS, George A. AGGIDIS
Pelton turbine: Identifying the optimum number of buckets using CFD*
Audrius ŽIDONIS, George A. AGGIDIS
Lancaster University Renewable Energy Group and Fluid Machinery Group, Engineering Department, Lancaster University, Lancaster UK, E-mail: a.zidonis@lancaster.ac.uk (Received April 13, 2014, Revised July 1, 2015)
A numerical case study on identifying the optimum number of buckets for a Pelton turbine is presented. Three parameters: number of buckets, bucket radial position and bucket angular position are grouped since they are found to be interrelated. By identi- fying the best combination of the radial and angular position for each number of buckets it is shown that reduction in the number of buckets beyond the limit suggested by the available literature can improve the efficiency and be beneficial with regard to the manufa- cturing complexity and cost perspective. The effect of this reduction in the number of buckets was confirmed experimentally.
hydropower, Pelton impulse turbines, numerical modelling, number of buckets, optimization
Introduction
The design of Pelton turbines has been developed for more than a century[1]since its invention by Lester Pelton in 1880. Available literature usually concentra- tes on the analysis or design optimization of distribu- tor[2], injector[3-5], bucket geometry[6-8]or turbine ca- sing[9]. However, not much work is published in terms of the optimum number of buckets.
Generally there is a tendency of fitting as many buckets on the runner as possible to ensure efficient transition of the jet from one bucket to another with- out wasting the energy of a water jet. However, there are energy losses associated with jet entering the bu- cket and providing some amount of counter-torque (Fig.1) as the outer side of the bucket hits the surface of the jet[10]. Therefore a minimum amount of buckets ensuring that no water particles are lost during the transition from one bucket to another should be identi- fied[10-12].
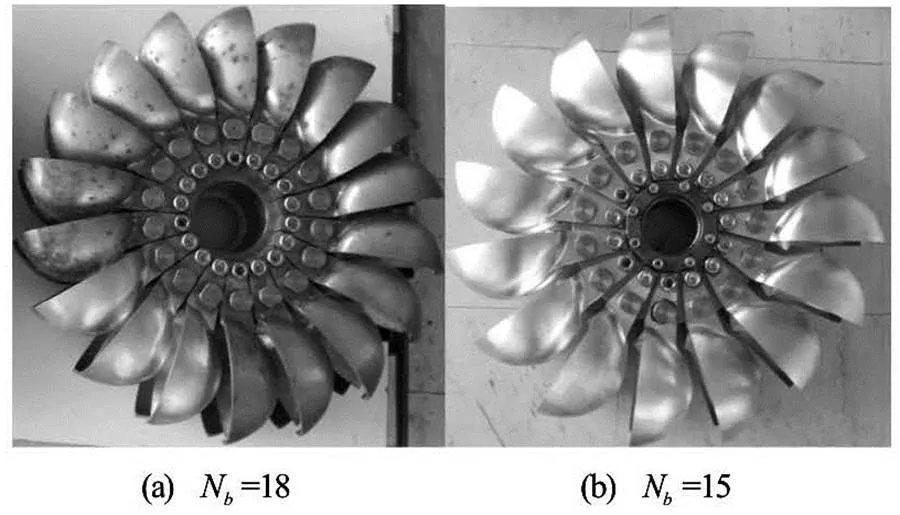
Fig.1 Typical torque curves on a single Pelton bucket
This paper concentrates on further developing a Pelton runner by identifying the optimum number of buckets and their mounting position after the geome- try of the bucket has been modified. A Pelton runner was optimised at Lancaster University by parametrica- lly modifying the shape of the bucket and then adju- sting its mounting position and is presented as Case 2 in Ref.[13]. The study showed that after changes to the bucket geometry are made the runner efficiency might benefit from reassessing the number of buckets. The bucket shape of the modified runner described in Case 2 of Ref.[13] was further improved analytically by modifying the geometry of the cut-out, the splitter tip and the outer side of the bucket regions. To evalua- te the effect of these modifications computational fluid dynamics (CFD) was applied. As the final step it was decided to readjust the positioning and spacing of the bucket. The assumption is made that the three pa- rameters: the number of buckets, the angular position and the radial position are highly interrelated and the- refore should be analysed as a group in order to achie- ve the best result.
1. Background
There are theoretical suggestions on calculating the required number of buckets that are derived by looking at the relative paths of the water particles. In 1957 Nechleba[12]suggested acceptable number of bu- ckets,based on a ratio: jet diameterover runner diameteras shown in Table 1. This sugge- stion gives quite wide ranges of buckets for each ratio oftherefore is not very exact. Since then the in- dustry has developed more exact guidance to calculate the amount of buckets including additional parameters like bucket width to assist engineers. These methods correlate with suggested ranges by Nechleba however, they are not publically available.
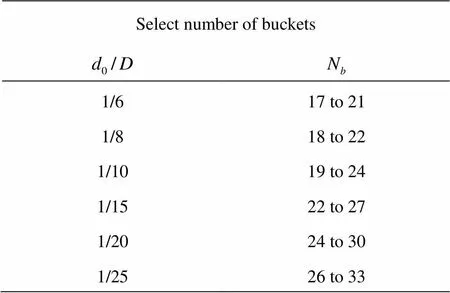
Table 1 Selecting the number of buckets
Eisenring[10]suggests Eq.(1) to calculate the opti- mum number of buckets by relating the length of the pitch circle to the optimum jet diameter.
Moreover, a statement is made that a minimum of at least 16 buckets should be installed. This state- ment does not agree with Nechleba[12]who suggests 17 buckets to be the minimum as presented in Table 1.
Work published by Atthanayake[14]suggests an empirical relationship given in Eq.(2) to select the number of buckets. However, no references are given to the work establishing this empirical relationship.
Nasir[15]has also published a paper that covers the number of buckets in which it is suggested to use Eq.(3) to calculate the optimum number of buckets.
The fact that it is not clearly stated ifis the no- zzle diameter or the jet diameter gives some uncertai- nty to this equation as the jet diameter might be diffe- rent from the nozzle opening diameter. This difference is even more pronounced at the best efficiency point when the flow rate is not at its maximum and where the turbine is usually optimised. It will be therefore assumed that the nozzle diameter is to be used in Eq.(3) since it is a constant value.
The suggestions of all the authors reviewed in this section are taken into account and the suggested number of buckets is calculated according to each su- ggestion using the parameters of the Pelton turbine used in this case. The dimensions of the prototype ru- nner are in accordance with the minimum required va- lues for model size and test parameters (IEC 60193:1999): pitch circle diameter is 0.3200 m, jet diameter at the best efficiency point is 0.0301 m and nozzle diameter is 0.0469 m. Table 2 provides the re- sultant number of buckets according to each sugge- stion.

Table 2 Resultant number of buckets as suggested by di- fferent sources
It is evident that not only there is a strong dis- agreement between the suggested ways of identifying the optimum number of buckets in the available litera- ture sources but also none of them provide any experi- mental or numerical research data to support their su- ggestions. Moreover, they do not take into account the fact that performance of runners with different number of buckets should be compared when the bucket is mounted at its optimum radial and angular position which is different for each number of buckets because of different spacing. Figure 2 provides a diagram sho- wing the main dimensions of bucket positioning. The angular position describes at what angle the bucket is mounted on a runner and the splitter tip circle diame- ter describes the radial position of the bucket while keeping the pitch circle diameter fixed.
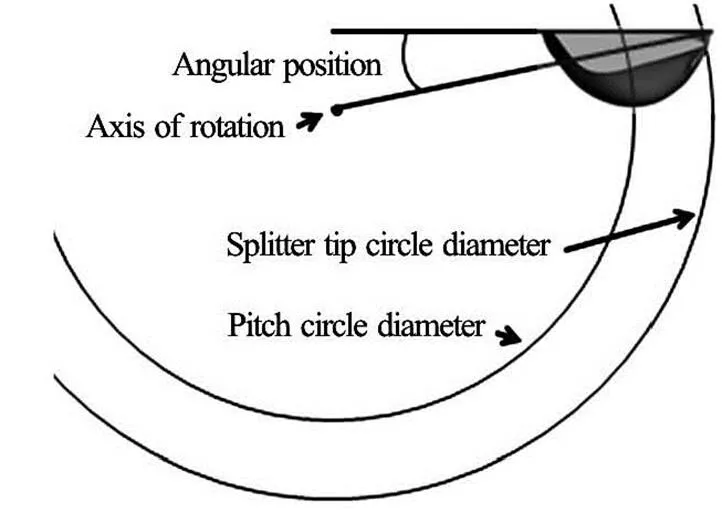
Fig.2 Parameters used for bucket positioning
It will be explained in Section 2that in order to find the best angular and radial position a minimum of 9 data points per each number of buckets is required. Performing such study experimentally would be a costly and difficult process. That might explain the lack of experimentally established guidance in selecti- ng the number of buckets and that the available theo- retical suggestions are only those that are inevitably based on assumptions and are prone to have limitatio- ns. However, recent development in CFD methods and computational resources allows simulating the performance of Pelton runners that include complex phenomena like multiphase, free surface, highly tur- bulent flows for a relatively large number of design variations within a reasonable timescale.
2. Numerical modelling
CFD is used in this study to simulate the perfor- mance of the runner and calculate its efficiency at the best efficiency point for different combination of the three parameters of interest. According to the literatu- re[1], the most widely used CFD code for numerical modelling of Pelton turbine and accurate prediction of its efficiency is ANSYS CFX. The most recent pub- lications on Pelton modelling with CFX useSST turbulence model and Homogeneous multiphase model. Since modelling of Pelton turbine performance requires very high computational resources many sim- plifications are introduced: such as assumption that gravity or surface tension is negligible or modelling of only few buckets of the runner and then constructing the torque of the whole runner. More detailed descri- ption of the CFD method used was described in the initial optimization study[13]already mentioned in the introduction.
Design-expert software for design of experiments (DOE) approach is used to find the best combination of the radial and angular position per each number of buckets. The chosen method for this DOE analysis is the central composite design (CCD)[16], which is desi- gned to estimate the coefficients of a quadratic model and consists of three groups of design points:
(1) Two-level factorial or fractional factorial de- sign points.
(2) Axial points (sometimes called “star” points).
(3) Center points.
Figure 3 provides a typical layout of the design points for the DOE study containing two factors. The- refore, it requires 9 data points per each number of bu- ckets to fit a surface representing the efficiency respo- nse to the angular and radial position.
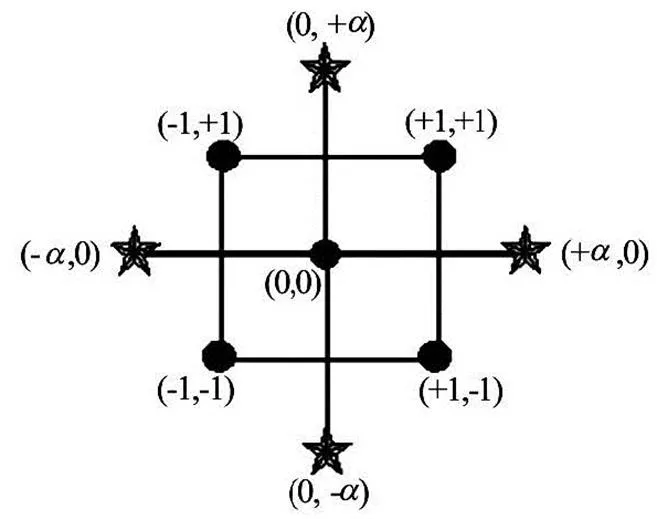
Fig.3 Layout of the design points for the DOE study with two factors
The chosen range for the number of buckets is 14 to 18 since 18 is the maximum number of buckets that can physically fit on this runner. Therefore a total of 45 data points is required for this study. A contour plot for a runner with 18 buckets is provided in Fig.4 where efficiency is normalised to the overall maxi- mum efficiency, the angular position is given as a re- lative measurement using the most optimum angular position for a runner with 18 buckets as a datum and the radial position is normalised using Eq.(4).

Fig.4 Efficiency response contours to radial and angular posi- tion for a runner with 18 buckets
The most optimum angular and radial position of the runner with 18 buckets was chosen to be used as a datum position because the original runner contained 18 buckets. Analogous contour plots are used to ide- ntify the maximum efficiency for each number of bu- ckets.
By taking the maximum efficiencies of each number of buckets a graph given in Fig.5 is created showing that the peak efficiency is achieved using 16 buckets instead of the initial number of 18. This result agrees with the initial assumption that 18 is no longer the optimum number of buckets since the bucket shape was modified and resulted in a larger size bu- cket. This reduction in the number of buckets sugge- sted by CFD results is in agreement with another simi- lar case study by Veselý and Varner[17]where experi- mental results showed that less buckets were required after optimising the bucket shape.
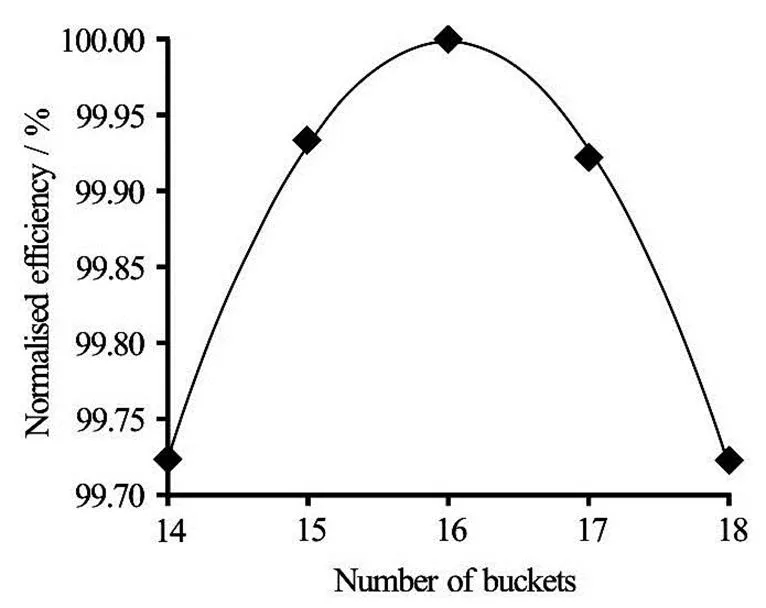
Fig.5 Normalised efficiency vs. the number of buckets
The results show that using the theoretical guida- nce provided by Nechleba[12]a number of buckets close to the optimum can be determined. However, the optimum value can only be achieved empirically be- cause of the limitations in these theoretical methods posed by the assumptions made. When calculating the optimum number of buckets theoretically it is assu- med that the water jet particle always remains in the plane parallel to the axis of the turbine. However, the trajectories of some of the water particles in the jet st- ream are slightly deflected because of the Coanda ef- fect as water detaches from the outer side of the bu- cket when the jet is completely cut off. Also, only the torque from the positive pressure on the inside of the bucket is considered. However, CFD results show a noticeable amount of torque caused by the jet pulling the bucket on its outside when the bucket is cutting into the jet. The negative pressure region on the out- side of the bucket is provided in Fig.6. This phenome- non is also observed experimentally by Refs.[11,18]. The typical torque curves (Fig.1) acquired numerically on the inside and the outside of a single bucket give an indication on the amount of the torque caused by this negative pressure that is pulling the bucket.
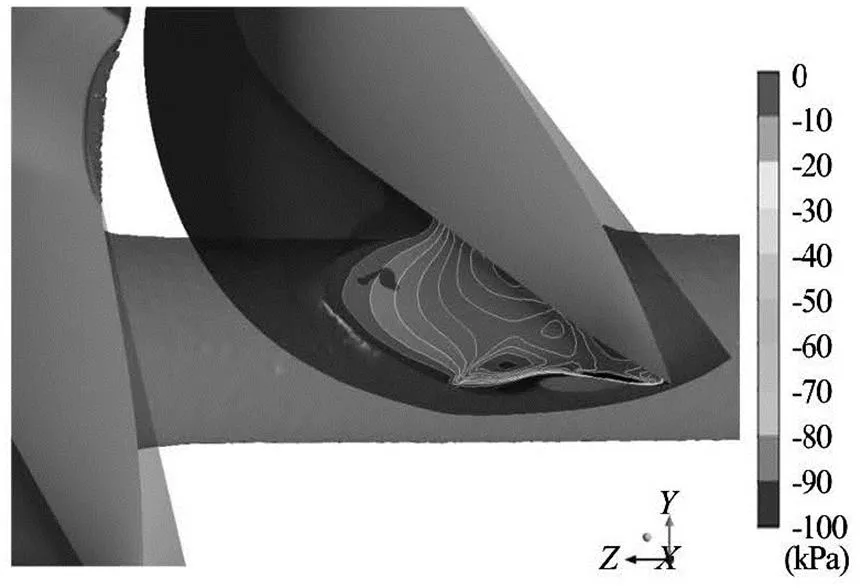
Fig.6 Negative pressures on the outside of the bucket
It can be seen from the efficiency response to the number of buckets presented in Fig.5 that for this ru- nner a number of 16 buckets would be the optimum when aiming at the most efficient turbine design at all costs. However, the variation in efficiency between 15, 16 and 17 buckets is less than 0.1%. This small varia- tion could be treated as negligible. To be more exact according to these results if a number of 15 buckets was selected instead of 16, the resultant efficiency di- fference would be as small as 0.07%. The difference is so small that a sensible decision from manufacturing and economic perspective could be to use a runner with 15 buckets which is the lowest number before a more noticeable drop in the efficiency occurs.
Figure 7 and Fig.8 provide the optimum radial and angular position data taken from the contours for each number of buckets. The optimum positioning of the bucket is changing with the number of buckets and therefore must be taken into account when thoroughly looking for the optimum amount of buckets on the ru- nner.
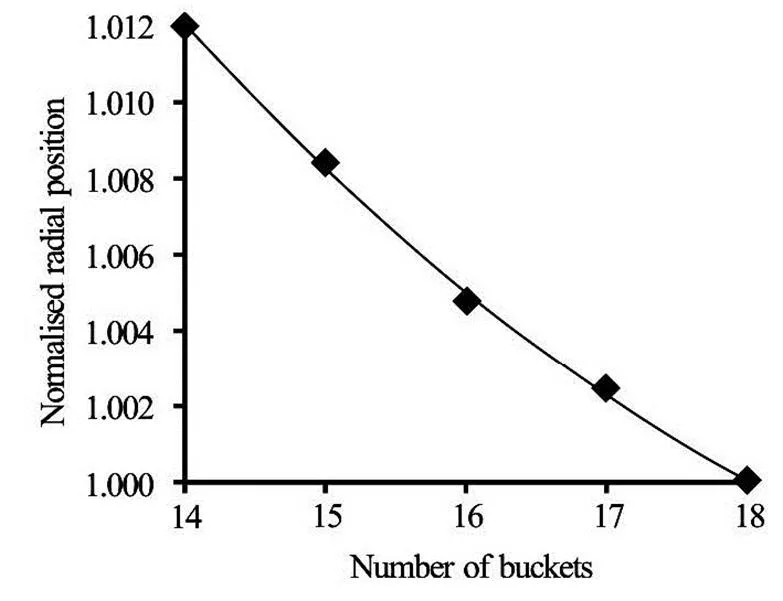
Fig.7 Optimum radial position (normalised with the initial posi- tion) for each number of buckets
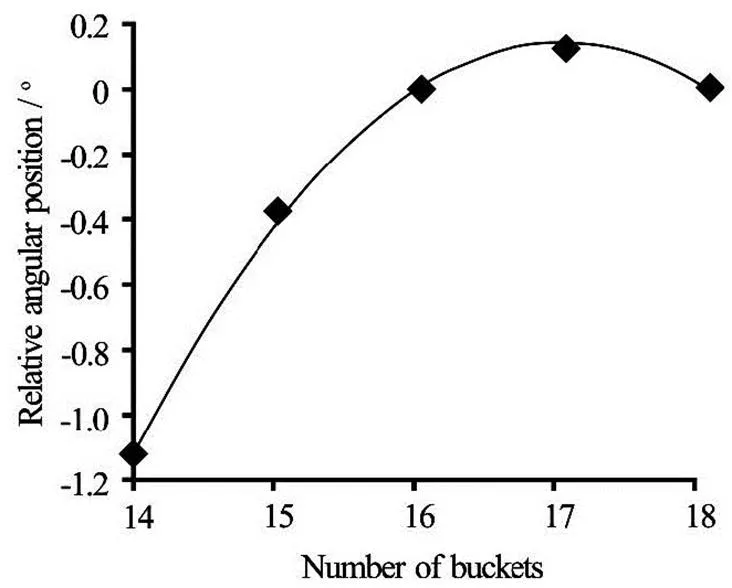
Fig.8 Optimum angular position (relative to the initial position) for each number of buckets
3. Experimental testing
The CFD methods and solver settings used in this study have been previously validated and published by various authors[11]showing that numerical modelling of similar problems has reached a state of reliable ac- curacy. However, the authors are aware of possible physical limitations therefore experimental testing of two runners using 18 and 15 buckets was performed. It was expected that despite a possible systematic off- set between numerical and experimental results, the increase in efficiency when going from 18 buckets de- sign to 15 would be consistent between CFD and ex- periment.
The experimental testing was performed at the Laboratory of Hydraulic Turbo Machines of National Technical University of Athens. The test rig and the manufactured runners are provided in Fig.9 and Fig.10 respectively. The laboratory test rig and the measu- ring procedure complied with the international model test standards IEC 60193:1999 (Fig.11). Table 3 pro- vides the key characteristic dimensions of the testing facility and the model. All instruments were calibrated in the laboratory according to the standards. The cali- bration was performed before and after the experime- ntal testing to confirm that the accuracy was within the range specified by the manufacturers. The total un- certainty of the measured efficiency was equal towhile the random uncertainty in efficiency was investigated according to the IEC 60193:1999 sta- ndards and found equal towith the 95% con- fidence level. In this case, the random uncertainty was of primary importance as two designs were compared in identical conditions, hence the comparison was not influenced by the systematic uncertainty.
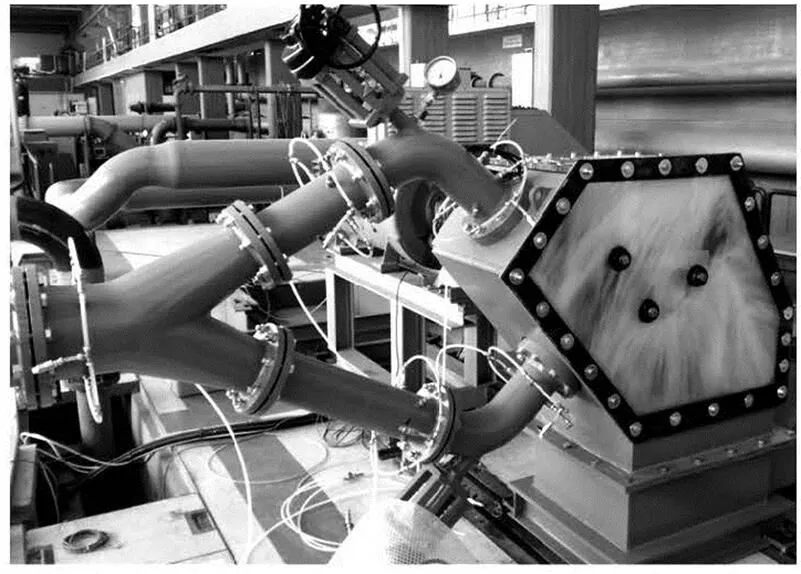
Fig.9 Turbine testing facility in the Laboratory of Hydraulic Machines (NTUA)
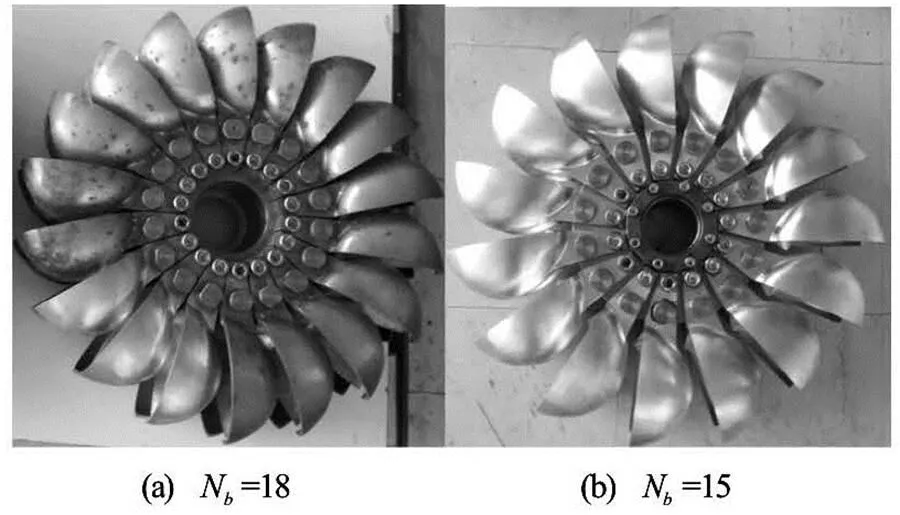
Fig.10 Prototype runners with 18 and 15 buckets
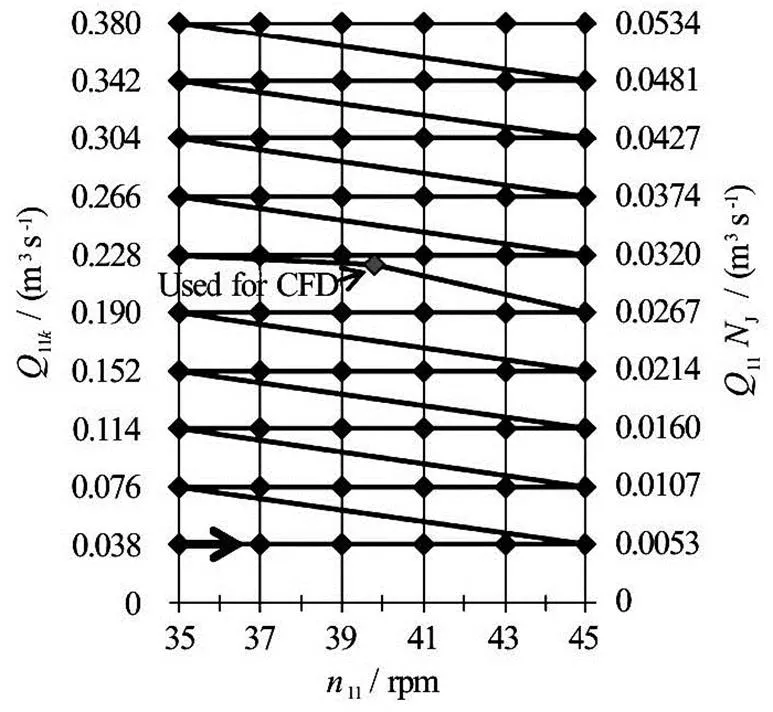
Fig.11 Test plan and testing sequence

Table 3 Characteristic parameters of the test rig
Experimental testing results are provided in the form of efficiency hill charts in terms of the unit speed(Eq.(5)) and the unit flow rate specified to the bu- cket width and one jet(Eq.(7)). Equations used to define these parameters characterising the operating conditions of a turbine are based on the Affinity laws[12,19]and most of them can be found in the IEC 60193:1999 standards.
Unit speed
Unit flow rate
In the IEC 60193:1999 standards the minimum model size of Pelton turbine is specified in terms of bucket width (as oppose to the reference diameter which is a characteristic minimum dimension for other turbines). This suggests that bucket width represents the Pelton turbine better than the reference diameter, hence following the same logic additional unit flow rate definition was made to allow more generic com- parison of Pelton runners. This equation of unit flow rate specified to the bucket width and one jet allows comparison between among different specific speed Pelton runners.
Unit flow rate specified for the bucket width and one jet
4. Results and discussion
Normalised experimental results of runners with 18 and 15 buckets are provided in Fig.12 (two jet ope- ration) and Fig.13 (single jet operation). The datum for normalising of all experimental results was the measured best efficiency point of the runner with 18 buckets under the two jet operation. The efficiency in- crease at the best efficiency point was 0.4% under the two jet operation and 0.8% under the single jet opera- tion, showing that the peak efficiency has increased as the number of buckets was drastically reduced.
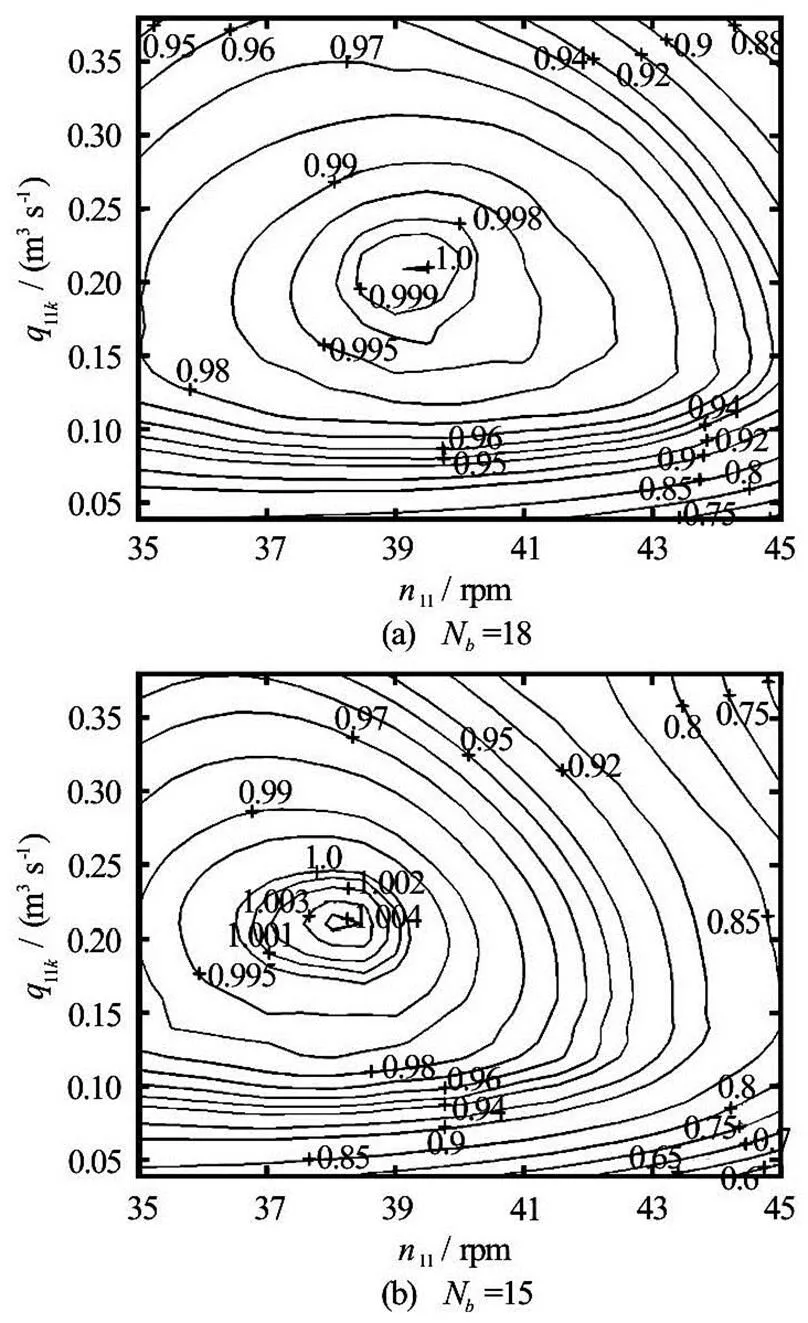
Fig.12 Normalised efficiency hill charts of runners with 18 and 15 buckets under two jet operation
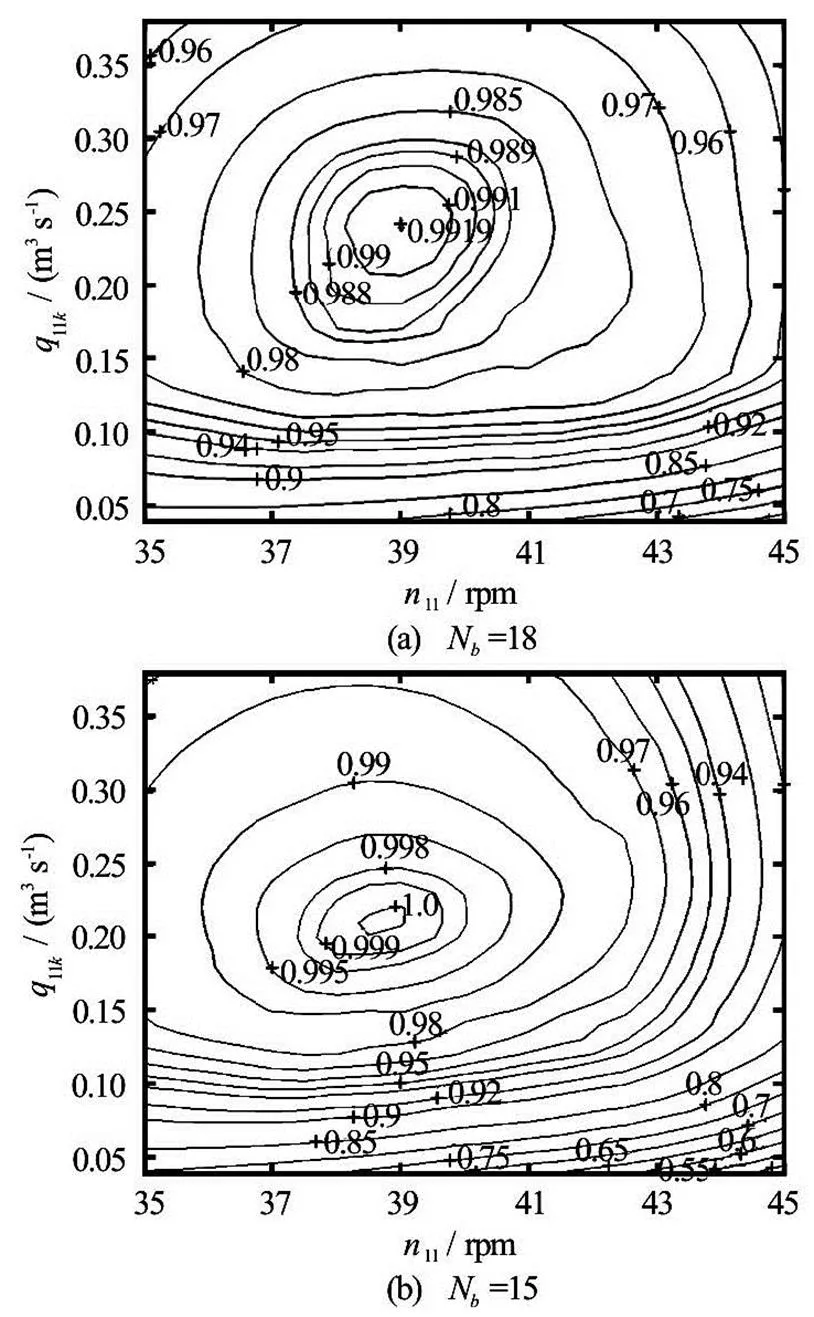
Fig.13 Normalised efficiency hill charts of runners with 18 and 15 buckets under single jet operation
To represent the performance increase within complete range of flow rates and the possible change of the best efficient unit speed, efficiency vs.gra- phs at constantvalues were produced (Fig.14 and Fig.15). In both figures three curves are presented:
(1) Dashed–performance with original number of bucketsat the best efficientvalue.
(2) Solid–performance with reduced number of bucketsat the original best efficientvalue.
(3) Dotted–performance with reduced number of bucketsat the best efficientvalue for the reduced number of buckets design.
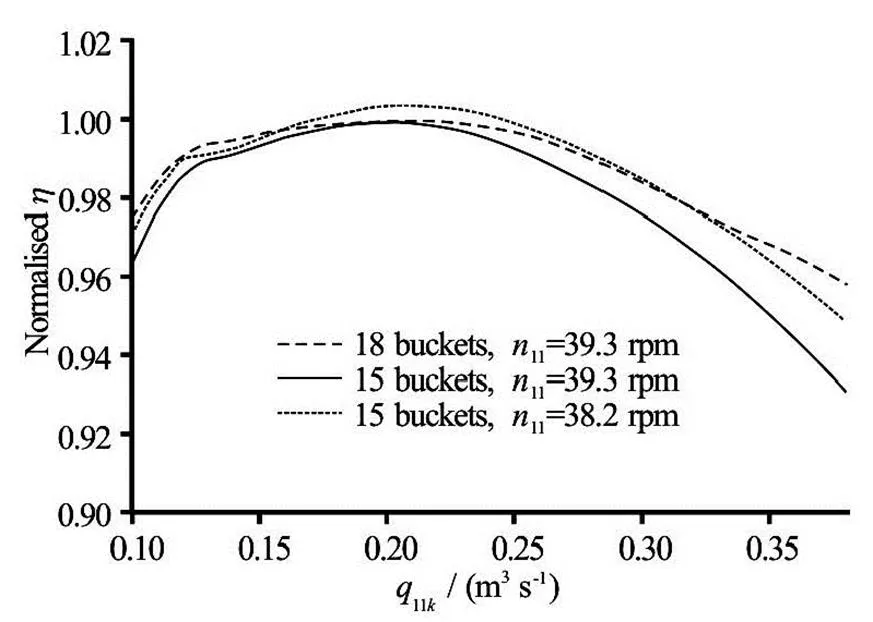
Fig.14 Comparison of runner performance at the best efficient using 18 and 15 buckets–two jets in operation
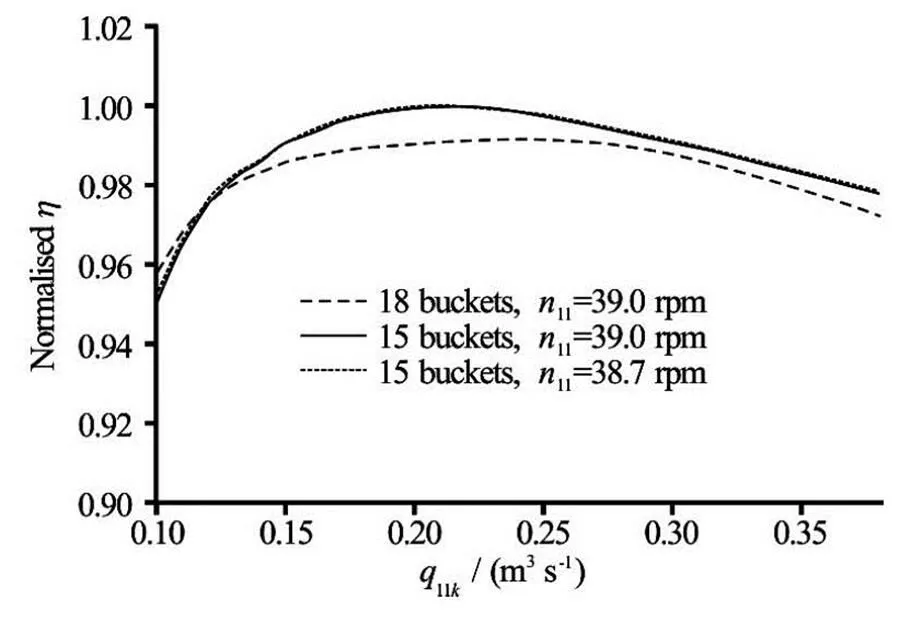
Fig.15 Comparison of runner performance at the best efficient using 18 and 15 buckets–single jet operation
For single jet operation there is almost no differe- nce in the best efficientof the runners with 18 and 15 buckets. However, when both jets are operating, the best efficientfor 18 and 15 buckets is quite di- fferent, i.e. there is a reduction in the best efficientfor the runner with 15 buckets. Moreover, in two jet operation the efficiency increase is local and drops to negative for very high flow rates. Higher improve- ment in the efficiency for the single jet operation and the reduction of the best efficientfor two jet ope- ration indicate that the runner with 15 buckets is expe- riencing some problems in the two jet operation.
The problem was identified to be the jet interfe- rence during the operation with both jets. As the num- ber of buckets is reduced the angle between the bu- ckets is increased. This means that the first jet is ente- ring the bucket for slightly longer time before it gets cut off by the following bucket. Consequently the water from the first jet stays longer in the bucket as presented in Fig.16. Therefore there is a possibility that the second jet starts entering the bucket before the water from the first jet has cleared.
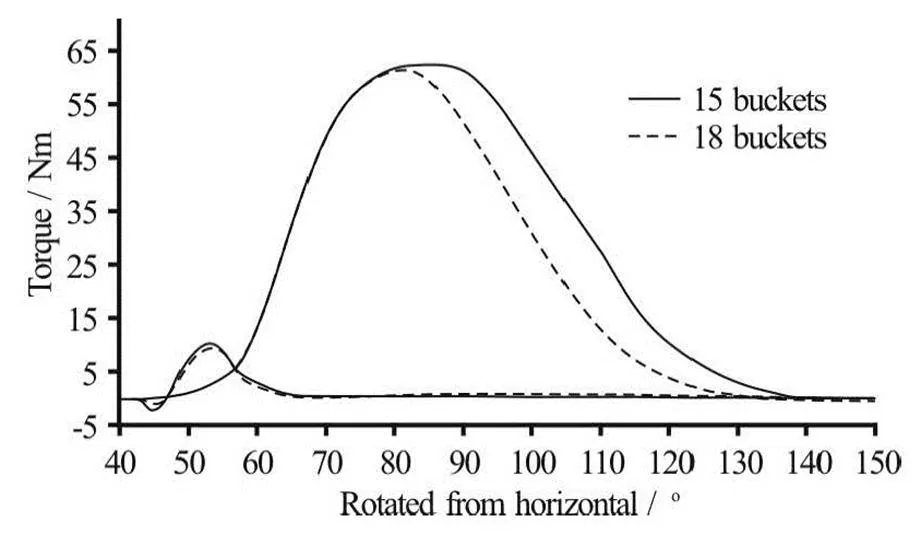
Fig.16 Torque curves on a single bucket in a runner made of di- fferent number of buckets
The problem of jet interference in the two jet operation was investigated by Wei, Wei et al.[20]and indeed showed reduction in the torque produced by the second jet in the case where the angle between the jets is too small (Fig.17). This interference can only be expected to increase as the flow rate is increased and more water is entering the bucket.
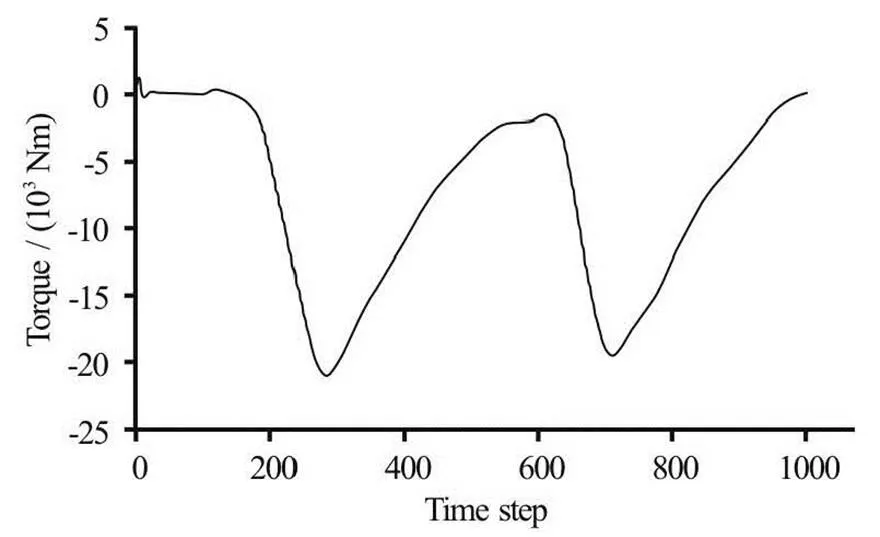
Fig.17 Two torque peaks (inverted) generated by two jets on a single bucket[20]
To check if the interference between the jets is the case in the current runner with 15 buckets, the tor- que curve from a single jet operation was copied and shifted bywhich was the angle between the jets in the test rig. Figure 18 presents the two torque cur- ves on the runner with the original number of buckets. As expected the transition from the first jet entering the bucket to the second was swift, i.e. the water from the first jet has left the bucket just before the second jet was entering, showing that the angle be- tween the jets was appropriate for the original runner. However the torque curves provided in Fig.19 indicate that there is a potential for interference between the first and second jets. This suggests that if the angle between the jets was increased to eliminate the inter- ference between them, the efficiency increase provi- ded by the runner with 15 buckets under the operation with both jets can be expected to be higher than 0.4% at the BEP and consistent over the whole range of flow rates as in the single jet operation.
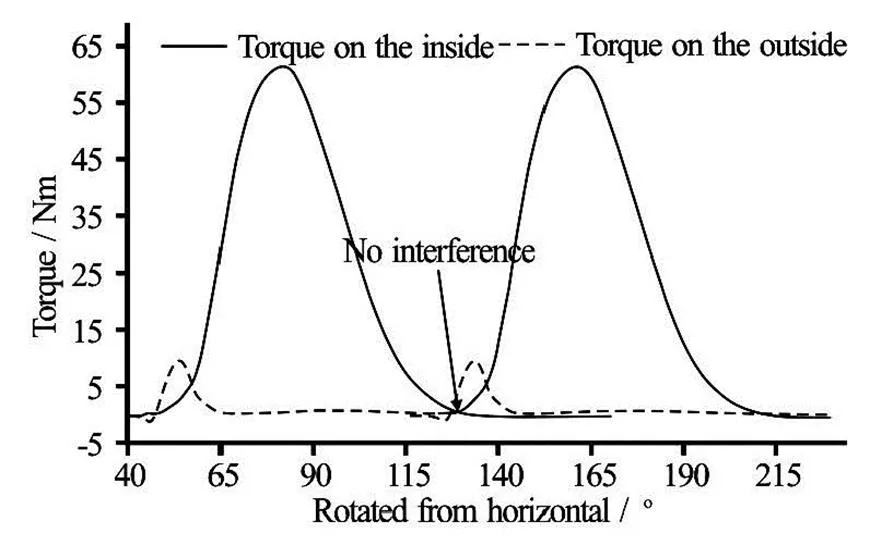
Fig.18 Two torque peaks taken from the single jet simulation and manually shifted by the angle between the jets . Runner with 18 buckets

Fig.19 Two torque peaks taken from the single jet simulation and manually shifted by the angle between the jets . Runner with 15 buckets
Overall, the experimental results show that the runner was successfully optimised by reducing its number of buckets from the original 18 to 15 which is beyond any suggestion found in Pelton design guide- lines available in the public domain.
5. Conclusion
The number of buckets is an important parameter when optimising a Pelton turbine runner. However, no consistent guidance based on experimental or numeri- cal research data is available in the public domain. The case study described in this paper draws attention to the inconsistency in the available guidance and pro- vides an example of how the optimum number of bu- ckets and their mounting position could be identified numerically after the bucket geometry is modified. Experimental results show that readjusting these para- meters has additionally increased runner efficiency by 0.8% under the single jet operation and 0.4% under the two jet operation. It is explained that the efficiency increase under the operation with both jets could be higher and most probably similar to the single jet ope- ration if the angle between the jets was increased to eliminate the interference between the jets. In addition to the efficiency increase which is a highly desirable achievement itself, the reduction of the number of buckets from 18 to 15 reduces the complexity and the cost of runner manufacturing.
Acknowledgements
The authors gratefully acknowledge the help and the support of Lancaster University Renewable Ene- rgy Group and Fluid Machinery Group. The study was performed at Lancaster University, UK and the expe- rimental testing was performed at National Technical University of Athens, Greece.
References
[1] ŽIDONIS A., AGGIDIS G. A. State of the art in numeri- cal modelling of Pelton turbines[J]. Renewable and Sus- tainable Energy Reviews, 2015, 45: 135-144.
[2] DOBLER W., KNOBLAUCH H. and ZENZ G. Hydraulic investigations investigation of a Y-bifurcator[C]. Procee- dings of the first European IAHR Congress. Edinburgh, UK, 2010.
[3] ZHANG Z., CASEY M. Experimental studies of the jet of a Pelton turbine[J]. Proceedings of the Institution of Me- chanical Engineers, Part A: Journal of Power and Ene- rgy, 2007, 221(8): 1181-1192.
[4] BENZON D., ŽIDONIS, A. and PANAGIOTOPOULOS A. et al. Impulse turbine injector design improvement using computational fluid dynamics[J]. Journal of Fluids Engineering, 2015 137(4): 041106.
[5] BENZON D., ŽIDONIS A. and PANAGIOTOPOULOS A. et al. Numerical investigation of the spear valve configura- tion on the performance of Pelton and Turgo turbine inje- ctors and runners[J]. Journal of Fluids Engineering, 2015, 137(11): 111201.
[6] PERRIG A., AVELLAN F. and KUENY J. L. et al. Flow in a Pelton turbine bucket: Numerical and experimental in- vestigations[J]. Journal of Fluids Engineering, 2006, 128(4): 350-358.
[7] BINAYA K. C., THAPA B. Pressure distribution at inner surface of selected Pelton bucket for micro hydro[J]. Kathmandu University Journal of Science, Enginee- ring and Technology, 2009, 5(2): 42-50.
[8] ANAGNOSTOPOULOS John S., PAPANTONIS Dimitris E. A fast Lagrangian simulation method for flow analysis and runner design in Pelton turbines[J]. Journal of Hy- drodynamics, 2012, 24(6): 930-941.
[9] MATTHIAS H. B., PROST J. and ROSSEGGER C. In- vestigation of the flow in Pelton turbines and the influence of the casing[J]. International Journal of Rotating Ma- chinery, 1997, 3(4): 239-247.
[10] EISENRING M. MHPG Series: Harnessing water power on a small scale. Volume 9: Micro Pelton tur- bines[M]. St. Gallen, Switzerland: Swiss Centre for App- ropriate Technology, 1991.
[11] PERRIG A. Hydrodynamics of the free surface flow in Pelton turbine buckets[D]. Doctoral Thesis, Lausanne, Switzerland: EPFL, 2007.
[12] NECHLEBA M. Hydraulic turbines: Their design and equipment equipement[M]. London, UK: Artia-Prague, 1957.
[13] ŽIDONIS A., PANAGIOTOPOULOS Alexandros and AGGIDIS George A. et al. Parametric optimisation of two Pelton turbine runner designs using CFD[J]. Journal of Hydrodynamics, 2015, 27(3): 403-412.
[14] ATTHANAYAKE I. U. Analytical study on flow through a Pelton turbine bucket using boundary layer theory[J]. In- ternational Journal of Engineering and Technology, 2009, 9(9): 241-245.
[15] NASIR B. A. Design of high efficiency Pelton turbine for micro hydropower plant[J]. International Journal of Ele- ctrical Engineering and Technology, 2013, 4(1): 171- 183.
[16] DRAPER N. R., LIN D. K. J. Small response-surface desi- gns[J]. Technometrics, 1990, 32(2): 187‑194.
[17] VESELÝ J., VARNER M. A case study of upgrading of 62.5 MW Pelton turbine[C]. Uprating and Refurbishing Hydro Power Plants VIII. Prague, Czech Republic, 2001.
[18] PARKINSON E., NEURY C. and GARCIN H. et al. Un- steady analysis of a Pelton runner with flow and mechani- cal simulations[J]. International Journal on Hydro- power and Dams, 2006, 13(2): 101-105.
[19] AGGIDIS G. A., ŽIDONIS A. Hydro turbine prototype te- sting and generation of performance curves: Fully automa- ted approach[J]. Renewable Energy, 2014, 71(11): 433- 441.
[20] WEI X., YANG K. and WANG H. et al. Numerical inve- stigation for one bad-behaved flow in a Pelton turbine[J]. IOP Conference Series: Materials Science and Engi- neering, 2015, 72(4): 042033.
* Biography: Audrius ŽIDONIS (1987-), Male, Ph. D., Research Assistant
Corresponding author: George A. AGGIDIS, E-mail: g.aggidis@lancaster.ac.uk
10.1016/S1001-6058(16)60609-1 2016,28(1):75-83
- 水动力学研究与进展 B辑的其它文章
- Ski-jump trajectory based on take-off velocity*
- Formation of air-entraining vortices at horizontal intakes without approach flow induced circulation*
- Numerical simulation of flow and bed morphology in the case of dam break floods with vegetation effect*
- Numerical study of the flow in the Yellow River with non-monotonous banks*
- Numerical and experimental studies of hydraulic noise induced by surface dipole sources in a centrifugal pump*
- Mass transport in a thin layer of power-law fluid in an Eulerian coordinate system*

