基于同位素特征的华北平原菜地N2O排放监测中取样时间的探讨
2016-08-24 09:09房福力李玉中
植物营养与肥料学报 2016年4期
房福力, 李玉中
(中国农业科学院农业环境与可持续发展研究所, 北京 100081)
基于同位素特征的华北平原菜地N2O排放监测中取样时间的探讨
房福力, 李玉中*
(中国农业科学院农业环境与可持续发展研究所, 北京 100081)

N2O通量; δ15N-N2O; δ18O-N2O; SP; 日变化
菜地N2O排放具有时间变异性,对评价N2O排放总量和排放系数具有重要影响。研究N2O同位素和通量日变化对了解N2O微生物产生过程及减排政策的提出具有指导意义。国内研究多关注N2O通量日变化动态[1-7],很少关注N2O同位素日变化动态。采用同位素对N2O日变化规律的研究也多集中在草地[8],湿地[9]和农田[10],在菜地上的研究却鲜有报道。
目前研究N2O通量日变化动态主要采用自动或半自动连续取样箱取样[11-19],这种取样方式具有许多优点,但同时也具有取样量大,影响土壤理化性质及植物生长等缺点[14, 20-21],而这些缺点在监测N2O同位素变化并以此为基础分析N2O微生物来源时则会放大[22]。通过气相色谱—静态气体箱技术对草地[8]和农田作物[10]的监测发现取样时间与土壤类型、 气候及天气条件等各种因素有关,因此取样时间的不同会对结果产生影响。了解N2O通量及同位素日变化规律,对提高N2O排放量和排放系数估计的准确性,提出有效的减排措施具有重要意义。

本研究通过测定施加尿素处理后菜地土壤释放N2O的通量及其氮氧同位素值的日变化动态,确定监测N2O通量和同位素特征的合适时间,为长期监测N2O通量及同位素变化规律提供依据。
1 材料与方法
1.1试验区概况
试验在中国农业科学院农业环境与可持续发展研究所顺义实验基地(东经40°5′2″,北纬116°55′19″)进行,该基地位于华北平原北端,属于潮白河冲积扇下段,气候为典型的暖温带半湿润大陆性季风气候。年平均日照时数2684 h,年平均气温12.5℃,年平均降水量623.5 mm, 无霜期195 d。供试土壤为潮褐土,土壤有机质含量15.48 g/kg、 全氮0.37 g/kg、 全磷0.61 g/kg、 全钾20.42 g/kg、有效磷12.69 mg/kg、速效钾98.10 mg/kg、 pH 8.38。
1.2试验设计
试验于2012年4月27日至28日进行,为莴苣种植且施肥后第5 d和第6 d。选择此时间的原因是根据本课题之前的研究结果发现,在施肥和灌溉后4到7 d,N2O排放量较高且比较平稳,不仅能够代表整个生长期N2O通量的变化,而且这一时期土壤环境较为稳定,产生N2O的微生物过程不易发生较大的转变。以采样时间为变量,设定两种时间间隔,分别为2 h和10 min,测定土壤释放N2O的含量及同位素值,并计算N2O的通量和SP(位置嗜值,Site preference),分析N2O通量和同位素特征值(δ15Nbulk-N2O,δ18O-N2O和SP)在24 h内的时间动态变化规律(2 h)和1 h内随扣箱后密闭时间(10 min)的变化规律,以确定具有代表性的取样时刻和密闭时间。供试肥料为尿素,施用量为300 kg/hm2,施肥方式为局部施肥,其他肥料用量和灌溉量按照农户推荐标准。
1.3样品采集与分析
N2O气体采样采用静态气体箱。取样间隔为两种: 1)每2 h取一次样,扣箱1 h后取样,1 h后打开箱体,一天取样12次。2)确定具有代表性的取样时候后,对于一次取样,从开始扣箱的时刻计时,分别在0、 10、 20、 30、 40、 50、 60 min取样。两种时间间隔每次取三瓶样品作为重复,取样量分别为20、 120、 120 mL,用注射器抽取箱内气体,注入相应体积的真空玻璃瓶中,分别测定N2O含量和δ15Nbulk-N2O和δ15Nα-N2O。每次开箱后左右晃动箱体以置换箱内气体,在取气之前都要用注射器连接静态气体箱后来回抽动注射器以混匀箱中气体。土壤温度、 空气温度通过站内气象站测定,箱内温度采用温度计测定。
N2O通量计算公式为:
(1)
式中,F—气体排放通量,为单位时间单位面积土壤表面释放的N2O[μg/(m2·h)]; A—取样箱的底面积(m2); V—取样箱的体积(m3); T1、 T2—分别为扣箱前和扣箱后箱体内的温度(℃); t1、 t2—分别为扣箱和开箱时间(h); M0—气体的摩尔质量(g/moL); m1、 m2—分别为扣箱前和扣箱后箱内气体的质量(μg); c1、 c2—分别为扣箱前和扣箱后箱内气体的体积浓度(μL/L)。
N2O同位素比率采用痕量气体(Isotope Trace Gas, UK),用稳定同位素仪(Isoprime 100, UK)测定,具体方法参照[25]。N2O同位素组成的δ表示方法为:
(2)
式中,R=15N/14N和18O/16O,下标sample和standard分别表示样品和标准物。其中氮和氧的标准物分别为标准大气中的氮气(N2-atm)和位于维也纳(Vienna)国际原子能组织同位素实验室配制的平均海洋水(standard mean ocean water,SMOW),即V-SMOW。
除此之外,SP和δ15Nβ来源于以下公式:
SP=δ15Nα-δ15Νβ
(3)
(4)
δ15Nbulk-N2O、δ15Nα-N2O、 δ18O和SP的精度分别为0.2‰、 1‰、 0.5‰和1.3‰。
静态气体箱中的气体是空气和土壤释放出来的气体的混合物[10],且服从公式
(5)
式中, δmeasCmeas、δatmCatm和δSDCSD分别表示来自于测定的(measure),空气的(atmosphere)和土壤驱动排放(Soil-Derived)的N2O的同位素特征值和含量。空气中N2O含量,δ15Nbulk、δ15Nα、 δ15Nβ、 δ18O和SP分别为324 μg/L、 7.0‰、 16.9‰、 -1.8‰、 43.7‰和18.7‰[27]。CSD为静态气体箱中测定N2O的含量(Cmeas)和空气中N2O(Catm)的差值。根据方程(5),当CSD/Catm<0.3时误差增大,计算得来的同位素比率不适合使用[29]。由于土壤释放的N2O具有显著的时空变异性,为了表示土壤释放N2O的同位素特征,本研究用通量加权平均值来表示整个生长季N2O特征,公式为
(6)
式中,ci和δi分别表示在i时刻测定的含量和同位素值;δcw是某一天土壤释放N2O的通量加权值,此时n=3,即为重复数。
1.4数据处理
试验数据用Microsoft Excel 2010 软件进行处理; 应用SAS8.1软件进行统计分析,采用相关分析法分析土壤水分、 土壤温度、 土壤N2O通量、 δ15Nbulk-N2O、 δ18O-N2O和SP之间的相关性; LSD法进行多重比较和显著性显验(P<0.05)。
2 结果与分析

图1 静态气体箱覆盖下土壤温度及土壤充水孔隙度日变化动态 Fig.1 Diurnal temperature and water filled-pore space of soil under stable flux chamber
2.1静态气体箱中N2O含量和通量日变化动态
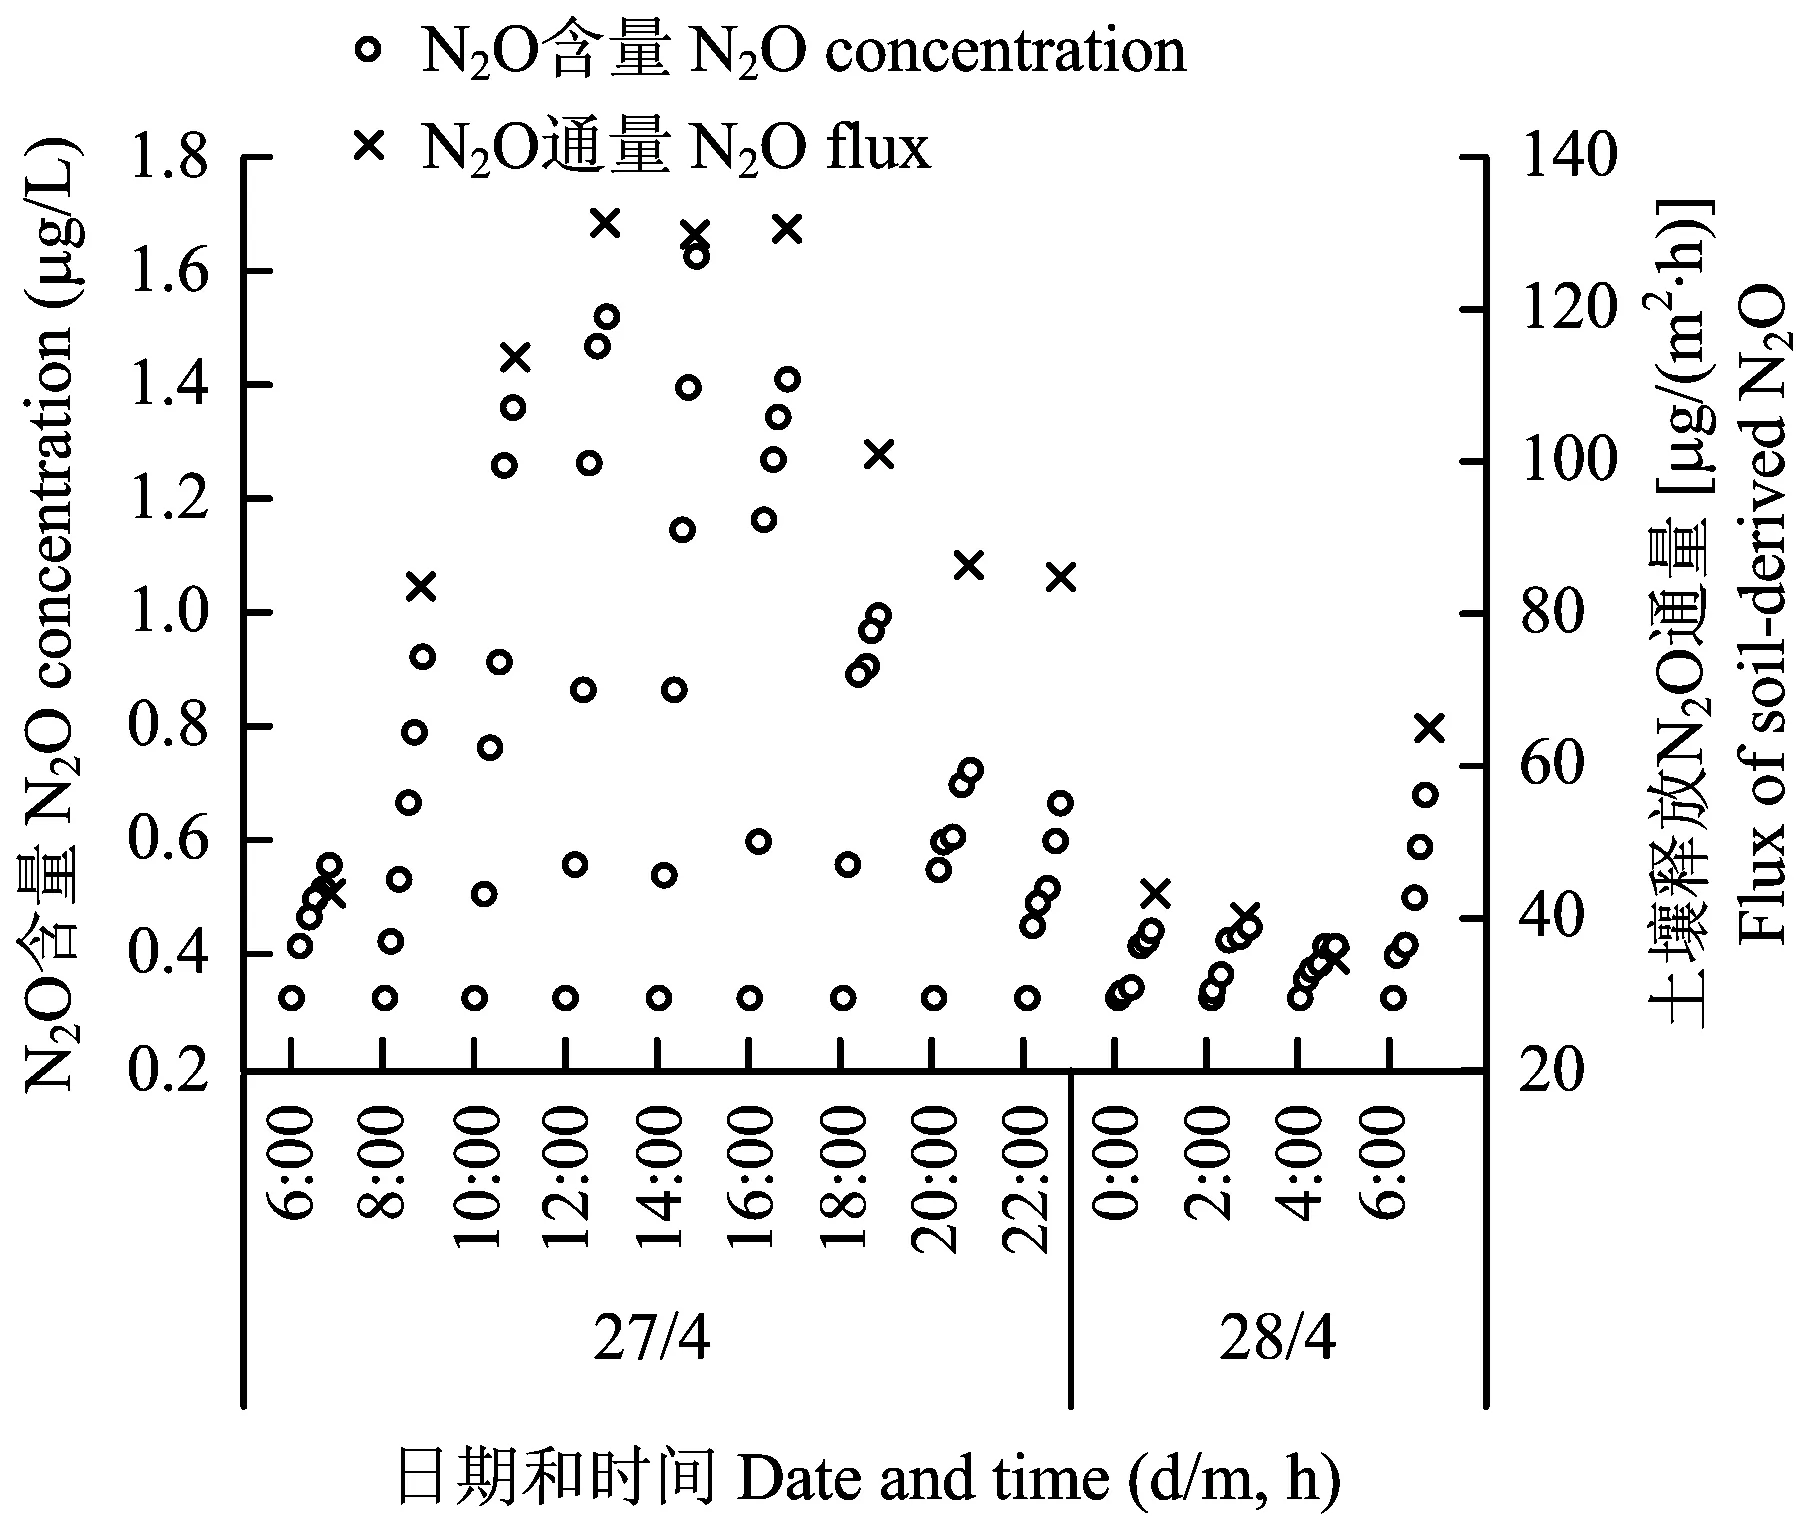
图2 静态气体箱中土壤释放N2O含量及相应通量随时间变化Fig.2 Change of N2O concentrations and soil-derived flux of N2O within the chamber headspace with time
2.2N2O含量和同位素特征值日变化动态

表1 华北平原菜地土壤N2O通量及同位素日变化
注(Note): 同列数据后不同字母表示处理间差异达5%显著水平 Values followed by different letters in a column are significant among treatments at the 5% level.
2.3扣箱后1 h内N2O含量和同位素特征值变化动态

图3 N2O含量、 δ15N-N2O、 δ18O-N2O和SP在扣箱1 h内的变化趋势Fig.3 Changes in the concentration of N2O, δ15N-N2O, δ18O-N2O and SP within the headspace of flux chamber during 1h chamber closing[注(Note): 9: 00为扣箱0时,取空气值为样品,其含量为324 μg/L[39],δ15N-N2O为7‰,δ18O-N2O为43.7‰,SP为18.7‰[26] Solid circles at time 9 am indicate previously reported values for the concentrations of N2O[39], δ15N-N2O, δ18O-N2O and SP of N2O in the atmosphere were 324 μg/L, 7‰, 43.7‰ and 18.7‰[26], respectively.]
3 讨论
3.1根据通量和同位素变化选取监测时刻
由于N2O通量日变化较大,为了方便进行长期观测,目前大部分研究都以某一时间段的通量代表全天的通量,并以此计算累计N2O排放量和排放系数[1,3,6-7]。本研究结果表明(表1),在11: 00至17: 00,N2O通量较高且基本保持稳定,但是采用此时间段任意一个值表示全天平均通量都会使对N2O估计排放量偏高,如果用9: 00的N2O的通量83.66 μg/(m2·h)表示全天通量平均值82.82 μg/(m2·h)(表1),则误差较小。但是问题在于不同土壤环境条件和取样时间,N2O通量受各种因素影响,如温度、 土壤含水量及微生物过程,而这些参数在一天之内也会随时间的变化而改变,因此N2O通量也会随之变化,对于某一特定土壤和环境,哪个时刻能够代表N2O全天通量平均值也会不一样。
3.2单次取样密闭时间的选取
3.3采用SP区别N2O来源

假如N2O完全来自于土壤硝化作用和反硝化作用,那么同位素混合模型[46],
fD=N2OD/N2Ototal
(7)
(8)
fD=1-fN
(9)
式中, SPD和SPN表示纯培养试验中N2OD和N2ON得到的SP值(37‰和0‰); SPtotal为环境样品的N2Ototal的位置嗜值,fD和fN分别表示产生的N2O来自反硝化作用和硝化作用的比例。
4 结论
3)扣箱40 min后,N2O含量、 δ15N-N2O和SP值达到稳定,因此选取40 min作为观测N2O含量和同位素变化的密闭时间。
4)4月27日至4月28日的24 h之内,SP值的通量加权平均值为22.54‰,根据国际上的相关研究结论,即细菌硝化作用产生N2O的SP值为37‰,反硝化作用产生N2O的SP值为0‰,硝化作用对N2O的产生起主导作用,大约60.92%的N2O由硝化作用产生,39.08%的N2O由反硝化作用产生。
5)在华北平原测定菜地N2O气体通量和同位素特征值变化时,选取9: 00作为具有代表性的观测点,选取40 min作为密闭时间比较适宜。
[1]李梓铭, 杜睿, 王亚玲, 等. 中国草地N2O通量日变化观测对比研究[J]. 中国环境科学, 2012, 32(12): 2128-2133.
Li Z M, Du R, Wang Y L,etal. Comprison of diurnal variation of nitrous oxide fluxes from grassland of China[J]. China Environmental Science, 2012, 32(12): 2128-2133.
[2]叶欣, 李俊, 王迎红, 等. 华北平原典型农田土壤氧化亚氮的排放特征[J]. 农业环境科学学报, 2005, 24(6): 1186-1191.
Ye X, Li J, Wang Y H,etal. Characterization of emissions of nitrous oxide from soils of typical crop fields in North China Plain[J]. Journal of Agro-Environment Science, 2005, 24(6): 1186-1191.
[3]邱炜红, 刘金山, 胡承孝, 等. 菜地系统土壤氧化亚氮排放的日变化[J]. 华中农业大学学报, 2011, 30(2): 210-213.
Qiu W H, Liu J S, Hu C X,etal. Daily change of nitrous oxide emission from vegetable system[J]. Journal of Huazhong Agricultural University, 2011, 30(2): 210-213.
[4]Zhu J, Mulder J, Wu L P,etal. Spatial and temporal variability of N2O emissions in a subtropical forest catchment in China[J]. Biogeosciences, 2013, 10(3): 1309-1321.
[5]von der Heide C, Böttcher J, Deurer M,etal. Spatial and temporal variability of N2O in the surface groundwater: a detailed analysis from a sandy aquifer in northern Germany[J]. Nutrient Cycling in Agroecosystems, 2010, 87(1): 33-47.
[6]Dinsmore K J, Skiba U M, Billett M F,etal. Spatial and temporal variability in CH4and N2O fluxes from a Scottish ombrotrophic peatland: Implications for modelling and up-scaling[J]. Soil Biology and Biochemistry, 2009, 41(6): 1315-1323.
[7]Williams D L, Ineson P, Coward P A. Temporal variations in nitrous oxide fluxes from urine-affected grassland[J]. Soil Biology and Biochemistry, 1999, 31(5): 779-788.
[8]Ostrom N E, Sutka R, Ostrom P H,etal. Isotopologue data reveal bacterial denitrification as the primary source of N2O during a high flux event following cultivation of a native temperate grassland[J]. Soil Biology and Biochemistry, 2010, 42(3): 499-506.
[9]Bol R, Röckmann T, Blackwell M,etal. Influence of flooding on δ15N, δ18O, 1δ15N and 2δ15N signatures of N2O released from estuarine soils-a laboratory experiment using tidal flooding chambers[J]. Rapid Communications in Mass Spectrometry, 2004, 18(14): 1561-1568.
[10]Opdyke M R, Ostrom N E, Ostrom P H. Evidence for the predominance of denitrification as a source of N2O in temperate agricultural soils based on isotopologue measurements[J]. Global Biogeochemical Cycles, 2009, 23(4): 272-277.
[11]Mosier A R, Duxbury J M, Freney J R,etal. Nitrous oxide emissions from agricultural fields: Assessment, measurement and mitigation[J]. Plant and Soil, 1996, 181(1): 95-108.
[12]黄树辉, 吕军. 区分土壤中硝化与反硝化对N2O产生贡献的方法[J]. 农业工程学报, 2005, (S1): 48-51.
Huang S H, Lü J. Methods for the contributions of nitrification and denitrification to the production of nitrous oxide from soil[J]. Transactions of the CSAE, 2005, (S1): 48-51.
[13]Conen F, Smith K A. A re-examination of closed flux chamber methods for the measurement of trace gas emissions from soils to the atmosphere[J]. European Journal of Soil Science, 1998, 49(4): 701-707.
[14]Rochette P, Eriksen-Hamel N S. Chamber measurements of soil nitrous oxide flux: Are absolute values reliable?[J]. Soil Science Society of America Journal, 2008, 72(2): 331-342.
[15]Smemo K A, Ostrom N E, Opdyke M R,etal. Improving process-based estimates of N2O emissions from soil using temporally extensive chamber techniques and stable isotopes[J]. Nutrient Cycling in Agroecosystems, 2011, 91(2): 145-154.
[16]Cardenas L M, Thorman R, Ashlee N,etal. Quantifying annual N2O emission fluxes from grazed grassland under a range of inorganic fertilizer nitrogen inputs[J]. Agriculture, Ecosystems & Environment, 2010, 136(3-4): 218-226.
[17]Pennock D, Farrell R, Desjardins R,etal. Upscaling chamber-based measurements of N2O emissions at snowmelt[J]. Canadian Journal of Soil Science, 2005, 85(1): 113-125.
[18]Gaihre Y K, Wassmann R, Tirol-Padre A,etal. Seasonal assessment of greenhouse gas emissions from irrigated lowland rice fields under infrared warming[J]. Agriculture, Ecosystems & Environment, 2014, 184(1): 88-100.
[19]Klein C A D, Shepherd M A, Weerden T J V D. Nitrous oxide emissions from grazed grasslands: interactions between the N cycle and climate change-a New Zealand case study[J]. Current Opinion in Environmental Sustainability, 2014, 9-10: 131-139.
[20]Denmead O T. Approaches to measuring fluxes of methane and nitrous oxide between landscapes and the atmosphere[J]. Plant and Soil, 2008, 309 (1-2): 5-24.
[21]Pedersen A R, Petersen S O, Schelde K A. Comprehensive approach to soil-atmosphere trace-gas flux estimation with static chambers[J]. European Journal of Soil Science, 2010, 61(6): 888-902.
[22]Yamulki S, Toyoda S, Yoshida N,etal. Diurnal fluxes and the isotopomer ratios of N2O in a temperate grassland following urine amendment[J]. Rapid Communications in Mass Spectrometry, 2001, 15(15): 1263-1269.
[23]Firestone M K, Davidson E A. Microbiological basis of NO and N2O production and consumption in soil. Exchange of trace gases between terrestrial ecosysterms and the atmosphere[M].New York: John Wiley & Sons, 1989, 7-21.
[24]Michener R H, Lajtha K. Stable isotopes in ecology and environmental science[J]. Journal of Animal Ecology, 1994, 54(2): 434-435.
[25]Maeda K, Toyoda S, Shimojima R,etal. Source of nitrous oxide emissions during the cow manure composting process as revealed by isotopomer analysis of and amoA abundance in betaproteobacterial ammonia-oxidizing bacteria[J]. Applied and Environmental Microbiology, 2010, 76(5): 1555-1562.
[26]Yoshida N, Toyoda S. Constraining the atmospheric N2O budget from intramolecular site preference in N2O isotopomers[J]. Nature, 2000, 405 (6784): 330-334.
[27]Toyoda S, Yoshida N. Determination of nitrogen isotopomers of nitrous oxide on a modified isotope ratio mass spectrometer[J]. Analytical Chemistry, 1999, 71(20): 4711-4718.
[28]Yoshida N.15N-depleted N2O as a product of nitrification[J]. Nature, 1988, 335(6190): 528-529.
[29]Ostrom N E, Pitt A, Sutka R,etal. Isotopologue effects during N2O reduction in soils and in pure cultures of denitrifiers[J]. Journal of Geophysical Research -Biogeosciences, 2007, 112 (G2): 346-358.
[30]Skiba U, Mctaggart I P, Smith K A,etal. Estimates of nitrous oxide emissions from soil in the UK[J]. Energy Conversion and Management, 1996, 37(6-8): 1303-1308.
[31]Thomson P E, Parker J P, Arah J,etal. Automated soil monolith-flux chamber system for the study of trace gas fluxes[J]. Soil Science Society of America Journal, 1997, 61(5): 1323-1330.
[32]Yamulki S, Wolf I, Bol R,etal. Effects of dung and urine amendments on the isotopic content of N2O released from grasslands[J]. Rapid Communications in Mass Spectrometry, 2000, 14(15): 1356-1360.
[33]Rowlings D W, Grace P R, Kiese R,etal. Environmental factors controlling temporal and spatial variability in the soil-atmosphere exchange of CO2, CH4and N2O from an Australian subtropical rainforest[J]. Global Change Biology, 2012, 18(2): 726-738.
[34]Dobbie K E, Smith K A. Nitrous oxide emission factors for agricultural soils in Great Britain: the impact of soil water-filled pore space and other controlling variables[J]. Global Change Biology, 2003, 9(2): 204-218.
[35]Velthof G L, van Groenigen J W, Gebauer G,etal. Temporal stability of spatial patterns of nitrous oxide fluxes from sloping grassland[J]. Journal of Environmental Quality, 2000, 29(5): 1397-1407.
[36]Gao B, Ju X, Su F,etal. Nitrous oxide and methane emissions from optimized and alternative cereal cropping systems on the North China Plain: a two-year field study[J]. Science of the Total Environment, 2014, 472: 112-124.
[37]Wang Y, Hu C, Ming H,etal. Methane, carbon dioxide and nitrous oxide fluxes in soil profile under a winter wheat-summer maize rotation in the North China Plain[J]. Plos One, 2014, 9(6): e98445.
[38]Diao T, Xie L, Guo L,etal. Measurements of N2O emissions from different vegetable fields on the North China Plain[J]. Atmospheric Environment, 2013, 72(2): 70-76.
[39]Zhang Y, Liu J, Mu Y,etal. Nitrous oxide emissions from a maize field during two consecutive growing seasons in the North China Plain[J]. Journal of Environmental Sciences, 2012, 24(1): 160-168.
[40]Andrews T, Gregory J, Forster P,etal. Cloud adjustment and its role in CO radioactive forcing and climate sensitivity: a review[J]. Surveys in Geophysics, 2012, 33(3-4): 619-635.
[41]Kool D M, Muller C, Wrage N,etal. Oxygen exchange between nitrogen oxides and H2O can occur during nitrifier pathways[J]. Soil Biology and Biochemistry, 2009, 41(8): 1632-1641.
[42]Dundee L, Hopkins D W. Different sensitivities to oxygen of nitrous oxide production by Nitrosomonas europaea and Nitrosolobus multiformis[J]. Soil Biology and Biochemistry, 2001, 33(11): 1563-1565.
[43]Kendall C, Doctor D H, Young M B. 7.9 - Environmental isotope applications in hydrologic studies[A]. Turekian H D H K, Treatise on Geochemistry (Second Edition)[C]. Oxford: Elsevier, 2014. 273-327.
[44]Bateman E J, Baggs E M. Contributions of nitrification and denitrification to N2O emissions from soils at different water-filled pore space[J]. Biology and Fertility of Soils, 2005, 41(6): 379-388.
[45]Bol R, Toyoda S, Yamulki S,etal. Dual isotope and isotopomer ratios of N2O emitted from a temperate grassland soil after fertilizer application[J]. Rapid Communications in Mass Spectrometry, 2003, 17(22): 2550-2556.

[47]Jinuntuya-Nortman M, Sutka R L, Ostrom P H,etal. Isotopologue fractionation during microbial reduction of N2O within soil mesocosms as a function of water-filled pore space[J]. Soil Biology and Biochemistry, 2008, 40(9): 2273-2280.
Preliminary research on N2O sampling time based on isotopomer signature measurement of vegetable fields in the North China Plain
FANG Fu-li, LI Yu-zhong*
(InstituteofEnvironmentandSustainableDevelopmentinAgriculture,ChineseAcademyofAgriculturalSciences,Beijing100081,China)
【Objectives】 Emissions of N2O from vegetable soils are extremely variable in time and therefore there are considerable uncertainties in calculating emission of N2O flux and emission coefficients. It is thus important to investigate the optional sampling time and characteristic of diurnal pattern for N2O. More insights into N2O diurnal variation would also be helpful for long term monitoring of N2O release and for understanding the associated microbiological mechanisms.【Methods】 Field experiment in situ was conducted to study N2O emission after urine amendment and subsequent irrigation for a lettuce production system in North China Plain in 2012. During periods of high N2O fluxes in 5-6 days, N2O emission was collected manually by a closed static flux chamber at two intervals, two hours for diurnal variation and 10 minutes for appropriate enclosure period. N2O concentrations were measured by a gas chromatograph equipped with an electron capture detector (GC-ECD), and isotopomers such as δ15N-N2O, δ18O-N2O and site preference (SP) (difference between the center and the end N atom of the N2O asymmetric molecule) were analyzed and obtained by an elemental analyzer-isotope ratio mass spectrometer(EA-IRMS) system.【Results】 1) During the period of high N2O emission,there was a strong diurnal variation in N2O fluxes ranging from 20.41 to 130.45 μg/(m2·h), with the maximum and minimum values being observed at 1 pm in Apr. 27thand 5 am in Apr. 28th, respectively. Flux measured at 9 am could be used to represent the daily average of the whole day. The fluxes of N2O emitted from the soil were correlated significantly(R2=0.82,P<0.01) with the soil temperature at 5 cm, varied markedly across time, but insignificantly with water filled-pore space (WFPS). 2) Diurnally, the values of δ15Nbulk-N2O and δ18O-N2O decreased first and then increased gradually with time while the values of SP had an opposite trend, suggesting that production processes of N2O were associated with different microbial pathways. Conversely, the stable values of SP of N2O from 9 am through 5 pm indicated that nitrification was the dominant pathway for N2O production. 3) In measuring N2O emission, appropriate enclosure period in the static chamber should be 40 minutes, which was long enough to allow detection of N2O concentration, δ15N-N2O and SP and also short enough to avoid feedback of N2O concentration and microbial pathway change. 4) The calculated emission-weighted site preference was 22.54‰. The N2O emission in this study was dominantly produced from nitrification, contributing 60.9% of the daily totals of N2O emission.【Conclusions】 There were large diurnal variations of N2O concentration and isotopomers from lettuce production system in North China Plain. Considering both values of N2O flux and isotopomers, it was suggested that 9 am was an appropriate time to measure the flux and isotopomer signature of N2O and that enclosure period for one sample event should be 40 minutes.
N2O flux; δ15N-N2O; δ18O-N2O; SP; diurnal variation
2015-03-16接受日期: 2015-06-14网络出版日期: 2015-06-29
国家自然科学基金(41473004); 国家科技支撑计划项目(2011BAD32B03); 国家自然科学基金项目(41301553); 中央级公益性科研院所基本业务费项目(BSRF201304)资助。
房福力(1985—), 男, 山东青岛人, 博士, 主要从事植物营养与环境研究。 E-mail: fulifangfu@163.com
E-mail: liyuzhong@caas.cn
S153.6+1
A
1008-505X(2016)04-0978-10
猜你喜欢
数学小灵通·3-4年级(2022年5期)2022-12-31
农业灾害研究(2022年1期)2022-05-07
数学小灵通·3-4年级(2021年5期)2021-07-16
环境卫生工程(2021年1期)2021-03-19
读友·少年文学(清雅版)(2020年10期)2020-03-19
同位素(2018年1期)2018-01-18
农业环境科学学报(2017年2期)2017-03-20
同位素(2014年3期)2014-06-13
同位素(2014年2期)2014-04-16
同位素(2014年2期)2014-04-16