什么是概率地震危险性评估的基本假设?*
2016-08-15 08:10JohnAndersonGlennBiasi
地震科学进展 2016年7期
John G Anderson, Glenn P Biasi
(Nevada Seismological Laboratory, University of Nevada, Mail Stop 174,Reno, Nevada 89557 USA)
什么是概率地震危险性评估的基本假设?*
John G Anderson, Glenn P Biasi
(Nevada Seismological Laboratory, University of Nevada, Mail Stop 174,Reno, Nevada 89557 USA)
摘要概率地震危险性分析(Probabilistic Seismic Hazard Analysis, PSHA)的目的是表现场点处所有地震动的发生频率。 其基本假设是用真实存在的危险性曲线来表达场点处任一地震动振幅的超越频率。 在程序上, PSHA依赖于对地震活动与地面运动模型相结合的完整且准确的描述, 并采用标准概率方法去评估危险性曲线。 改进输入参数和识别并解决观测数据与估算危险性之间的差异,可以实现对危险性曲线的改进。 然而, 这种差异并不能否定危险性曲线的存在或者用于估算该曲线的概率理论。
Wyss[1]在其文章 “测试概率地震危险性评估的基本假设: 11次失败”(Testing the basic assumption for probabilistic seismic hazard sssessment: 11 failures)中指出, 用古登堡-里克特模型(Gutenberg-Richter, 即G-R)对小震发生率进行外推来估算大震发生率是不可靠[2]。 这使我们意识到, 在进行概率地震危险性分析时, 这种外推可能会导致对地震危险性的低估。

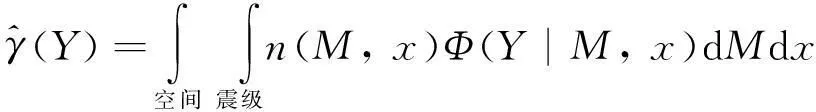
理论上讲, 可以利用目标场地配置的观测仪器获得危险性曲线。 由微震和远震产生的极弱震动每天都会发生, 弱震动(如, 峰值加速度Y=1 cm/s2)比强震动(如, 峰值加速度Y=100 cm/s2)发生的更频繁。 将地震动Yi的观测目录排序并绘制曲线, 来计算任意水平Y被超越的次数。 然后根据观测资料的时间长度将曲线分段, 就会得到实验阶段任一观测值Y的超越频率。 这个超越频率是基于观测资料γ(Y)的估值。 该过程类似于寻找G-R关系, 获得震级M的超越频率N(M)。
我们坚持认为, 估算危险性曲线的过程是对存在危险性曲线这一基本假设的有力支撑。 例如, 图1是由加利福尼亚(California)一个台站的强震动数据得到的经验危险性曲线。 该台站已经运行了很长时间, 而且有多种强震动记录。
由于PSHA是工程学的一个工具, 且小震一般不会毁坏工程结构, 因此, 对现代建筑物关系最大的危险性曲线通常只涉及MW≥5.0地震产生的地震动。 通过对观测资料的筛选, 很容易在上述实验中考虑这个条件。
(1)


图1用3种方法估算的埃尔森特罗(ElCentro)台阵9强震仪的危险性曲线。 工程强震动数据中心(CenterforEngineeringStrongMotionData)的资料显示, 该台站至少在1934年就开始运行了。 表1列出了该台站的加速度记录, 这些记录包含在NGA-West2Flatfile中, 它们是经验曲线的基础。 因为经验危险性曲线假设所有的重要地震都被记录, 因此, 我们也采用了Milne和Davenport的方法[19], 并使用了Abrahamson等[6](ASK14)的地震动预测方程(GMPE)评估每次地震对场点产生的峰值加速度。 其中, 地震目录使用距离场点300km范围内Mw≥5且去除余震的地震目录(美国地质调查局)。 对场点有地震动贡献的地震越多, 就越突出了获得一个完整经验振动记录的困难。 第3种方法采用根据VS30调整的2014年美国地质调查局的国家地震灾害模型[20]。 考虑到时间间隔较短, 3种方法得到的危险性曲线不可能相同。 年超越频率约为4×10⁻⁴(约为2500年一次)的水平线即为应用于美国普通建筑物抗震设计的危险性图中的发生频率等值线。 该值远低于实验测量的能力, 因此, 美国地质调查局采用的年超越频率是公式(1)的估值
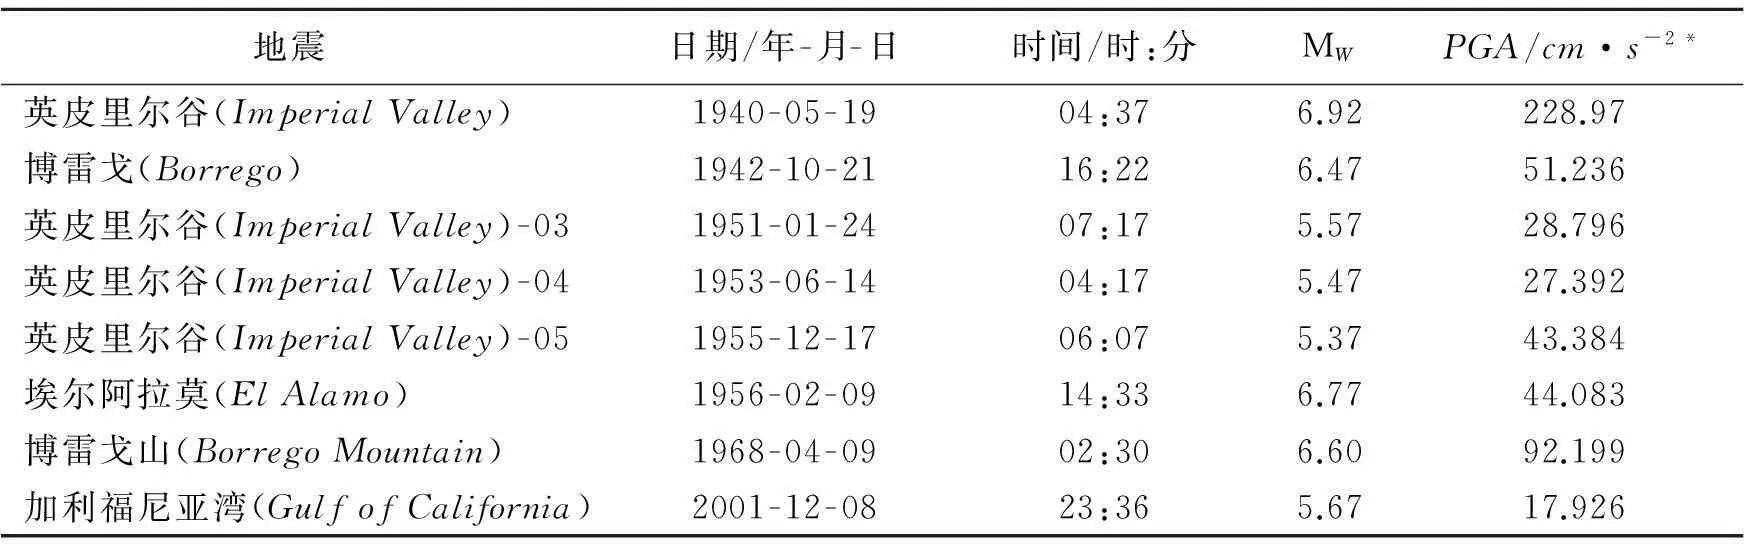
表1 埃尔森特罗台阵9强震动记录(来自NGA-West 2 Flatfile数据库)
*PGA为峰值地面加速度


(2)
有些地区, 如美国东部和加拿大的大部分地区, 无法识别活动断裂, 无法区分大地形变速率与零等值线, 没有发现古地震标志(如, 古液化), 而且也不知道控制地震发生率的过程[38-39]。 如果可用来评估地震活动性n(M,x)的资料只有历史地震和仪器记录的地震, 那么估算罕见破坏性地震发生率的唯一方法就是外推法。 而在其他地方, 如果存在形变率或者其他地质学的约束条件, PSHA就应该考虑这些资料。
为了使生成的地震子目录的个数具有统计上的独立性, 许多PSHA程序进行了余震的删除。 事实上, 余震的删除只是一个小细节, 不会影响危险性曲线的存在。
无论是对局部还是对系统的误差识别, 都是改进地震危险性分析的必要部分。 但是, 尽管一些已经发表的有关PSHA的研究在很大程度上遭到批判, 认为其所依赖的震源模型和地震动预测方程是不适当的, 但是, 这些研究并不能否定作为PSHA基本假设的危险性曲线的存在及其作用。
数据来源: NGA-West 2 Flatfile 中强震动参数来自太平洋地震工程研究中心(Pacific Earthquake Engineering Research Center, PEER, http:∥peer.berkeley.edu/ngawest/nga_models.html, 2015年12月最后一次访问)。 使用Milne和Davenport方法计算美国西部危险性曲线的去除余震的地震目录来自美国地质调查局(U.S. Geological Survey, USGS)的名为2014_wmm.c4的地震目录(http:∥earthquake.usgs.gov/hazards/products/conterminous/, 2015年12月最后一次访问)。 图1展示的美国地质调查局的危险性曲线中使用的数据来自美国地质调查局地震危险性项目(USGS Earthquake Hazards Program, http:∥earthquake.usgs.gov/hazards/products/conterminous/2014/data/, 2015年12月最后一次访问)。
文献来源: John G Anderson, Glenn P Biasi. What is the basic assumption for probabilistic seismic hazard assessment?. Seismol. Res. Lett., 2016, 87(2A): 323-326
(中国地震局地壳应力研究所刘静伟译)
(译者电子信箱, 刘静伟: ljingwei@163.com)
参 考 文 献
[1] Wyss M. Testing the basic assumption for probabilistic seismic hazard assessment: 11 failures. Seismol. Res. Lett., 2015, 86(5): 1405-1411
[2] Wesnousky S G. The Gutenberg-Richter distribution or characteristic earthquake distribution: which is it? Bull. Seismol. Soc. Amer., 1994, 84(6): 1940-1959
[3] McGuire R K. Seismic Hazard and Risk Analysis. Earthquake Engineering Research Institute. Oakland, California, 2004: 221
[4] Atkinson G M, Macias M. Predicted ground motions for great interface earthquakes in the Cascadia subduction zone. Bull. Seismol. Soc. Amer., 2009, 99(3): 1552-1578
[5] Pezeshk S, Zandieh A, Tavakoli B. Hybrid empirical ground-motion prediction equations for eastern North America using NGA models and updated seismological parameters. Bull. Seismol. Soc. Amer., 2011, 101(4): 1859-1870
[6] Abrahamson N A, Silva W J, Kamai R. Summary of the ASK14 ground motion relation for active crustal regions. Earthq. Spectra, 2014, 30(3) : 1025-1055
[7] Boore D M, Stewart J P, Seyhan E, et al. NGA-West2 equations for predicting PGA, PGV, and 5% damped PSA for shallow crustal earthquakes. Earthq. Spectra, 2014, 30(3): 1057-1085
[8] Campbell K W, Bozorgnia Y. NGA-West2 ground motion model for the average horizontal components of PGA, PGV, and 5%-damped linear acceleration response spectra. Earthq. Spectra, 2014, 30(3): 1087-1115
[9] Chiou B S J, Youngs R R. Update of the Chiou and Youngs NGA ground motion model for Rezaeian et al.: 25 average horizontal component of peak ground motion and response spectra. Earthq. Spectra, 2014, 30(3): 1117-1153
[10] Graves R W, Jordan T H, Callaghan S, et al. CyberShake: A physics-based seismic hazard model for southern California. Pure Appl. Geophys., 2011, 168(3): 367-381
[11] Goulet C A, Bozorgnia Y, Abrahamson N A. Introduction, in NGA-East: Median ground-motion models for the central and eastern North America region, PEER Report No. 2015/04, http:∥peer.berkeley.edu/publications/peer_reports/reports_2015/webPEER-2015-04-NGA-East.pdf (last accessed January 2016), 2014
[12] Beauval C, Bard P -Y, Hainzl S, et al. Can strong-motion observations be used to constrain probabilistic seismic-hazard estimates? Bull. Seismol. Soc. Amer., 2008, 98(2): 509-520
[13] Mak S, Clements R A, Schorlemmer D. The statistical power of testing probabilistic seismic-hazard assessments. Seismol. Res. Lett., 2014, 85(4): 781-783
[14] Marzocchi W, Jordan T H. Testing for ontological errors in probabilistic forecasting models of natural systems. Proc. Natl. Acad. Sci., 2014, 111(33): 11973-11978
[15] Ordaz M, Reyes C. Earthquake hazard in Mexico City: Observations versus computations. Bull. Seismol. Soc. Amer., 1999, 89(5): 1379-1383
[16] Stirling M, Gerstenberger M. Ground motion-based testing of seismic hazard models in New Zealand. Bull. Seismol. Soc. Amer., 2010, 100(4), 1407-1414
[17] Stirling M, Petersen M. Comparison of the historical record of earthquake hazard with seismic-hazard models for New Zealand and the continental United States. Bull. Seismol. Soc. Amer., 2006, 96(6): 1978-1994
[18] Mezcua J, Rueda J, García Blanco R M. Observed and calculated intensities as a test of a probabilistic seismic-hazard analysis of Spain. Seismol. Res. Lett., 2013, 84(5): 772-780
[19] Milne W G, Davenport A G. Distribution of earthquake risk in Canada. Bull. Seismol. Soc. Amer., 1969, 59(2): 729-754
[20] Petersen M D, Moschetti M P, Powers P M, et al. Documentation for the 2014 update of the United States national seismic hazard maps, U.S. Geol. Surv. Open-File Rept. 2014-1091, 2014: 243. doi:10.3133/ofr20141091
[21] Brune J N. Precariously balanced rocks and ground-motion maps for southern California. Bull. Seismol. Soc. Amer., 1996, 86(1): 43-54
[22] Baker J W, Abrahamson N A, Whitney J W, et al. Use of fragile geologic structures as indicators of unexceeded ground motions and direct constraints on probabilistic seismic hazard analysis. Bull. Seismol. Soc. Amer., 2013, 103(3): 1898-1911
[23] Anderson J G, Biasi G P, Brune J N. Precarious rocks: Providing upper limits on past ground shaking from earthquakes, in Earthquake Hazard, Risk and Disasters, Wyss M(Editor), Elsevier, London, United Kingdom, 2014: 377-403
[24] Field E H. “All models are wrong, but some are useful” . Seismol. Res. Lett. 2015, 86(2A): 291-293. doi:10.1785/02201401213
[25] Allen C R. Geological criteria for evaluating seismicity. Geol. Soc. Amer. Bull., 1975, 86(8): 1041-1057
[26] Wallace R E. Seismicity of north-central Nevada on the basis of young fault scarps, abstract. Earthq. Notes, 1976, 47(1): 21-22
[27] Anderson J G. Estimating the seismicity from geological structure for seismic risk studies. Bull. Seismol. Soc. Amer., 1979, 69(1): 135-158
[28] Molnar P. Earthquake recurrence intervals and plate tectonics. Bull. Seismol. Soc. Amer., 1979, 69(1): 115-133
[29] Schwartz D P, Coppersmith K J. Fault behavior and characteristic earthquakes: Examples from the Wasatch and San Andreas fault zones. J. Geophys. Res., 1984, 89(B7): 5681-5698
[30] Field E H, Page M T. Estimating earthquake-rupture rates on a fault or fault system. Bull. Seismol. Soc. Amer., 2011, 101(1): 79-92
[31] Wesnousky S G. Earthquakes, Quaternary faults and seismic hazard in California. J. Geophys. Res., 1986, 91(B12): 12587-12631
[32] Frankel A, Mueller C, Barnhard T, et al. National seismic hazard maps: Documentation June 1996, U.S. Geol. Surv. Open-File Rept. 96-532, 1996: 110
[33] Frankel A D, Petersen M D, Mueller C S, et al. Documentation for the 2002 update of the national seismic hazard maps, U.S. Geol. Surv. Open-File Rept. 2002-420, 2002: 39
[34] Stepp J C, Wong I, Whitney J, et al. Probabilistic seismic hazard analyses for ground motion and fault displacement at Yucca Mountain, Nevada. Earthq. Spectra, 2001, 17(1): 113-151
[35] Stirling M W, McVerry G H, Berryman K R. A new seismic hazard model for New Zealand. Bull. Seismol. Soc. Amer., 2002, 92(5): 1878-1903
[36] Petersen M D, Frankel A D, Harmsen S C, et al. Documentation for the 2008 update of the United States national seismic hazard maps, U.S. Geol. Surv. Open-File Rept. 2008-1128, 2008: 128
[37] Field E H, Arrowsmith R J, Biasi G P, et al. Uniform California earthquake rupture forecast, Version 3 (UCERF3): The time independent model. Bull. Seismol. Soc. Amer., 2014, 104(4): 1122-1180
[38] Leonard M, Clark D. A record of stable continental region earthquakes from Western Australia spanning the late Pleistocene: Insights for contemporary seismicity. Earth Planet. Sci. Lett., 2011, 309(3): 207-212
[39] Wolin E, Stein S, Pazzaglia F, et al. Mineral, Virginia, earthquake illustrates seismicity of a passive-aggressive margin. Geophys. Res. Lett., 2012, 39(2), L02305. doi:10.1029/2011GL050310
[40] Anderson J G, Brune J N. Probabilistic seismic hazard assessment without the ergodic assumption. Seismol. Res. Lett., 1999, 70(1): 19-28
[41] Bommer J J, Abrahamson N A. Why do modern probabilistic seismic-hazard analyses often lead to increased hazard estimates? Bull. Seismol. Soc. Amer., 2006, 96(6): 1967-1977
[42] Yagoda-Biran G, Anderson J G. Investigation of the ground-motion variability associated with site response for sites withVS30over 500 m/s. Bull. Seismol. Soc. Amer., 2015, 105(2A): 1011-1028. doi:10.1785/0120140224
[43] Atkinson G M. Single-station sigma. Bull. Seismol. Soc. Amer., 2006, 96(2): 446-455
[44] Rodriguez-Marek A, Cotton F, Abrahamson N A, et al. A model for single-station standard deviation using data from various tectonic regions. Bull. Seismol. Soc. Amer., 2013, 103(6): 3149-3163. doi:10.1785/0120130030
* 收稿日期:2016-04-14; 采用日期: 2016-05-25。
中图分类号:P315.9;
文献标识码:A;
doi:10.3969/j.issn.0235-4975.2016.07.006
猜你喜欢
西部探矿工程(2022年11期)2023-01-18
化学工业与工程(2022年1期)2022-03-29
小资CHIC!ELEGANCE(2021年36期)2021-10-15
有色设备(2021年4期)2021-03-16
科学大众(2020年12期)2020-08-13
文萃报·周二版(2020年23期)2020-06-19
中国特种设备安全(2019年10期)2020-01-04
中国公路(2017年18期)2018-01-23
西安建筑科技大学学报(自然科学版)(2014年4期)2014-11-12