Strengthened African Summer Monsoon in the Mid-Piacenzian
Ran ZHANG,ZhongshiZHANG,Dabang JIANG,Qing YAN,Xin ZHOU,and Zhigang CHENG
1Climate Change Research Center,Chinese Academy of Sciences,Beijing100029
2Department of Atmospheric Science,School of Environmental Studies,China University of Geosciences,Wuhan430074
3Nansen-Zhu International Research Centre,Institute of Atmospheric Physics,Chinese Academy of Sciences,Beijing100029
4Bjerknes Centre for Climate Research,UniResearch,Bergen5007,Norway
5School of Earth and Space Sciences,University of Science and Technology of China,Hefei230026
6Plateau Atmosphere and Environment Key Laboratory of Sichuan Province,College of Atmospheric Sciences, Chengdu University of Information Technology,Chengdu610225
Strengthened African Summer Monsoon in the Mid-Piacenzian
Ran ZHANG∗1,ZhongshiZHANG2,3,4,Dabang JIANG1,3,Qing YAN3,Xin ZHOU5,and Zhigang CHENG6
1Climate Change Research Center,Chinese Academy of Sciences,Beijing100029
2Department of Atmospheric Science,School of Environmental Studies,China University of Geosciences,Wuhan430074
3Nansen-Zhu International Research Centre,Institute of Atmospheric Physics,Chinese Academy of Sciences,Beijing100029
4Bjerknes Centre for Climate Research,UniResearch,Bergen5007,Norway
5School of Earth and Space Sciences,University of Science and Technology of China,Hefei230026
6Plateau Atmosphere and Environment Key Laboratory of Sichuan Province,College of Atmospheric Sciences, Chengdu University of Information Technology,Chengdu610225
(Received 19 September 2015;revised 15 April 2016;accepted 16 May 2016)
Using model results from the first phase of the Pliocene Model Intercomparison Project(PlioMIP)and four experiments with CAM4,the intensified African summer monsoon(ASM)in the mid-Piacenzian and corresponding mechanisms are analyzed.The results from PlioMIP show that the ASM intensified and summer precipitation increased in North Africa during the mid-Piacenzian,which can be explained by the increased net energy in the atmospheric column above North Africa.Further experiments with CAM4 indicated that the combined changes in the mid-Piacenzian of atmospheric CO2concentration and SST,as well as the vegetation change,could have substantially increased the net energy in the atmospheric column over North Africa and further intensified the ASM.The experiments also demonstrated that topography change had a weak e ff ect.Overall,the combined changes of atmospheric CO2concentration and SST were the most important factor that brought about the intensified ASM in the mid-Piacenzian.
PlioMIP,mid-Piacenzian,African summer monsoon,vegetation change
1. Introduction
The mid-Piacenzian(3.264–3.025 Ma)was the last geological period in Earth’s history when the global average temperature was 1.84°C–3.60°C warmer than the pre-industrial period(Haywood et al.,2013).Also,the atmospheric CO2concentration and paleogeography were comparable to those of today(Dowsett et al.,2010).To a certain extent,the climate of the mid-Piacenzian is re fl ective of the warmer climate predicted for Earth’s near future(Sun et al.,2013).In this regard,the mid-Piacenzian has long been a focus for climate modelling studies(e.g.,Chandler et al.,1994;Sloan et al.,1996;Haywood and Valdes,2004;Jiang et al.,2005). In particular,following the initiation of phase one of the Pliocene Model Intercomparison Project(PlioMIP),involving standardized designs for its simulations(Haywood et al., 2010,2011),an increasing number of new findings have been achieved from model–model and model–data comparisons (Haywood et al.,2013;Zhang et al.,2013a;Hill et al.,2014; Liet al.,2015).
To date,studies based on PlioMIP have focused on the large-scale climate and/or the climate in the northern high latitudes.For example,Haywood et al.(2013)revealed the large-scale features of the simulated mid-Piacenzian climate and reported that models potentially underestimate the temperature at high latitudes.Dowsett et al.(2013)presented a systematic comparison of simulated SST with the PRISM3 (Pliocene Research,Interpretation and Synoptic Mapping) data,and found that the model results were in good agreement with estimates of mid-Piacenzian SST in most regions, although the PlioMIP models generally underestimated the warming in the North Atlantic.The remarkable warming in the North Atlantic in the mid-Piacenzian was once explained by a stronger Atlantic Meridional Overturning Circulation(AMOC)and Atlantic enhanced northward heat transport(e.g.,Dowsett et al.,2009).However,the models of PlioMIP do not produce a stronger AMOC;plus,they simulate similar Atlantic northward heat transport to the preindustrial level(Zhang et al.,2013b).Hill et al.(2014)evaluated the causes of the Pliocene atmospheric warming using energy balance calculations,and found that the specified ice sheet,high-latitude vegetation boundary conditions and sea ice/snow albedo feedbacks played very important roles in the warming at high latitudes.
In addition to the global or high-latitude climate,the tropical climate has also been investigated in the PlioMIP models.Brierley(2015)recently found that the PlioMIP ensemble shows unexpected agreement in reducing variability and shifting to lower frequencies of ENSO.Besides,the simulated mid-Piacenzian Walker circulation generally slows and the Hadley cell widens poleward(Kamae et al.,2011;Sun et al.,2013).
Despite being an important sub-system of the tropical climate,the(West)Africa monsoon,which in fl uences the lives of the human population in climate-sensitive North Africa, has not yet been investigated in PlioMIP.Today,most of North Africa is occupied by the largest non-polar desert,the Sahara(~9 400 000 km2),which started to form around 7–11 Ma(Zhang et al.,2014)and has expanded greatly during the last 2 or 3 Ma(Kroepelin et al.,2006).In the mid-Piacenzian, compared to present,the Sahara shrank due to the expansion of tropical savanna and woodland in North Africa,likely indicative of an intensified Africa summer monsoon(ASM) (Kutzbach and Liu,1997;Zhang et al.,2014).
In this study,we analyze PlioMIP simulation results to examine the characteristics of the ASM in the mid-Piacenzian.Furthermore,using CAM4,we highlight the importance of diff erent boundary conditions to the ASM intensity.
The remainder of the paper is organized as follows:In section 2,we brie fl y describe the PlioMIP models used and the experimental design of the CAM4 experiments.In section 3,we present the model results,including the PlioMIP-simulated ASM and the contributions to the ASM changes based on the CAM4 simulations.Section 4 presents the discussion,and section 5 summarizes the study’s key findings.
2. Models and experimental design
This study begins by analyzing atmosphere-only simulations from seven AGCMs,and coupled simulations from nine PlioMIP AOGCMs(Table 1).Each model carried out one pre-industrial control experiment and one mid-Piacenzian experiment.In the mid-Piacenzian experiment,PRISM3 data were used as the boundary conditions,including the modification of orography,land cover,and the increase in atmospheric CO2concentration(from 280 ppm to 405 ppm)in the AOGCMs,as well as the SST and sea ice in the AGCMs, comparedwiththepre-industrialexperiment(Haywoodetal., 2010,2011).Considering the models use diff erent resolutions,we re-gridded all the model results to the same resolution of 2.5°×2.5°to carry out the multi-model analysis.
In addition,four experiments were carried out with CAM4 to investigate the climate sensitivity to boundary conditions(Table 2).The horizontal resolution of F09[roughly 0.9°(lat)×1.25°(lon)]was adopted,and there were 26 layers in the vertical direction(Neale et al.,2013).This high resolution of CAM4 is able to simulate the large-scale pattern of the modern ASM reasonably well(Cook et al.,2012;Neale et al.,2013),and shows improvements in simulated precipitation,compared with the low resolution version,because of better resolved topography(Shields et al.,2012).Version 4 of theCommunityLandModel(CLM4)wasalsoincludedinthe simulations(Lawrence et al.,2011).More information about CAM4 and CLM4 can be found in model validation studies in the literature(Shields et al.,2012;Neale et al.,2013).
We ran the experiments from the pre-industrial period (PI)and step-by-step replaced the topography,vegetation and the combined changes of atmospheric CO2concentration and SST with mid-Piacenzian boundary conditions using PRISM3 data(Haywood et al.,2010),in order to address how these boundary conditions a ff ected the climate in North Africa(Fig.1).Aside from the Picontrol experiment,topography was changed in experiment PIt,vegetation was changed in experiment PItv,and finally the atmospheric CO2concentration and SST were further changed in the mid-Piacenzian experiment(MP).All experiments were integrated for 30 years,and all reached a quasi-equilibriumstate within the first 10 years.The climatological means from the last 20 years in each experiment are analyzed here,with a focus on the model results in boreal summer(June,July and August).
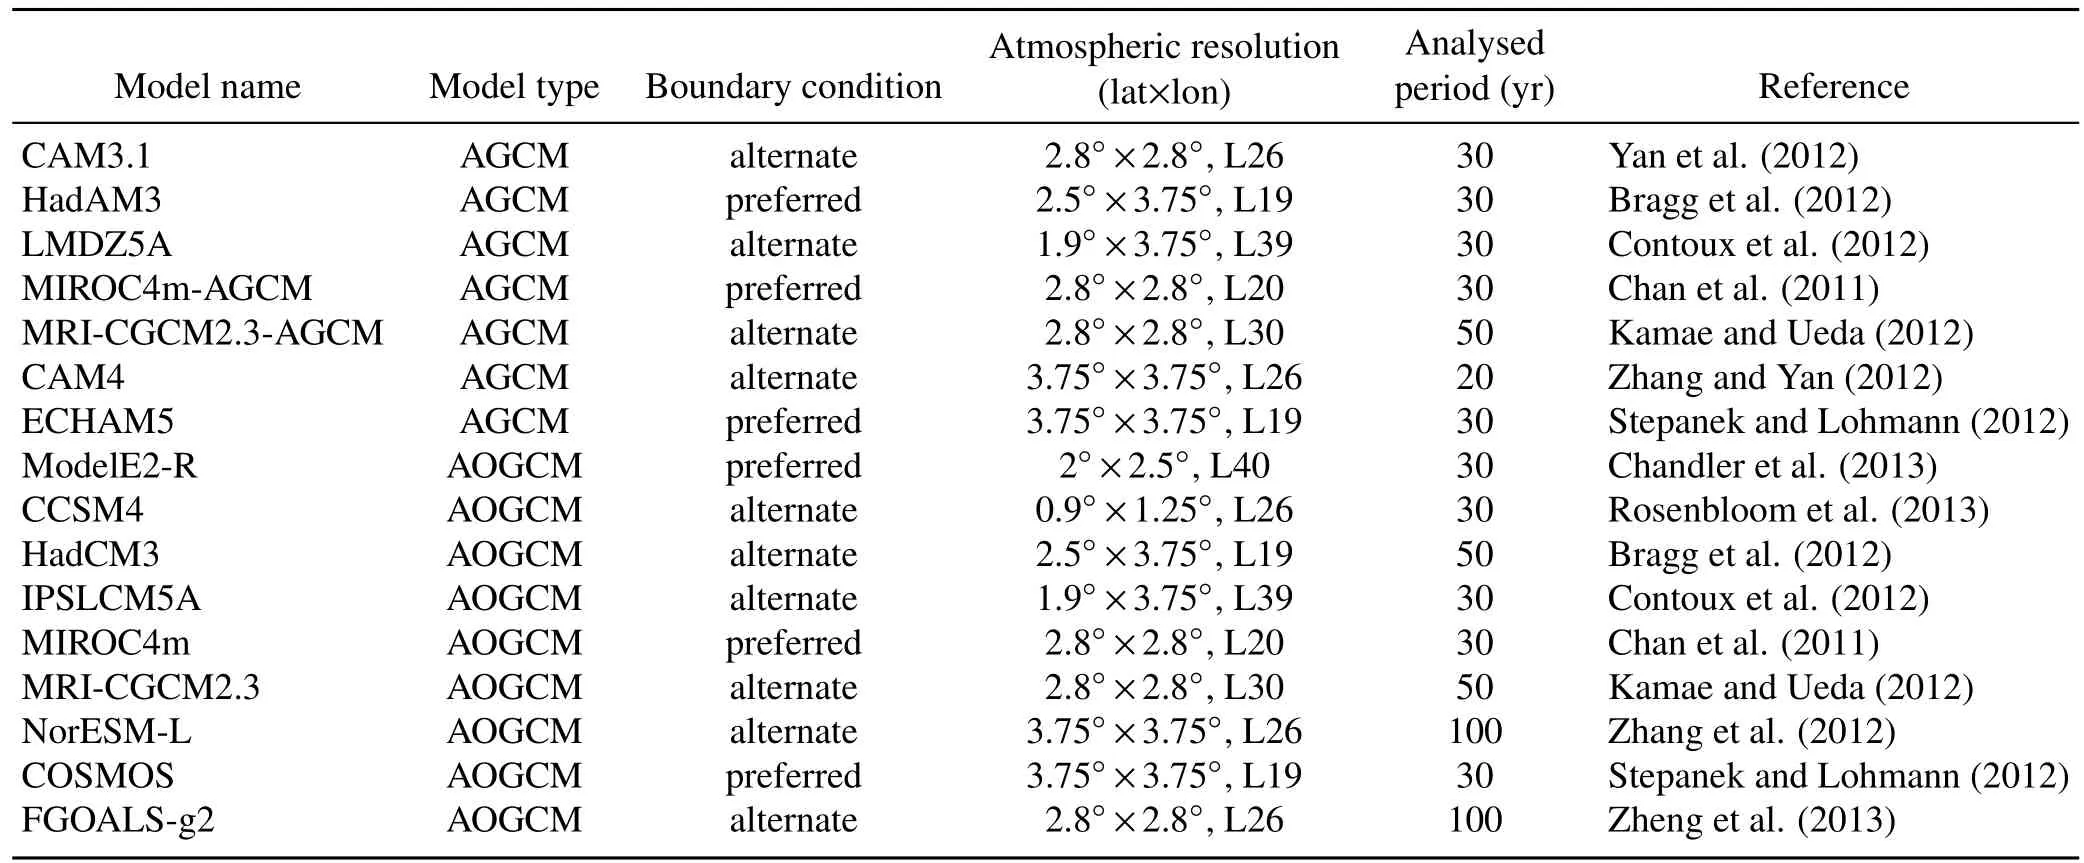
Table 1.Basic information regarding the PlioMIP simulations used in this study.

Table 2.Experimental design using CAM4.“Plio”stands for mid-Piacenzian conditions,and“Mod”stands for pre-industrial or modern conditions.
3.Results
3.1. PlioMIP-simulated ASM
In the PlioMIP simulations,the ASM became stronger and brought more precipitation to North Africa during the mid-Piacenzian.The multi-model ensemble mean(MMM) of all the models,with the same weight among models, showed that the summer westerly wind in North Africa became stronger during the mid-Piacenzian relative to the preindustrial(Fig.2a).Summer precipitation increased by more than 1 mm d-1in North Africa,particularly between~10°and~20°N(Fig.2a).Generally,precipitationchangeinNorth Africa comes from two major moisture sources—moisture advection and local recycling(Bosmans et al.,2012),which is measured by the ratio of the diff erence between the precipitation and evaporation anomaly to the precipitation anomaly: (ΔP-ΔE)/ΔP,PandEdenote precipitation and evaporation.In the region(10°–20°N,10°W–40°E),approximately 55%of the regional averaged precipitation increase between the mid-Piacenzian and the pre-industrial was due to moisture advection from the tropical Atlantic,and the remaining part was caused by local recycling.Since the moisture advection in this region derived mainly from the intensified ASM, the increased summer precipitation in North Africa likely derived more from the intensified ASM.Along with the intensified ASM and increased precipitation,both the North African monsoon domain(Wang et al.,2012)and the ITCZ(Braconnot et al.,2007)shifted northward during the mid-Piacenzian (Figs.2a and 3a).
The intensified ASM was caused by increased net energy in the atmospheric column above North Africa.The MMMindicated that the net energy above North Africa increased significantly(Fig.4a)because of the marked increase in net heat fl ux at the model top.This increase in net energy promoted anomalous low-level atmospheric convergence(Fig. 2a)over North Africa(Chou and Neelin,2003;Zhang et al., 2014).As a result,moist air fl ow from the ocean penetrated farther inland,which strengthened the ASM and promoted the summer precipitation increase in North Africa(Fig.2a).

Fig.1.The diff erence in(a)topography(units:m),(b)summer surface albedo,(c)summer SST(units:°C),and(d) winter SST(units:°C)between the experiment MP and Piusing CAM4.The region indicated by the red box in(a)was selected for the diagnosis in Table 3.
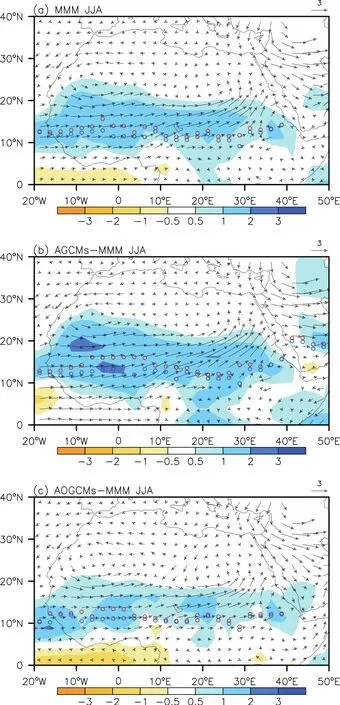
Fig.2.Diff erence in the MMM for summer 850-hPa wind(vectors;units:ms-1)andprecipitation(shaded;units:mmd-1)between the mid-Piacenzian and pre-industrial experiments from PlioMIP simulations:(a)is the MMM for all the models; (b)is the MMM for the AGCMs;and(c)is the MMM for the AOGCMs.Regions with an elevation above 1500 m for winds are left blank.The red(mid-Piacenzian)and blue(preindustrial)dots show the positions of the climatological mean ITCZ,as de fined by Braconnot et al.(2007).
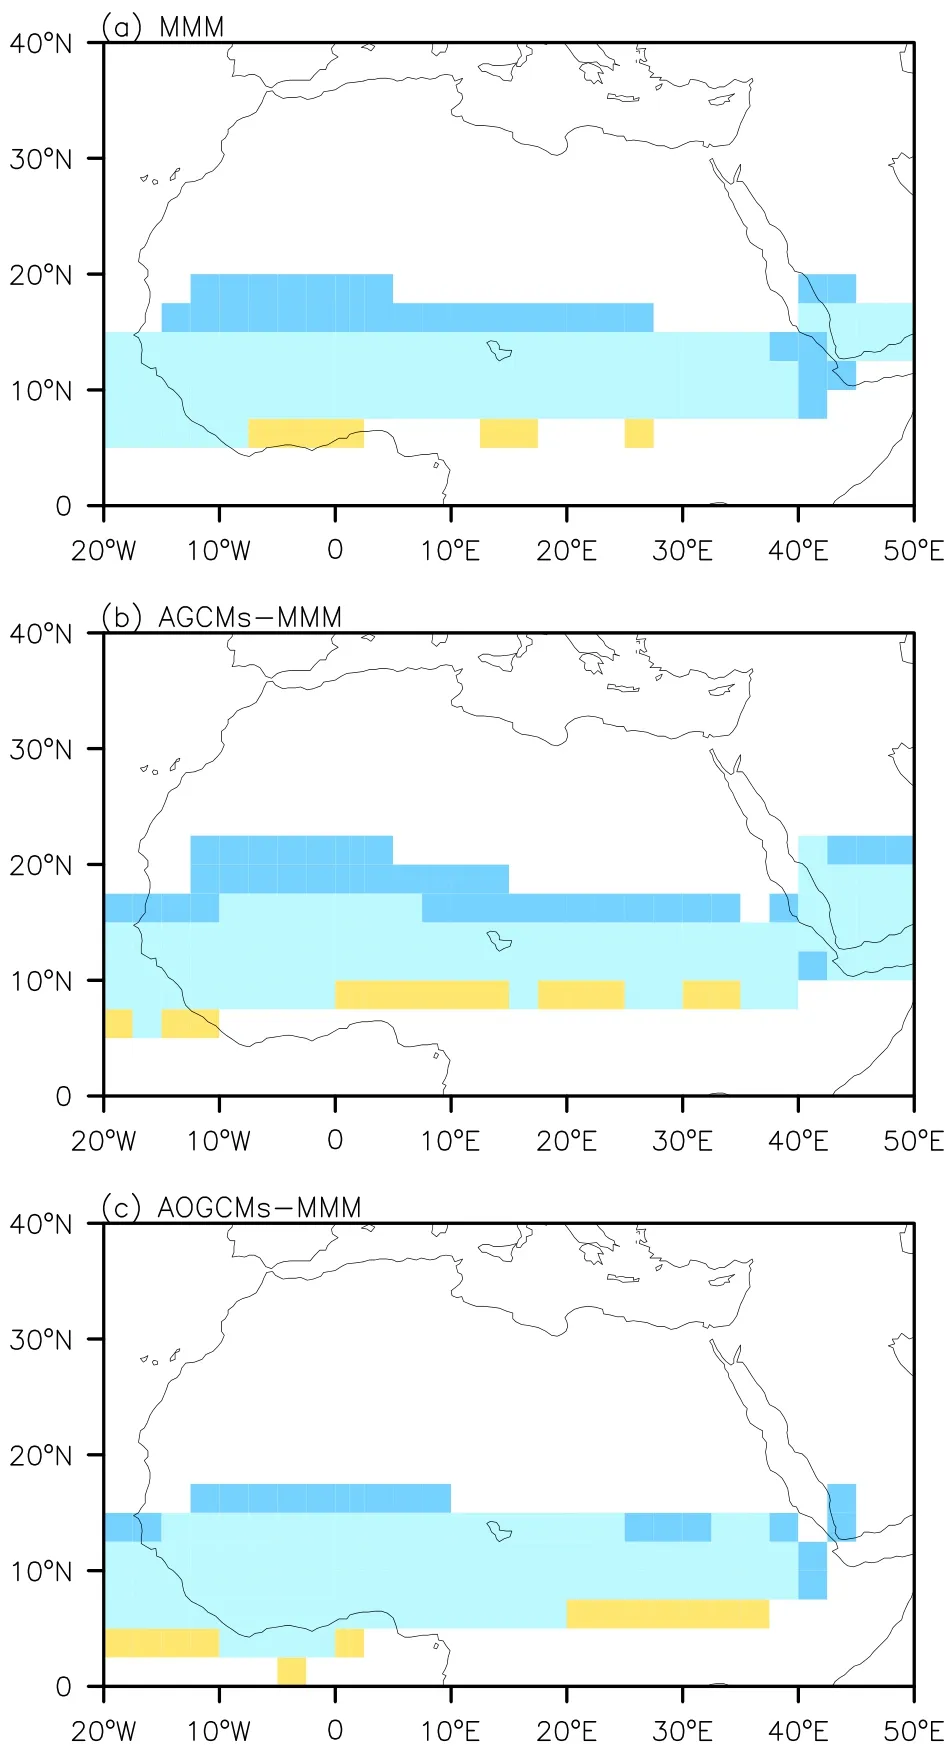
Fig.3.Monsoon domain(shaded)for the pre-industrial and mid-Piacenzian experiments from PlioMIP simulations:(a)is the MMM for all the models;(b)is the MMM for the AGCMs; and(c)is the MMM for AOGCMs.The light blue areas indicate the regions identified in both experiments,and the dark blue(orange)areas indicate the regions of expansion(retreat) in the mid-Piacenzian compared to the pre-industrial period. Monsoon domains were calculated according to the de finition in Wang et al.(2012),with the summer-minus-winter precipitation exceeding 2.0 mm d-1and the local summer precipitation exceeding 55%of the annual total precipitation.The summer (winter)here is from May to September(November to March).

Fig.4.Diff erence in the MMM for summer net energy[de finition in Chou and Neelin(2003)]in the atmospheric column (units:W m-2)between the mid-Piacenzian and pre-industrial experiments from PlioMIP simulations:(a)is the MMM for all the models;(b)is the MMM for the AGCMs;and(c)is the MMM for the AOGCMs.
Owing to increased net energy in the atmospheric column above North Africa(Figs.4b vs.4c),the AGCMs predicted a much stronger ASM than the AOGCMs(Figs.2b vs.2c), with a more northward positioning of the North African monsoon domain and the ITCZ than in the AOGCMs(Figs.2 and 3).The AGCMs use PRISM3 reconstructions,while the AOGCMs include atmosphere–ocean feedback.Thus,the discrepancy in the model results between the AGCMs and AOGCMs was mainly caused by the diff erence in the SST. Even so,geological evidence indicates that the climate in mid-Piacenzian was up to 5°C cooler than the Late Quaternary in Hadar,Ethiopia(Bonne fille et al.,2004).This evidence,and other temperature estimates available from the tropics,possibly suggest a large overestimation of the SST and surface air temperature(SAT)in the low latitudes by 1°C–6°C in the AOGCMs(Dowsett et al.,2013;Salzmann et al.,2013).If so,this overestimated SST and SAT in the tropics possibly led to the underestimation of the intensified ASM in the AOGCMs.
3.2. Contributions to the intensified ASM in the CAM4 simulations
In order to isolate the roles of mid-Piacenzian boundary conditions in the intensified ASM,high-resolution CAM4 experiments were also used to simulate the climate during the mid-Piacenzian(Table 2).In general,CAM4 simulated the intensified ASM and increased precipitation in North Africa well during the mid-Piacenzian,relative to the pre-industrial, agreeing well with the MMM of the PlioMIP models(Figs.2 and 5a).The CAM4 sensitivity experiments showed that the combined changes of atmospheric CO2concentration and SST were the most important factor to the intensified ASM during the mid-Piacenzian.These combined changes were largely responsible for promoting the warming in North Africa,which changed the temperature gradient(Fig.6b)and strengthened the thermal low anomalies in North Africa(not shown).These combined changes further enhanced the onshore fl ow from the ocean.After the change in atmospheric CO2concentration and SST in experiment MP compared to experiment PItv,the summer westerly wind strengthened markedly by 1.57 m s-1,averaged within North Africa(5°–30°N,10°W–40°E),moisture advection intensified(Table 3), and ultimately,the summer precipitation increased significantly by 1.01 mm d-1,with the ITCZ and the northern limit of the North African monsoon domain also shifting northward in North Africa(Fig.5b).
Vegetation change was the second most important factor for the increase in intensity of the simulated ASM.Owing to the improved vegetation in experiment PItv,the summer westerly wind strengthened by 0.62 m s-1and the summer precipitation increased by 0.74 mm d-1,averaged within North Africa(5°–30°N,10°W–40°E)(Fig.5c),when compared to experiment PIt.These increases were considerably larger than the changes caused by topography(PItminus PI) (Fig.5d).Moreover,the vegetation change also shifted the ITCZ and the northern limit of the North African monsoon domain northward,while the change caused by topography was weak(Figs.5c and d).Although the vegetation change decreased the surface albedo(Fig.1b),due to an increase in cloud cover(Table 3),vegetation change finally caused the SAT in North Africa to decrease(Fig.6c).By comparison, due to the e ff ects of the temperature lapse rate,increased topography caused the SAT to decrease,and vice versa(Fig. 6d).
The increased intensity of the ASM caused by the changed boundary conditions can also be explained by the increased net energy in the atmospheric column above North Africa(Fig.7,Table 3).Such increased net energy promoted ascending motion(Fig.8)and low-level atmospheric convergence(Fig.5).The combined changes of atmospheric CO2concentration and SST increased the net heat fl ux at the model top considerably(Table 3),which resulted from decreased top upwelling longwave fl ux due to the increased cloud fraction(Table 3).This increased net top heat fl ux further increased the net energy over most of North Africa(Fig.7b).The nature of the Pliocene vegetation,with less desert cover and reduced surface albedo,also increased the net heat fl ux at the model top(Table 3)and further enhanced the net energy over North Africa,in particular between~15°N and~25°N(Fig.7c).By comparison,the changed topography generally had a weak e ff ect on the increased net energy over North Africa(Fig.7d,Table 3).
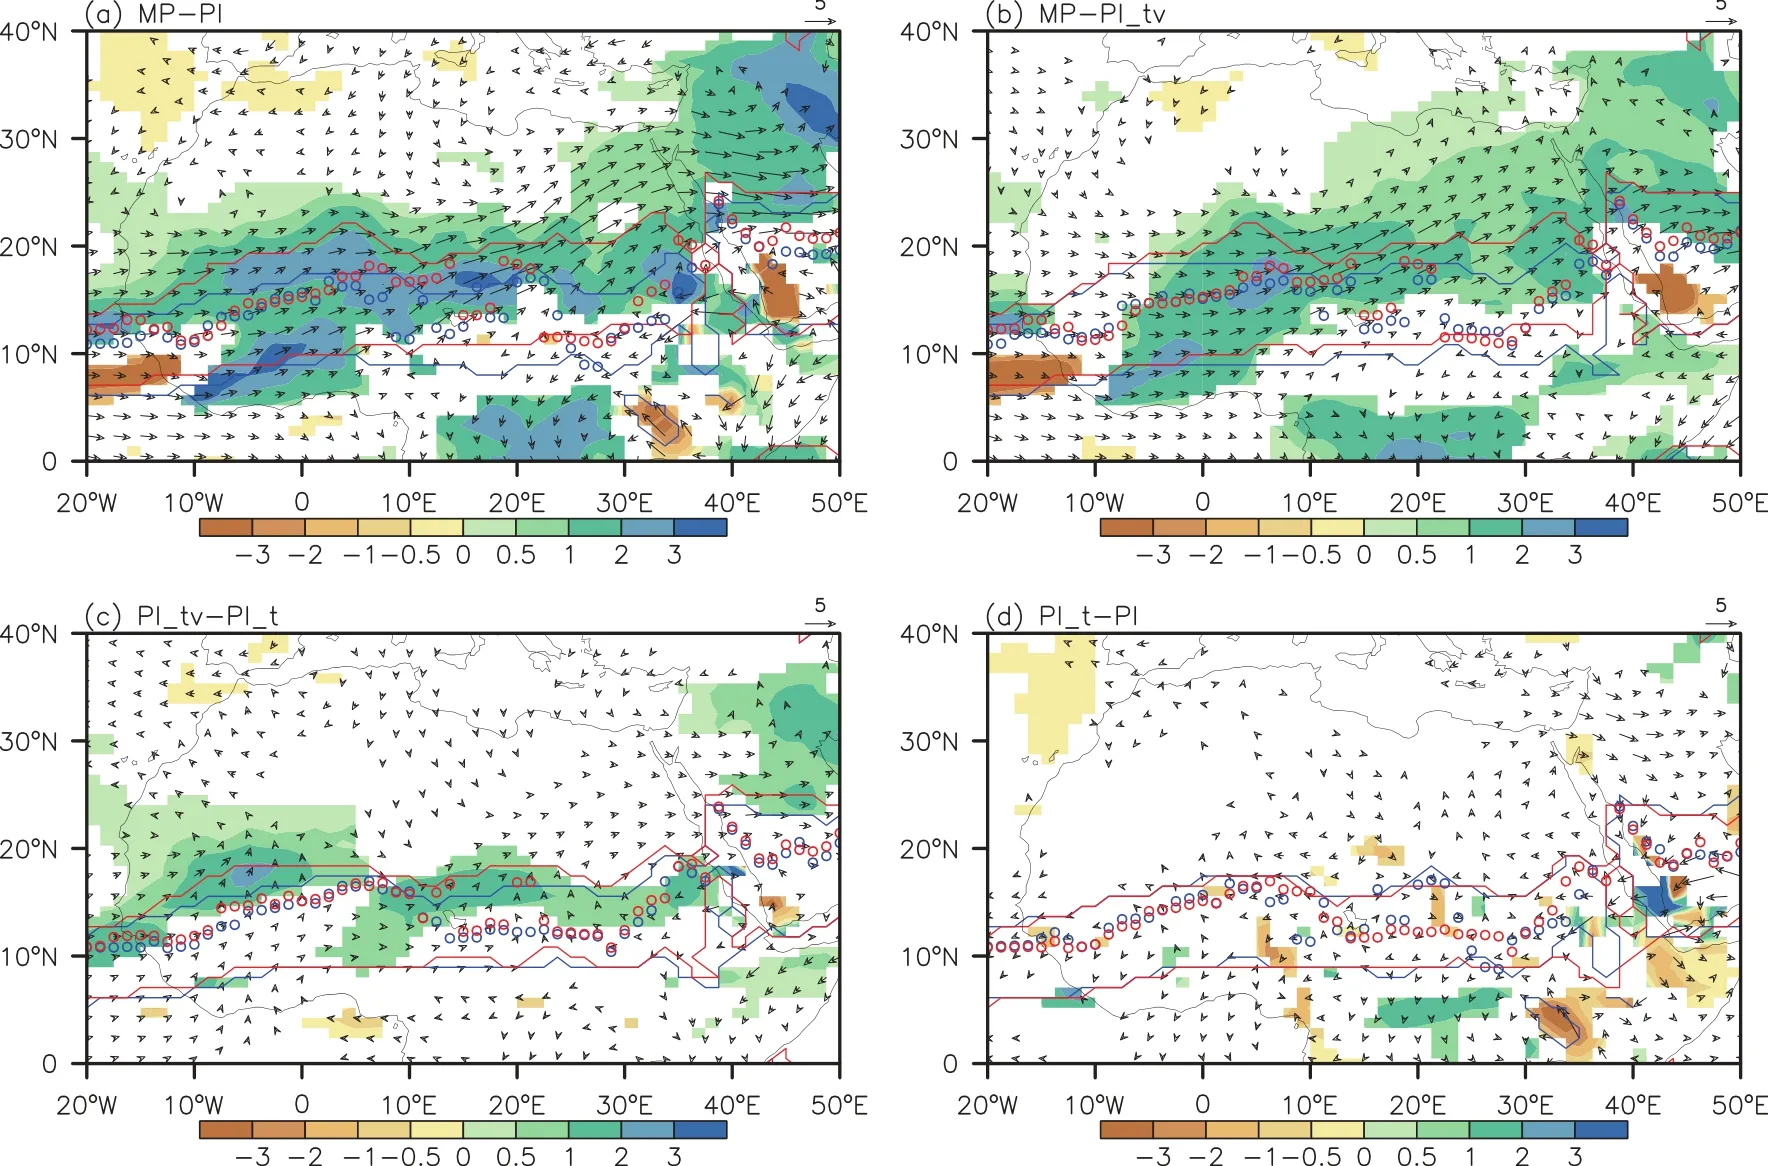
Fig.5.The simulated summer 850-hPa wind(vectors;units:m s-1)and precipitation(shaded;units:mm d-1)changes between experiments using CAM4.Only changes for precipitation and 850-hPa wind(either zonal or meridional wind) that are significant at the 95%con fidence level(Student’st-test)are shown.Monsoon domains(contours)and the positions of the climatological mean ITCZ(dots)are also shown.Red contours and dots are shown for experiment(a)MP, (b)MP,(c)PItvand(d)PIt.Blue contours and dots are shown for experiment(a)PI,(b)PItv,(c)PItand(d)PI.

Table 3.Regionally averaged summer precipitation(P,units:mm d-1),evaporation(E,units:mm d-1),cloud fraction,zonal 850-hPa wind(units:m s-1),and energy balance(units:W m-2)changes within region(5°–30°N,10°W–40°E)between experiments using CAM4. Only changes that were statistically significant at the 95%con fidence level(Student’st-test)were considered.Positive values indicate more heat into the atmosphere for net energy,net top heat and net top solar,less heat into the atmosphere for top upwelling longwave,and more heat from the atmosphere to the surface for net surface heat.
4. Discussion
Geological evidence indicates the existence of a wetter environment in North Africa in the mid-Piacenzian.For example,palynological data demonstrate that the desert zone was smaller than today during the mid-Piacenzian(Salzmann et al.,2008),with a much larger tree cover density in both West and East Africa compared to the Late Quaternary(Bonne fille,2010).Moreover,high δ18O values in soil carbonate and paleoprecipitation estimates also indicate East Africa likely received more rainfall in the mid-Piacenzian(Levin et al.,2004,2011;Wynn,2004).Under these wetter conditions,low dust fl uxes were present in the Atlantic(e.g., ODPsite664),Arabian Sea(e.g.,ODP site 721)andMediterranean(e.g.,ODP site 967)in the mid-Piacenzian(DeMenocal,1995,2004;Larrasoa˜na et al.,2003),and the northern Chad Basin in North Africa features lacustrine sediment occurring from 7 to 3 Ma(Schuster et al.,2009;Lebatard et al., 2010).
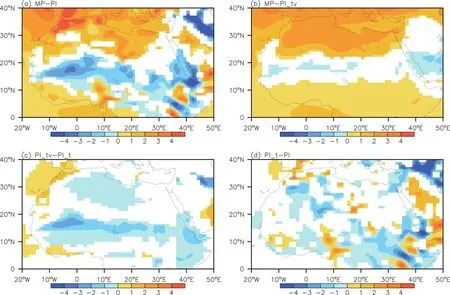
Fig.6.The simulated summer changes of SAT(units:°C)between experiments using CAM4.Only changes that are significant at the 95%con fidence level(Student’st-test)are shown.
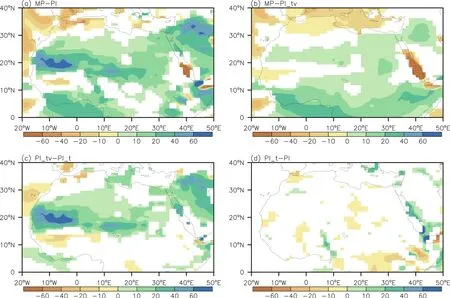
Fig.7.The simulated summer changes of net energy in the atmospheric column(units:W m-2)between experiments using CAM4.Only changes that are significant at the 95%con fidence level(Student’st-test)are shown.
The simulated wetter climate in the mid-Piacenzian qualitatively agrees with the geological evidence mentioned above.As shown in the simulation results,the combined changes of atmospheric CO2concentration and SST,as well as the vegetation change,both contributed more to the increased precipitation,compared with the topography change.
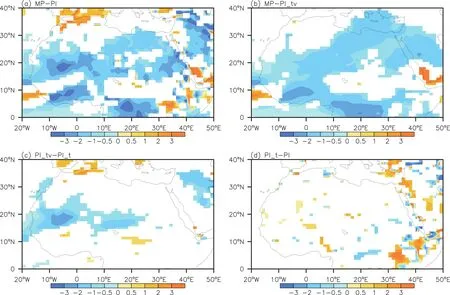
Fig.8.The simulated summer changes of vertical velocity at 500 hPa(units:100-1Pa s-1)between experiments using CAM4.Upward motion is negative and downward motion is positive.Only changes that are significant at the 95% con fidence level(Student’st-test)are shown.
Therein,the combined changes of atmospheric CO2concentration and SST were able to markedly intensify the moisture advection,while the vegetation change intensified more the local recycling in North Africa(Table 3).Since the combined changes of atmospheric CO2concentration and SST were so important for the increased precipitation during the mid-Piacenzian(Table 3),the moisture advection,mainly from the intensified ASM contributed more,compared with the local recycling,to the increased precipitation in North Africa in the mid-Piacenzian.
The changes in boundary conditions determine the corresponding climate e ff ects,and the potential uncertainty in boundary conditions may in fl uence the simulated ASM.For example,geological evidence indicates major uplift activity existed in African mountains during the mid to late Pliocene (Sepulchre et al.,2006;Zhang and Liu,2010).If so,the changed topography perhaps had diff erent climate e ff ects. Moreover,there were also discrepancies in the simulated ASM between the AOGCMs and AGCMs,due to the different SST used.Thus,more studies are needed to reduce the uncertainty in boundary conditions and further check the potential climate e ff ects.
In addition,more research e ff ort is needed to help understand the orbital-forced changes in precipitation in North Africa within the mid-Piacenzian.The present study focused on the mean climate in the mid-Piacenzian.Orbital-forced climate changes,including precipitation in North Africa,during interglacial events within the mid-Piacenzian,could have been substantial(Prescott et al.,2014).The second phase of PlioMIP will focus on the identification of a“time slice”(MIS KM5c;3.205 Ma)that has similar orbital forcing to today(Haywood et al.,2016).Even so,studies on orbitalforced changes of precipitation in North Africa during interglacial events are still needed,to better understand the ASM withinthemid-Piacenzian,as wellas themodel–data discord.
5. Summary
In the MMM result of all models from PlioMIP,the ASM strengthened and the precipitation increased over North Africa in the mid-Piacenzian,compared to the pre-industrial. The strengthened monsoon activity was caused by the increased net energy in the atmospheric column over North Africa.Furthermore,CAM4 simulations indicated that the combined changes of atmospheric CO2concentration and SST,as well as the vegetation change,were able to increase the net energy in the atmospheric column over North Africa, which promoted the strengthened ASM and increased the precipitation in the region.
Acknowledgements.We sincerely thank the anonymous reviewers for their insightful comments.We acknowledge the PlioMIP modelling groups for producing and making available their model output.This study was supported by the Strategic Priority Research Program of the Chinese Academy of Sciences(Grant No.XDB03020602),and the National Natural Science Founda-tion of China(Grant Nos.41175072,41305073,41402158 and 41472160).
REFERENCES
Bonne fille,R.,2010:Cenozoic vegetation,climate changes and hominid evolution in tropical Africa.Global and Planetary Change,72,390–411.
Bonne fille,R.,R.Potts,F.Chali´e,D.Jolly,O.Peyron,and T.E. Cerling,2004:High-resolutionvegetationandclimatechange associatedwithPlioceneAustralopithecusafarensis.Proceedings of the National Academy of Sciences of the United States of America,101,12 125–12 129.
Bosmans,J.H.C.,S.S.Drijfhout,E.Tuenter,L.J.Lourens,F.J. Hilgen,and S.L.Weber,2012:Monsoonal response to midholocene orbital forcing in a high resolution GCM.Climate of the Past,8,723–740.
Braconnot,P.,and Coauthors,2007:Results of PMIP2 coupled simulations of the Mid-Holocene and Last Glacial Maximum—Part 2:Feedbacks with emphasis on the location of the ITCZ and mid-and high latitudes heat budget.Climate of the Past,3,279–296.
Bragg,F.J.,D.J.Lunt,and A.M.Haywood,2012:Mid-Pliocene climate modelled using the UK hadley centre model:PlioMIP experiments 1 and 2.Geoscientific Model Development,5, 1109–1125.
Brierley,C.M.,2015:Interannual climate variability seen in the Pliocene Model Intercomparison Project.Climate of the Past,11,605–618.
Chan,W.L.,A.Abe-Ouchi,and R.Ohgaito,2011:Simulating the mid-Pliocene climate with the MIROC general circulation model:experimental design and initial results.Geoscientific Model Development,4,1035–1049.
Chandler,M.,D.Rind,and R.Thompson,1994:Joint investigations of the middle Pliocene climate II:GISS GCM northern hemisphere results.Global and Planetary Change,9,197–219.
Chandler,M.A.,L.E.Sohl,J.A.Jonas,H.J.Dowsett,and M. Kelley,2013:Simulations of the mid-Pliocene warm period using two versions of the NASA/GISS ModelE2-R coupled model.Geoscientific Model Development,6,517–531.
Chou,C.,and J.D.Neelin,2003:Mechanisms limiting the northward extent of the northern summer monsoons over North America,Asia,and Africa.J.Climate,16,406–425.
Contoux,C.,G.Ramstein,and A.Jost,2012:Modelling the mid-Pliocene warm period climate with the IPSL coupled model and its atmospheric component LMDZ5A.Geoscientific Model Development,5,903–917.
Cook,K.H.,G.A.Meehl,and J.M.Arblaster,2012:Monsoon RegimesandProcessesinCCSM4.PartII:AfricanandAmerican Monsoon Systems.J.Climate,25,2609–2621.
DeMenocal,P.B.,1995:Plio-Pleistocene african climate.Science,270,53–59.
DeMenocal,P.B.,2004:African climate change and faunal evolution during the Pliocene-Pleistocene.Earth and Planetary Science Letters,220,3–24.
Dowsett,H.J.,M.M.Robinson,and K.M.Foley,2009:Pliocene three-dimensional global ocean temperature reconstruction.Climate of the Past,5,769–783.
Dowsett,H.J.,and Coauthors,2010:The PRISM3D paleoenvironmental reconstruction.Stratigraphy,7,123–139.
Dowsett,H.J.,and Coauthors,2013:Sea surface temperature of the mid-Piacenzian ocean:a data-model comparison.Scientific Reports,3,doi:10.1038/srep02013.
Haywood,A.M.,and P.J.Valdes,2004:Modelling Pliocene warmth:Contribution of atmosphere,oceans and cryosphere.Earth and Planetary Science Letters,218,363–377.
Haywood,A.M.,and Coauthors,2010:Pliocene model intercomparison project(PlioMIP):Experimental design and boundary conditions(Experiment 1).Geoscientific Model Development,3,227–242.
Haywood,A.M.,H.J.Dowsett,M.M.Robinson,D.K.Stoll,A. M.Dolan,D.J.Lunt,B.Otto-Bliesner,and M.A.Chandler, 2011:Pliocene model intercomparison project(PlioMIP): Experimental design and boundary conditions(Experiment 2).Geoscientific Model Development,4,571–577.
Haywood,A.M.,and Coauthors,2013:Large-scale features of Pliocene climate:results from the Pliocene Model Intercomparison Project.Climate of the Past,9,191–209.
Haywood,A.M.,and Coauthors,2016:The Pliocene Model Intercomparison Project(PlioMIP)Phase 2:Scientific objectives and experimental design.Climate of the Past,12,663–675.
Hill,D.J.,and Coauthors,2014:Evaluating the dominant components of warming in Pliocene climate simulations.Climate of the Past,10,79–90.
Jiang,D.B.,H.J.Wang,Z.L.Ding,X.M.Lang,and H.Drange, 2005:Modeling the middle Pliocene climate with a global atmospheric general circulation model.J.Geophys.Res.,110, doi:10.1029/2004JD005639.
Kamae,Y.,and H.Ueda,2012:Mid-Pliocene global climate simulation with MRI-CGCM2.3:Set-up and initial results of PlioMIP experiments 1 and 2.Geoscientific Model Development,5,793–808.
Kamae,Y.,H.Ueda,and A.Kitoh,2011:Hadley and walker circulations in the mid-pliocene warm period simulated by an atmospheric general circulation model.J.Meteor.Soc.Japan,89,doi:10.2151/jmsj.2011-505.
Kroepelin,S.,and Coauthors,2006:Revisiting the age of the Sahara desert.Science,312,1138–1139.
Kutzbach,J.E.,and Z.Liu,1997:Response of the African monsoon to orbital forcing and ocean feedbacks in the middle holocene.Science,278,440–443.
Larrasoa˜na,J.C.,A.P.Roberts,E.J.Rohling,M.Winklhofer,and R.Wehausen,2003:Three million years of monsoon variability over the northern Sahara.Climate Dyn.,21,689–698.
Lawrence,D.M.,andCoauthors,2011:Parameterizationimprovements and functional and structural advances in version 4 of the Community Land Model.Journal of Advances in Modeling Earth Systems,3,doi:10.1029/2011MS00045.
Lebatard,A.E.,and Coauthors,2010:Application of the authigenic10Be/9Be dating method to continental sediments:Reconstruction of the Mio-Pleistocene sedimentary sequence in the early hominid fossiliferous areas of the northern Chad Basin.Earth and Planetary Science Letters,297,57–70.
Levin,N.E.,J.Quade,S.W.Simpson,S.Semaw,and M.Rogers, 2004:Isotopic evidence for Plio-Pleistocene environmental change at Gona,Ethiopia.Earth and Planetary Science Letters,219,93–110.
Levin,N.E.,F.H.Brown,A.K.Behrensmeyer,R.Bobe,and T.E. Cerling,2011:PaleosolcarbonatesfromtheOmoGroup:Isotopic records of local and regional environmental change in East Africa.Palaeogeography,Palaeoclimatology,Palaeoecology,307,75–89.
Li,X.Y.,D.B.Jiang,Z.S.Zhang,R.Zhang,Z.P.Tian,and Q. Yan,2015:Mid-Pliocene Westerlies from PlioMIP Simulations.Adv.Atmos.Sci.,32,909–923,doi:10.1007/s00376-014-4171-7.
Neale,R.B.,J.Richter,S.Park,P.H.Lauritzen,S.J.Vavrus,P. J.Rasch,and M.H.Zhang,2013:The mean climate of the Community Atmosphere Model(CAM4)in forced SST and fully coupled experiments.J.Climate,26,5150–5168.
Prescott,C.L.,A.M.Haywood,A.M.Dolan,S.J.Hunter,J.O. Pope,and S.J.Pickering,2014:Assessing orbitally-forced interglacial climate variability during the mid-Pliocene Warm Period.Earth and Planetary Science Letters,400,261–271.
Rosenbloom,N.A.,B.L.Otto-Bliesner,E.C.Brady,and P.J. Lawrence,2013:Simulating the mid-Pliocene warm period with the CCSM4 model.Geoscientific Model Development,6,549–561.
Salzmann,U.,A.M.Haywood,D.J.Lunt,P.J.Valdes,and D. J.Hill,2008:A new global biome reconstruction and datamodel comparison for the middle Pliocene.Global Ecology and Biogeography,17,432–447.
Salzmann,U.,and Coauthors,2013:Challenges in quantifying Pliocene terrestrial warming revealed by data-model discord.Nature Climate Change,3,969–974.
Schuster,M.,and Coauthors,2009:Chad basin:Paleoenvironments of the Sahara since the Late Miocene.Comptes Rendus Geoscience,341,603–611.
Sepulchre,P.,G.Ramstein,F.Fluteau,M.Schuster,J.-J.Tiercelin, and M.Brunet,2006:Tectonic uplift and Eastern Africa aridification.Science,313,1419–1423.
Shields,C.A.,D.A.Bailey,G.Danabasoglu,M.Jochum,J. T.Kiehl,S.Levis,and S.Park,2012:The low-resolution CCSM4.J.Climate,25,3993–4014.
Sloan,L.C.,T.J.Crowley,and D.Pollard,1996:Modeling of middle Pliocene climate with the NCAR GENESIS general circulation model.Marine Micropaleontology,27,51–61.
Stepanek,C.,and G.Lohmann,2012:Modelling mid-Pliocene climate with COSMOS.Geoscientific Model Development,5, 1221–1243.
Sun,Y.,G.Ramstein,C.Contoux,and T.Zhou,2013:A comparative study of large scale atmospheric circulation in the context of future scenario(RCP4.5)and past warmth(Mid-Pliocene).Climate of the Past,9,1613–1627.
Wang,B.,J.Liu,H.J.Kim,P.J.Webster,and S.Y.Yim,2012:Recent change of the global monsoon precipitation(1979-2008).Climate Dyn.,39,1123–1135.
Wynn,J.G.,2004:In fl uence of Plio-Pleistocene aridification on human evolution:evidence from paleosols of the Turkana Basin,Kenya.American Journal of Physical Anthropology,123,106–118.
Yan,Q.,Z.S.Zhang,H.J.Wang,Y.Q.Gao,and W.P.Zheng, 2012:Set-up and preliminary results of mid-Pliocene climate simulations with CAM3.1.Geoscientific Model Development,5,289–297.
Zhang,R.,andX.D.Liu,2010:Thee ff ectsoftectonicupliftonthe evolution of Asian summer monsoon climate since Pliocene.Chinese Journal of Geophysics,53,948–960.
Zhang,R.,and Coauthors,2013a:Mid-Pliocene East Asian monsoon climate simulated in the PlioMIP.Climate of the Past,9, 2085–2099.
Zhang,Z.S.,and Q.Yan,2012:Pre-industrial and mid-Pliocene simulations with NorESM-L:AGCM simulations.Geoscientific Model Development,5,1033–1043.
Zhang,Z.S.,and Coauthors,2012:Pre-industrial and mid-Pliocene simulations with NorESM-L.Geoscientific Model Development,5,523–533.
Zhang,Z.S.,and Coauthors,2013b:Mid-Pliocene Atlantic meridional overturning circulation not unlike modern.Climate of the Past,9,1495–1504.
Zhang,Z.S.,G.Ramstein,M.Schuster,C.Li,C.Contoux,and Q.Yan,2014:Aridification of the Sahara desert caused by Tethys Sea shrinkage during the Late Miocene.Natrue,513, 401–404,doi:10.1038/nature13705.
Zheng,W.,Z.Zhang,L.Chen,and Y.Yu,2013:The mid-Pliocene climate simulated by FGOALS-g2.Geoscientific Model Development,6,1127–1135.
:Zhang,R.,Z.S.Zhang,D.B.Jiang,Q.Yan,X.Zhou,and Z.G.Cheng,2016:Strengthened African summer monsoon in the mid-Piacenzian.Adv.Atmos.Sci.,33(9),1061–1070,
10.1007/s00376-016-5215-y.
∗Corresponding author:Ran ZHANG
Email:zhangran@mail.iap.ac.cn
 Advances in Atmospheric Sciences2016年9期
- Advances in Atmospheric Sciences的其它文章
- Workshop on Dynamics,Transport and Chemistry of the UTLS Asian Monsoon
- Incorporation of a Dynamic Root Distribution into CLM4.5:Evaluation of Carbon and Water Fluxes over the Amazon
- Comparison of Nonlinear Local Lyapunov Vectors with Bred Vectors, Random Perturbations and Ensemble Transform Kalman Filter Strategies in a Barotropic Model
- A Timescale Decomposed Threshold Regression Downscaling Approach to Forecasting South China Early Summer Rainfall
- Abrupt Summer Warming and Changes in Temperature Extremes over Northeast Asia Since the Mid-1990s:Drivers and Physical Processes
- Impacts of the Diurnal Cycle of Solar Radiation on Spiral Rainbands
