1990年代初夏季东北亚低压的年代际转变
2016-07-27 09:20:27杜梦醒林中达陆日宇
大气科学 2016年4期
杜梦醒林中达陆日宇
1中国科学院大气物理研究所大气科学和地球流体力学数值模拟国家重点实验室,北京1000292中国科学院大学,北京100049
1990年代初夏季东北亚低压的年代际转变
杜梦醒1, 2林中达1陆日宇1
1中国科学院大气物理研究所大气科学和地球流体力学数值模拟国家重点实验室,北京100029
2中国科学院大学,北京100049
摘 要夏季东亚地区对流层低层受到一个陆地低压系统控制;该低压中心位于东亚的北部地区,文中称之为东北亚低压。基于NCEP/DOE、NCEP/NCAR、ERA-40和ERA-Interim四种不同的再分析数据,本文分析了夏季东北亚低压的年代际变化特征,并进一步探讨了其转变的可能物理机理。研究结果表明夏季东北亚低压在1990年代初期存在一次显著的年代际转变,之后低压强度减弱。对应此次年代际转变,东北亚地区对流层位势高度呈现为正压结构的正异常,其南侧的高空西风急流中心强度减弱。进一步,基于观测和简单线性斜压模式模拟结果,我们提出环贝加尔湖地区夏季气温增加可能是导致1990年代初期之后夏季东北亚低压减弱的原因。
关键词夏季东北亚低压 年代际变化 环贝加尔湖增暖
杜梦醒,林中达,陆日宇. 2016. 1990年代初夏季东北亚低压的年代际转变 [J]. 大气科学, 40 (4): 805−816. Du Mengxing, Lin Zhongda, Lu Riyu. 2016. Inter-decadal change in the summertime Northeast Asia low-pressure system in the early 1990s [J]. Chinese Journal of Atmospheric Sciences (in Chinese), 40 (4): 805−816, doi:10.3878/j.issn.1006-9895.1511.15178.
1 引言
东亚夏季风变化同时受到热带和中纬度环流的共同作用(Tao and Chen,1987;张庆云和陶诗言,1998;柳艳香和郭裕福,2005;武炳义和张人禾,2011)。从对流层低层来看,东亚夏季风的强度变化主要受到两个大尺度环流系统的影响:位于海洋上的西北太平洋副热带高压和位于陆地上的东亚低压(郭其蕴,1983)。由于夏季东亚陆面低压中心位于东亚北部地区,该低压也被称为夏季东北亚低压(Lin and Wang,2015)。以前的许多研究大多强调了西北太平洋副热带高压的异常变化及其对东亚夏季风和气候的重要影响(陶诗言和朱福康,1964;周明煜等,1980;王柏钧和陈刚毅,1992;刘屹岷等,1999;Lu and Dong,2001;慕巧珍等,2001;Lu,2001,2002;吴国雄等,2002;Sui et al.,2007;Yeo et al.,2012;Lee et al.,2013)。但是,到目前为止,关于东北亚陆面低压所知甚少。
近期,Lin(2014)对比分析了夏季欧亚大陆上空四种最主要的大气遥相关型对东亚夏季降水的影响,指出夏季东北亚低压的强度变化是欧亚大陆中高纬度扰动影响东亚夏季降水的关键过程。此后,Lin and Wang(2015)进一步分析了夏季东北亚低压的年际变化特征,指出强度变化是其年际变化的主要模态。
除了存在显著的年际变化以外,Lin and Wang (2015)也注意到夏季东北亚低压强度在1990年代初期前后存在年代际的位相变化:1990年代初期以前东北亚低压强度偏强,而之后的低压强度偏弱。但他们的工作并未对其做进一步研究,是否东北亚低压强度在1990年代初期存在年代际转变尚不明确。其次,由于其研究主要集中在年际变化时间尺度,分析采用的数据来自于1979年以后的NCEP/NCAR再分析资料,是否东北亚低压强度在之前存在类似年代际变化?其形成的物理机制是什么?
在本研究中,我们将采用四种不同的再分析数据分别研究夏季东北亚低压强度的年代际变化特征,并探讨其年代际转变的物理机理。本研究内容的具体安排如下:第2部分介绍本研究所采用的数据和分析方法。第3部分简单介绍夏季东北亚低压的基本特征。在第4部分,我们对夏季东北亚低压强度的年代际变化进行显著性检验,四种再分析数据均表明该低压的强度在 1991年以后显著减弱。进一步,我们分析了东北亚低压 1990年代初期此次年代际转变对应的大尺度环流特征。第5部分探讨了东北亚低压强度在 1990年代初期之后显著减弱的可能原因。在第6部分,我们对本文进行了小结和讨论。
2 资料和方法
2.1 数据资料
本文所采用的逐月大气环流数据包括美国国家环境预报中心提供的 NCEP-DOE(Kanamitsu et al.,2002)、NCEP/NCAR(Kalnay et al.,1996)再分析数据、欧洲中期数值预报中心提供的 ERA-40 (Uppala et al.,2005)和ERA-Interim(Dee et al.,2011)再分析数据。所使用的变量包括位势高度、地表气压、纬向和经向风。其中选取的NCEP-DOE再分析数据的时间段为1979~2013年,ERA-Interim再分析数据为1979~2014年,NCEP/ NCAR再分析数据为1948~2014年,ERA-40再分析数据为1958~2002年;空间分辨率均为2.5°× 2.5°。
近地面气温数据除了用到 NCEP-DOE资料(Kanamitsu et al.,2002),还用了英国东安格利亚大学气候研究中心提供的CRU TS3.22地表气温资料(Harris et al.,2014),时间为1979~2013年,空间分辨率为0.5°×0.5°。
2.2 线性斜压模式
为了探讨夏季东北亚低压年代际变化的可能原因,我们采用了一个线性斜压原始方程数值模式(Watanabe and Kimoto,2000)。设X为原始方程中的诊断矢量变量,包括涡度ζ、散度D、气温T和表面气压对数(π=ln p),即X=X(ζ, D, T, π)。对于基本态X,忽略非线性部分并保留线性扰动X',那么通过计算原始方程动力线性算子和外强迫,就可得到相应的线性响应解 X'。在本研究中,我们不考虑水汽改变的影响。大气环流对于热源强迫的响应主要取决于两个因素:热源位置和大气环流基本场。本文中大气环流基本场选取为 NCEP/ NCAR资料1961~1990年共30年平均态环流场;模式的水平分辨率是 T42,垂直方向采用s 坐标,共21层。
3 夏季东北亚低压的基本特征
图 1是基于 NCEP-DOE再分析数据得到的1979~2013年东亚地区夏季平均对流层中、低层位势高度空间分布。在对流层低层(925~850 hPa),东亚北部地区上空存在一个明显低压系统,其中心位于我国东北地区北部上空,本文中该低压被称为东北亚低压。而在850 hPa以上的对流层中层,东北亚地区上空位势高度场上表现为弱的低压浅槽。考虑到东北亚地区高原地形的影响(图 1f),东北亚低压在850 hPa等压面上表现最为明显(图1d)。因此,在本文中,我们采用850 hPa的位势高度来描述东北亚低压,该低压中心区域范围为(45°~60°N,110°~130°E)。
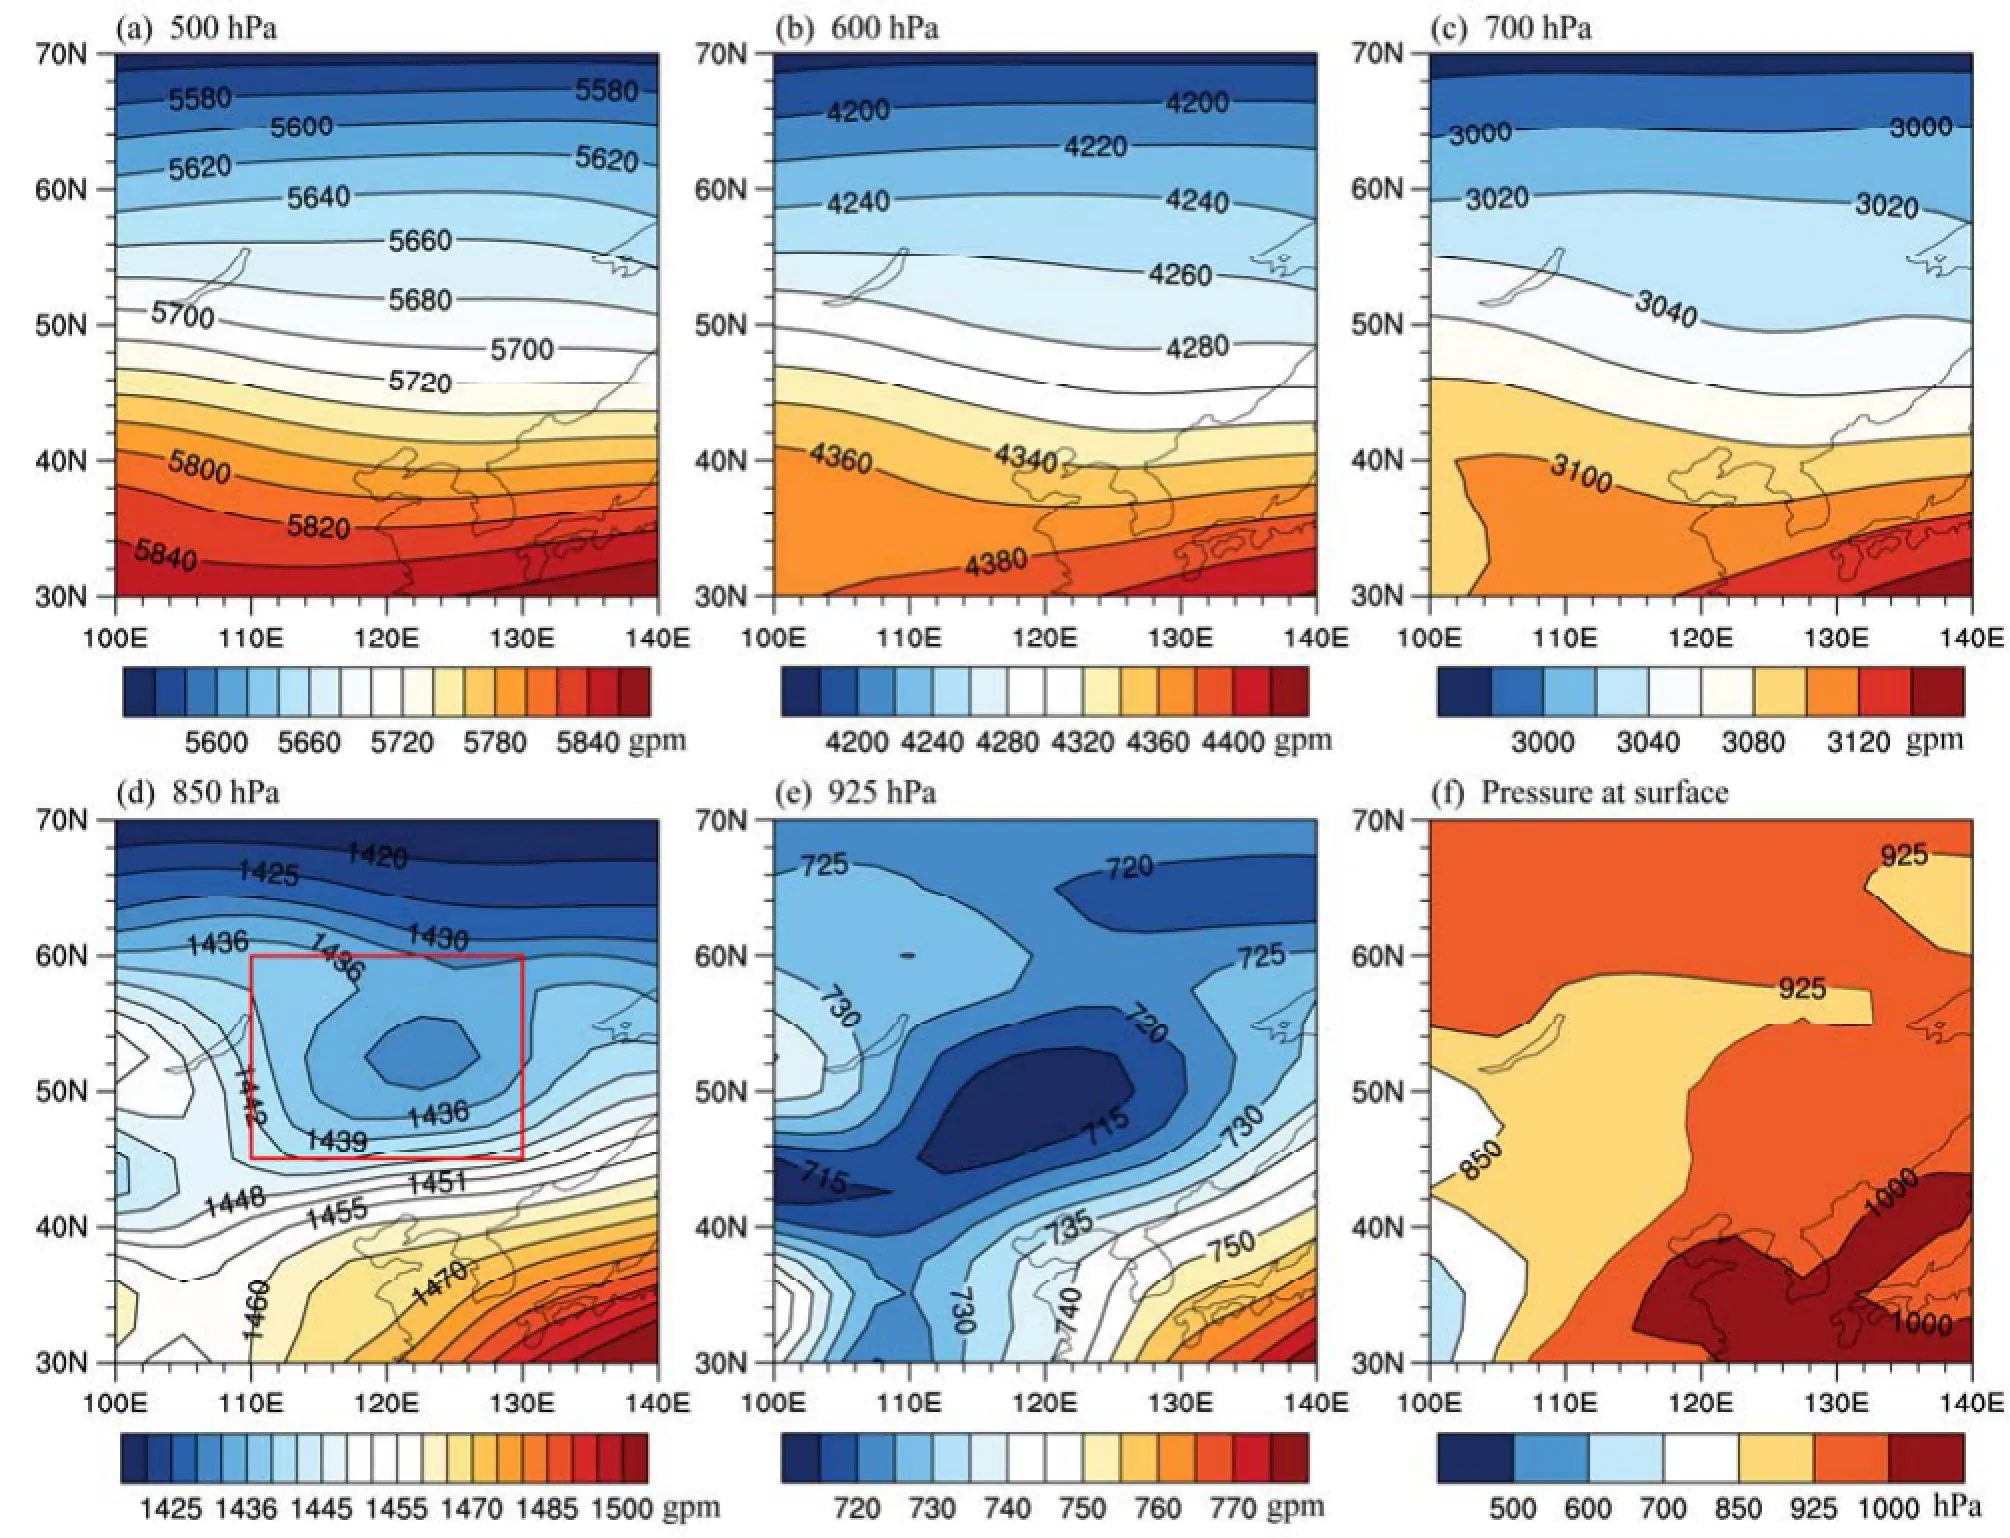
图1 1979~2013年夏季平均的(a–e)位势高度场(单位:gpm)垂直分布和(f)地表面气压(单位:hPa)。灰色阴影区域的地表面气压低于该等压面气压,表征地形影响。(d)中红色方框为东北亚低压核心区域(45°~60°N,110°~130°E),下同Fig. 1 (a–e) Vertical cross section of summertime geopotential height (units: gpm) and (f) surface air pressure (units: hPa) averaged over the period of 1979–2013. Grey shaded areas indicate where the surface pressure is lower than the specific pressure level in each figure. The red box in (d) depicts the core region (45°–60°N, 110°–130°E) of the low-pressure system over Northeast Asia (NEAL), the same below
而从季节演变来看,该低压仅存在于夏季。图2给出的是冬、春、夏、秋四个季节的 850 hPa位势高度场气候态空间分布。与夏季受低压系统控制不同,在其他季节(冬、春和秋季),东北亚地区位于强大的东亚大槽后部、蒙古高压的前部,主要受到偏北冷空气的控制。进一步,图 3给出了基于NCEP-DOE、NCEP/NCAR、ERA-40 和 ERA-Interim 四种再分析资料得到的 1979~2002年共24年夏季平均850 hPa位势高度空间分布。不同资料中,夏季东北亚地区上空均为低压所控制。同时,我们还注意到不同资料中低压强度略有差别:与NCEP-DOE 和NCEP/NCAR相比,ERA-40和ERA-Interim资料得到的低压强度更强。进一步,我们计算了该低压核心区域(45°~60°N,110°~130°E)平均的850 hPa位势高度,其强度分别为 1438 gpm(NCEP-DOE)、1437 gpm (NCEP/NCAR)、1432 gpm(ERA-40)以及1431gpm(ERA-Interim)。此外,与两类NCEP资料相比,基于ERA-40和ERA-Interim数据显示的东北亚低压中心位置略偏西,由我国东北地区北部上空向蒙古东部移动。
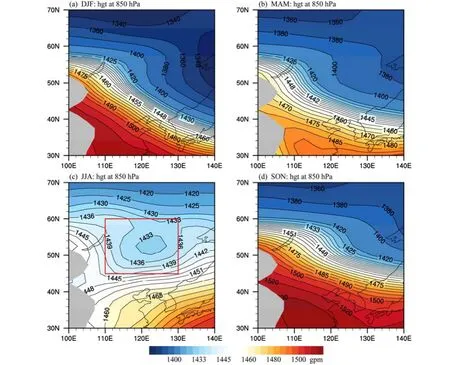
图2 1979~2013年平均的850 hPa位势高度场(单位:gpm)季节演变:(a)冬季;(b)春季;(c)夏季;(d)秋季Fig. 2 Seasonal evolution of geopotential height (units: gpm) at 850 hPa averaged over the period of 1979–2013: (a) Winter; (b) spring; (c) summer;(d) autumn
4 夏季东北亚低压强度的年代际变化
4.1 年代际转变的时间特征
图 4a给出了基于四种不同再分析资料计算得到的夏季东北亚低压强度指数的时间序列。该指数定义为东北亚低压核心区域(45°~60°N,110°~130°E)平均的夏季 850 hPa位势高度距平的相反值。其中负号的添加使得正指数对应东北亚低压强度增强,负指数对应东北亚低压强度减弱。为便于比较四种数据,平均值均使用1979~2002年共24年平均。从NCEP-DOE计算得到的东北亚低压强度可以发现其在1990年代初有明显转折:1990年代初期之后大多数年份东北亚低压强度指数为负值,对应该地区正位势高度异常,夏季东北亚低压强度减弱。此外,我们也注意到东北亚低压强度在2000年代中期以后逐渐变为正值,暗示东北亚低压强度又有所增强。基于NCEP/NCAR数据计算得到的东北亚低压强度也呈现类似的位相转变特征;而在ERA数据中则位相变化仅仅出现在1990年代初期。
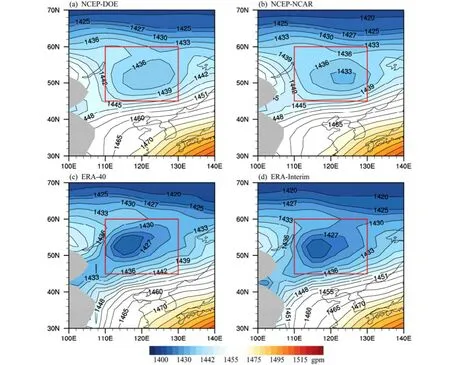
图3 1979~2002年夏季平均的850 hPa位势高度(单位:gpm):(a)NCEP-DOE;(b)NCEP/NCAR;(c)ERA-40;(d)ERA-InterimFig. 3 Summertime geopotential height (units: gpm) at 850 hPa averaged over the period of 1979–2002 based on (a) NCEP-DOE, (b) NCEP/NCAR,(c) ERA-40, and (d) ERA-Interim reanalysis data
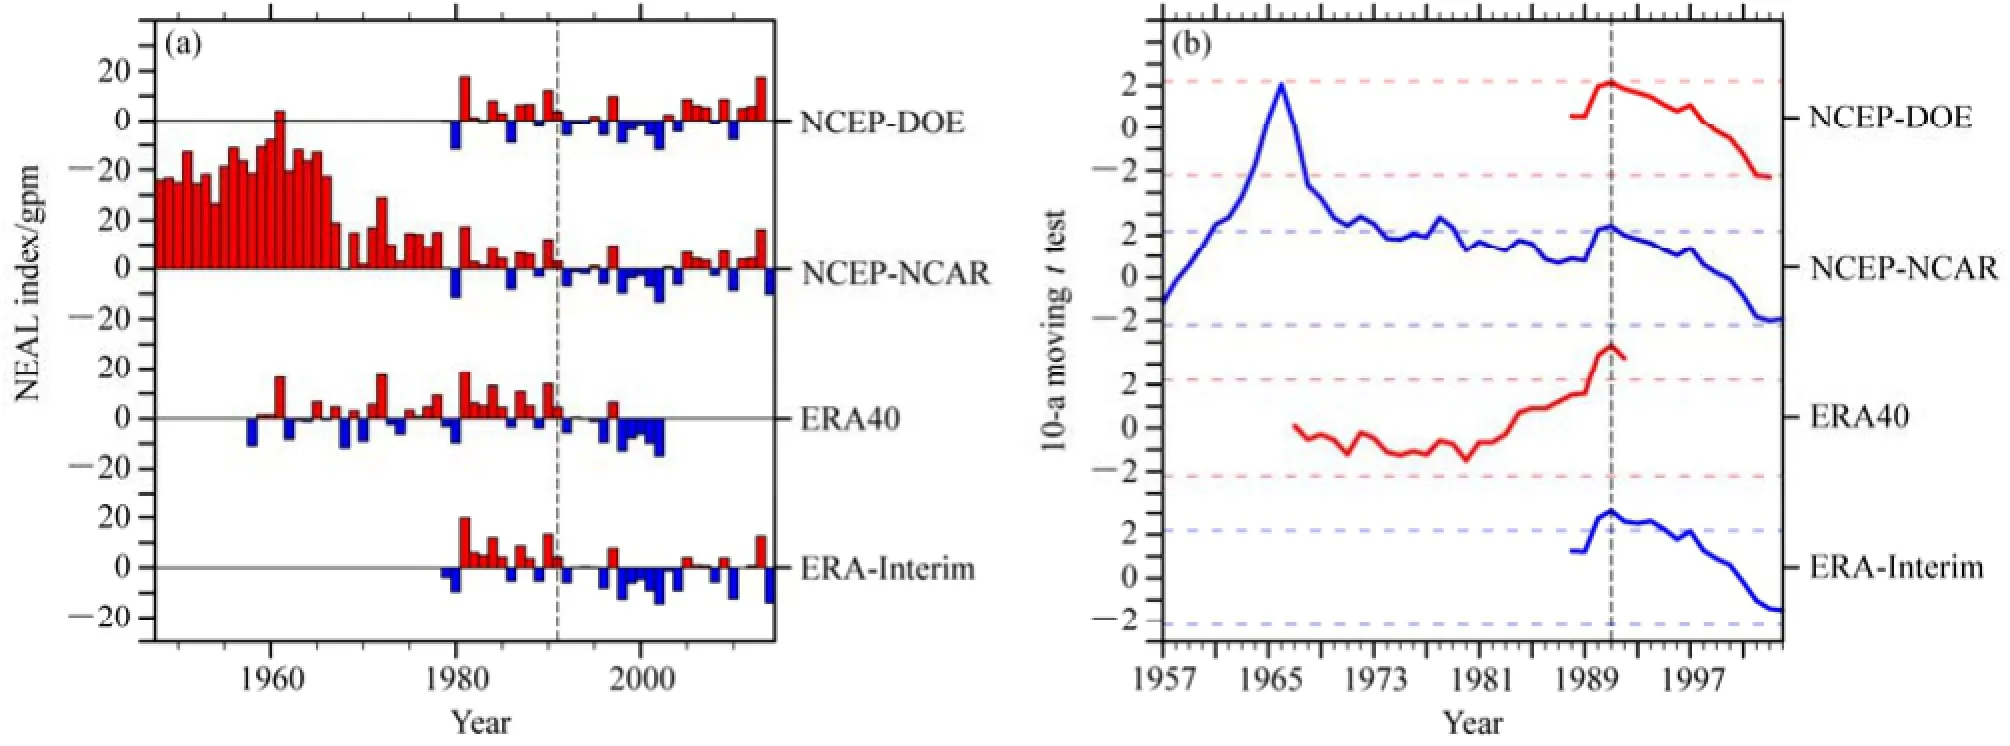
图4 (a)夏季东北亚低压强度指数的时间序列及(b)其10年滑动t检验。该指数定义为东北亚低压核心区域(45°~60°N,110°~130°E)平均的夏季850 hPa位势高度距平的相反值,其气候平均值均使用1979~2002年共24年平均。(b)中虚线表征0.05显著性水平检验值Fig. 4 (a) Time series of the summertime NEAL index and (b) its 10-a moving t test. The NEAL index is defined as the inverse value of the mean geopotential height anomaly (departure from its climatological mean of 1979–2002) at 850 hPa averaged over the NEAL core region (45°–60°N, 110°–130°E). Dashed lines in (b) represent the values that are statistically significant at the 0.05 significance level
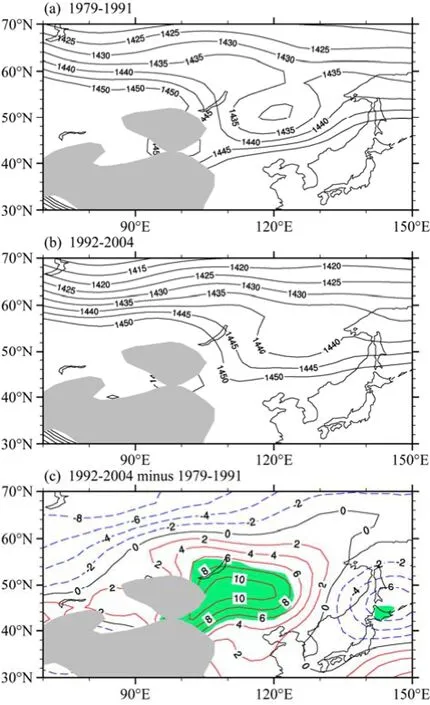
图5 (a)1979~1991年和(b)1992~2004年夏季平均的850 hPa位势高度场(等值线,单位:gpm)及(c)两者之差。灰色阴影区描述了850 hPa的地形分布,(c)中绿色阴影区为通过0.05显著性水平的区域,下同Fig. 5 Summertime geopotential height (isolines, units: gpm) at 850 hPa averaged for (a) 1979–1990, (b) 1993–2004, and (c) their difference. Grey shaded area depicts the effect of topography at 850 hPa and the green shaded areas in (c) indicate where the difference is statistically significant at the 0.05 significance level, the same below
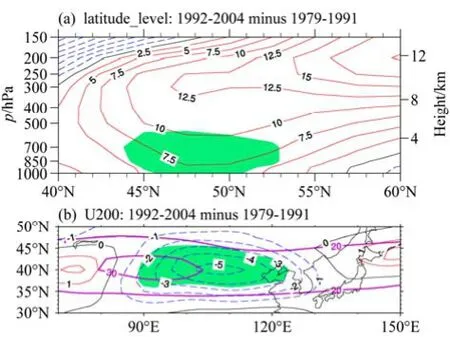
图6 1979~1991年和1992~2004年夏季平均的(a)110°~130°E纬向平均位势高度差值(单位:gpm)的经向垂直分布和(b)200 hPa纬向风差值场(单位:m s−1)。(a)和(b)中红色等值线代表正值,蓝色虚线代表负值,(b)中紫线代表200 hPa纬向风的气候平均态Fig. 6 (a) Latitude–height cross-section of geopotential height difference between 1992–2004 and 1979–1991 (units: gpm) averaged over 110°–130°E and (b) zonal wind difference at 200 hPa (units: m s−1) between 1992–2004 and 1979–1991. Red solid lines and blue dash lines indicte positive and negative values respectively in both (a) and (b), purple contours in (b) depict the climatology of zonal winds at 200 hPa
为了检验东北亚低压强度年代际转变的显著性,我们对其作滑动t检验,滑动时间步长为前后各10年(图4b)。四种再分析资料均指出夏季东北亚低压在 1991年前后存在显著的年代际转变。另外,虽然NCEP-DOE和NCEP/NCAR资料中东北亚低压指数分别在2003年和1978年通过显著性水平0.05的检验,但ERA-40和ERA-Interim资料中该指数在这两个年份均未通过显著性检验。因此,在下面的分析中,我们主要关注东北亚低压强度在1991年前后的年代际变化,采用的数据为NCEP-DOE再分析数据。
4.2 1990年代初夏季东北亚低压年代际转变的空间特征
为了查看夏季东北亚低压 1990年代初此次年代际变化的空间分布特征,我们分别选取该年代际转变的前13年(1979~1991年)和后13年(1992~2004年)夏季平均来表征1991年前后东北亚低压的基本特征。图5是1979~1991年(图5a)和1992~2004年(图5b)前后两个时间段夏季平均的850 hPa位势高度场以及两者之差(图 5c)。前后两个时间段夏季平均的850 hPa位势高度场上都能看到东北亚核心区域是明显的低值区,但是后一时段比之前低压强度减弱。在 1991年之前,我国东北和蒙古交界区域上空有明显的低压中心,中心强度低于1430 gpm。而相比于1979~1991年,1992~2004年平均的夏季东北亚低压明显减弱(图 5b),呈现为低压槽结构,强度高于1435 gpm,低压中心不明显。两者之差表现为东亚北部地区位势高度显著增加,东北亚低压强度减弱(图5c)。
对应东北亚低压强度在 1990年代初期后的减弱,东亚北部地区上空对流层中层位势高度也显著增加。图6a是以110°~130°E纬向平均为剖面得到的1992~2004年减1979~1991年夏季平均位势高度异常垂直分布。在东亚北部地区上空,特别是45°~55°N范围内,从1000 hPa到200 hPa的位势高度均为正异常,表现为正压结构;在对流层中低层,位势高度正异常通过了显著性水平 0.05的检验。另外,在其南侧的40°N附近位势高度经向梯度增强,对应地转东风异常。图 6b是后一时段减前一时段夏季平均的200 hPa纬向风异常,其中紫色的线是200 hPa夏季纬向风的平均态。从图6中可以看出,对应1991年以后夏季东北亚低压减弱,在东亚地区上空,特别是90°~130°E范围内为显著的东风异常,与图 6a中该地区上空经向位势梯度增加一致。该东风异常显著减弱了东亚高空西风急流强度。Kwon et al.(2007)分析东亚地区高空西风急流的年代际变化特征,同样也指出在 1990年代初之后急流强度显著减弱,这与我们当前分析得到的结果一致。
5 1990年代初夏季东北亚低压年代际转变的可能原因
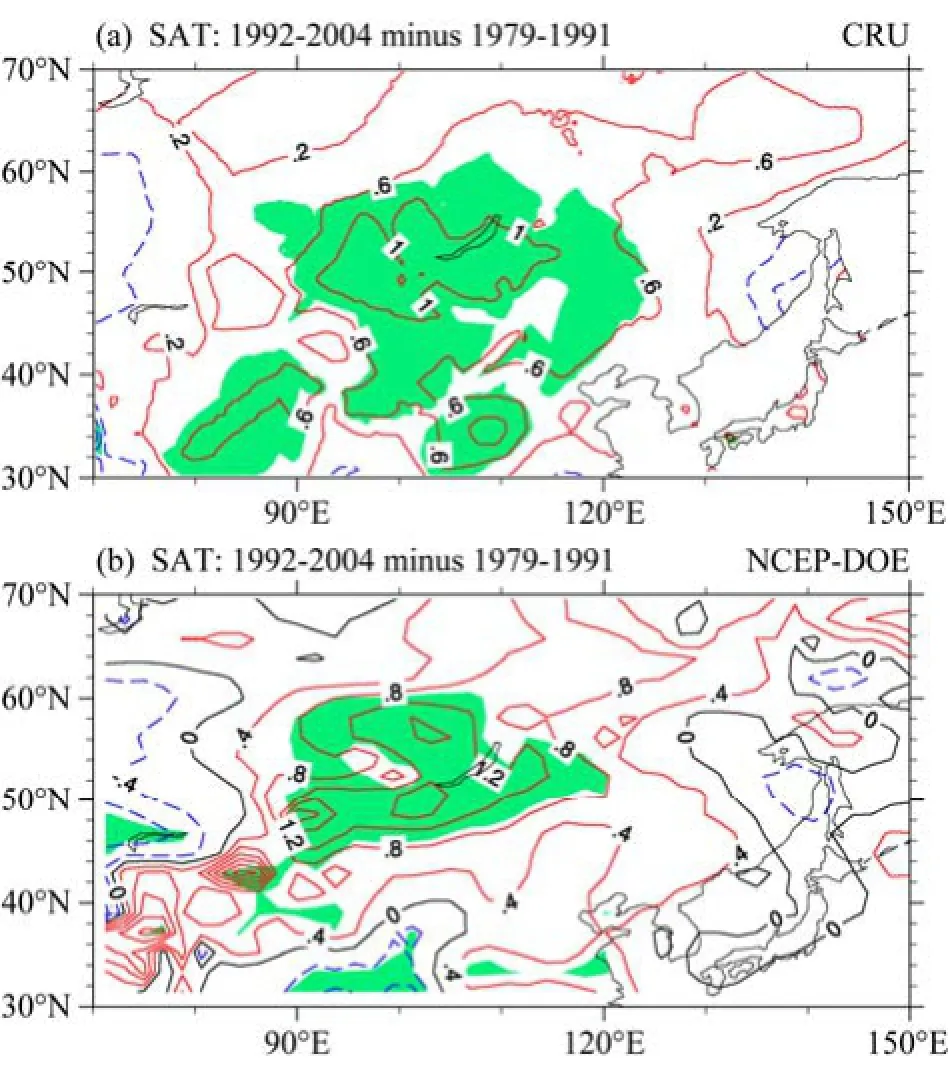
图7 1979~1991年和1992~2004年夏季平均的地面气温合成差值场(等值线,单位:°C),其中(a)和(b)分别为基于CRU和NCEP-DOE再分析数据Fig. 7 The differences in surface air temperature (isolines, units: °C) between 1992–2004 and 1979–1991 based on (a) CRU and (b) NCEP-DOE reanalysis
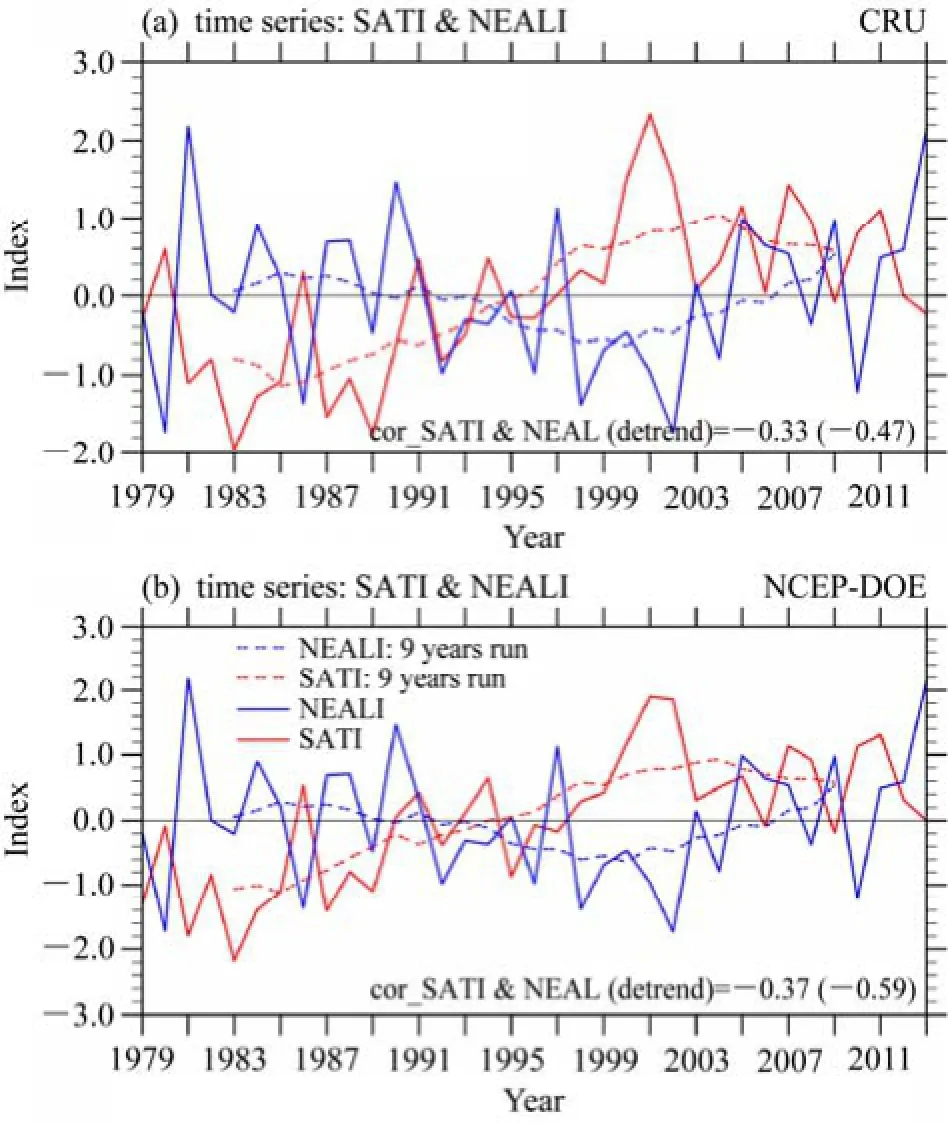
图8 基于(a)CRU和(b)NCEP-DOE数据计算得到的环贝加尔湖地区平均的(45°~60°N,90°~120°E)地表大气温度指数(红色实线)和基于NCEP-DOE计算得到的东北亚低压强度指数(蓝色实线)的标准化时间序列。虚线是9年滑动平均的结果Fig.8 Standardized time series of the surface air temperature index (SATI, red line) averaged over the region around the Lake Baikal (45°–60°N, 90°–120°E) based on the (a) CRU and (b) NCEP-DOE reanalysis data and the NEAL index (blue line) based on the NCEP-DOE reanalysis data during 1979–2013, and their 9-year running means (dashed lines)
在上面的分析中,我们指出夏季东北亚低压在1990年代初存在显著的年代际转变,对应1991年之后其强度显著减弱。在本小节中,我们将探讨其年代际转变的可能原因。图7是1992~2004年与1979~1991年夏季平均地表气温差值。1991年之后,东北亚地区地表气温有明显增加,显著增温的区域出现在环贝加尔湖地区。Zhu et al.(2012)分析了环贝加尔湖地区近 50年的温度趋势,指出该地区地表增暖趋势对应对流层低层异常的反气旋。此外,Chen and Lu(2014)进一步指出,除了显著的增暖趋势变化以外,东北亚地区的地表气温在1990年代中期还存在一次显著的年代际转变,这与本研究中图7揭示出的1990年代初以后环贝加尔湖地区的气温增加一致。用(45°~60°N,90°~120°E)区域平均的地表气温定义了地表气温指数,来考察环贝加尔湖地区地表气温和东北亚低压的关系。图8a给出了1979~2013年东北亚低压指数和基于 CRU气温资料得到的地表气温指数的时间序列。两者变化为负相关关系,相关系数为-0.33;去趋势之后,两者的相关系数为-0.47,通过了显著性水平0.05的检验。9年滑动的序列可以看到东北亚低压和环贝加尔湖地区地表气温均在 1990年代初前后存在年代际变化,分别对应东北亚低压强度减弱和环贝加尔湖地区地表气温增暖。这暗示东北亚低压强度的年代际变化可能受到环贝加尔湖地区地表气温年代际变化的影响。基于NCEP-DOE地表气温数据的分析也得到类似结果(图8b)。
为了探究环贝加尔湖地区地表增暖对夏季东北亚低压年代际变化的可能影响,我们采用一个线性干绝热斜压大气原始方程数值模式 LBM (Watanabe and Kimoto, 2000)来探讨大气环流对环贝加尔湖地区异常增温的响应。在该数值试验中,我们在环贝加尔湖地区放置一个中心最大值约为 2 K d−1的稳定加热源(图9a),其加热中心位于地表,并且随着高度的增加逐步减小,在对流层的上层接近于零(图9b)。图10给出了模式积分16~20天平均的结果,这主要是考虑到斜压大气环流模式中环流对于加热源的响应在第15天以后接近稳定(Jin and Hoskins,1995)。对应环贝加尔湖地区增暖,对流层低层的东北亚地区出现正位势高度异常(图10a),并且该位势高度异常在东北亚地区上空呈现正压结构,正位势高度中心出现在对流层上层(图10b)。同时,东亚地区高空西风急流强度减弱(图10c)。东亚地区对流层环流对环贝加尔湖地表增暖的响应与再分析资料中得到的 1991年后东北亚低压(图5c)、对流层中高层位势高度(图6a)及西风急流(图6b)的变化基本一致。该结果表明环贝加尔湖地区地表气温的增加导致东北亚低压强度在1990年代初之后显著减弱。
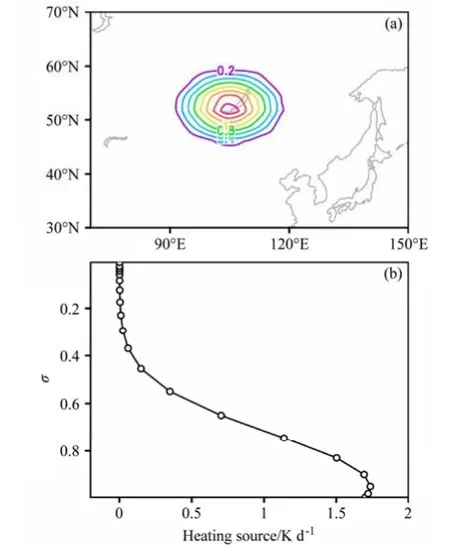
图9 线性斜压模式试验中加入的热源强迫:(a)等σ(σ=0.95)面(等值线间隔为0.2 Kd−1);(b)加热中心(52.5°N,105°E)的加热垂直廓线Fig. 9 (a) The heating source added to the linear baroclinic model at the sigma level of 0.95(the contour interval is 0.2K d−1); and (b) its vertical profile at the grid point of (52.5°N, 105°E)
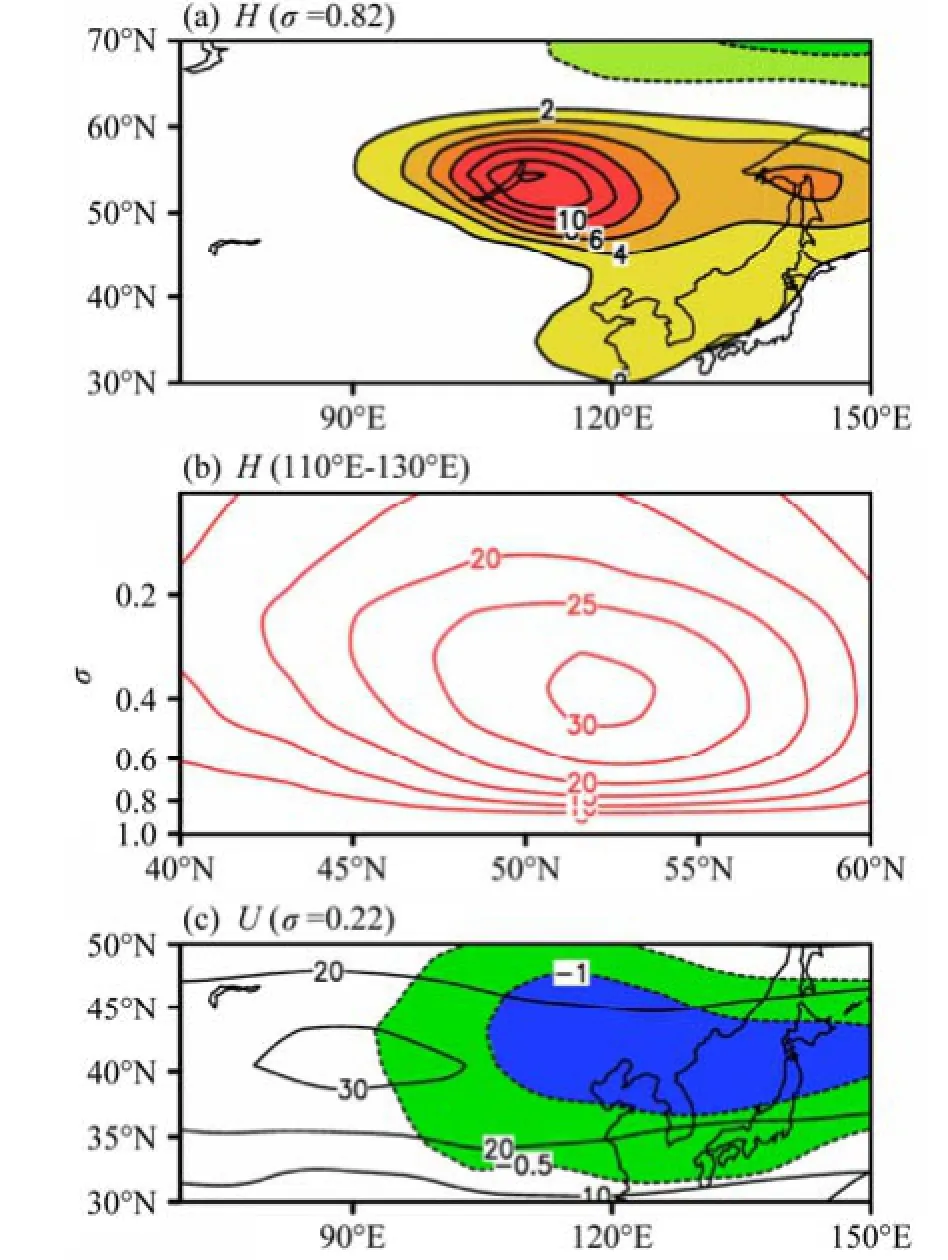
图10 干绝热斜压大气模式中大气环流第16~20天对图9中热源强迫的响应:(a)位势高度(σ=0.82)(等值线间隔为2 gpm);(b)110°~130°E纬向平均的位势高度垂直分布(等值线间隔为5 gpm);(c)纬向风(σ=0.22),阴影和间隔为0.5 m s−1的虚线代表加入热源后纬向风的变化,间隔为10 m s−1的实线代表纬向风的气候平均态。Fig. 10 Response of the atmospheric circulation to the heating source shown in Fig. 9 averaged for days 16–20 simulated by the dry linear baroclinic model: (a) Geopotential height at the sigma level of 0.82, (the contour interval is 2 gpm); (b) vertical distribution of zonal-mean geopotential height over 110°–130°E (the contour interval is 5 gpm); (c) zonal wind at the sigma level of 0.22 shading area and dash lines with the interval of 0.5 m s−1indicate the change of zonal wind, and solid lines with the interval of 10m s−1indicatethe climatology of zonal winds at 200 hPa.
为了解地表增温导致东北亚低压强度减弱的具体过程,本文对数值试验的涡度结果进行分析。考虑到在线性斜压模式中,大气环流对热源的响应在 15天以后基本达到稳定,相对涡度的局地变化项约等于0。同时不考虑摩擦,线性涡度方程可描述为
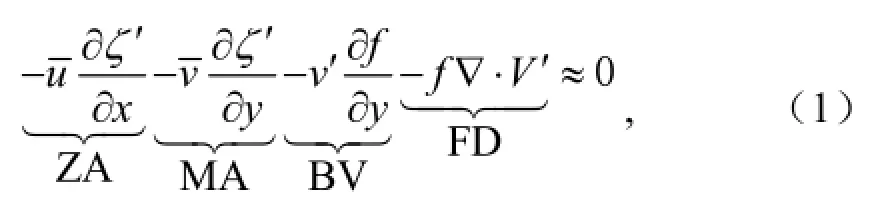
其中,ζ表示相对涡度;V(u,v)表示水平风矢量,u为纬向风速,v为经向风速;f为科氏力参数;带横杠项表示平均态,带撇项表示扰动项(线性斜压模式结果中第16~20天平均的响应)。ZA和MA分别表示涡度扰动的纬向和经向平均平流项,BV表示异常风场引起的地转涡度水平平流项,FD表示水平风场扰动辐合辐散对涡度的影响。图 11是对流层中层第 16~20天平均的涡度方程中各分量的贡献, 可以看出在东北亚地区,涡度变化主要是由纬向平流项和辐合辐散项决定。其中FD为负值,表明辐散使得涡度减少,对应反气旋异常形成。另一主导项ZA为正值,表明纬向输送正涡度平流,平衡散度项造成的涡度损失。由此可以看出环贝加尔湖地区地表加热主要是通过引起气流辐散形成反气旋异常,导致东北亚低压减弱。
关于环贝加尔湖地区气温升高的原因,一些研究指出这可能来自于全球变暖(Zhu et al.,2012)和太平洋年代际振荡(PDO;Zhu et al.,2011)的影响。根据有和无温室气体强迫的两组大气环流模式数值试验的对比分析,Zhu et al.(2012)提出全球温室气体增加引起的全球变暖可能导致环贝加尔湖地区局地气温的升高。此外,Zhu et al.(2011)也发现PDO在1990年代从正位相向负位相转变,这也可能导致环贝加湖地区气温升高。虽然模式模拟出了全球变暖和 PDO引起的环贝加尔湖地区气温增暖,但相关的物理过程目前尚不清楚,这还需要进一步的研究。
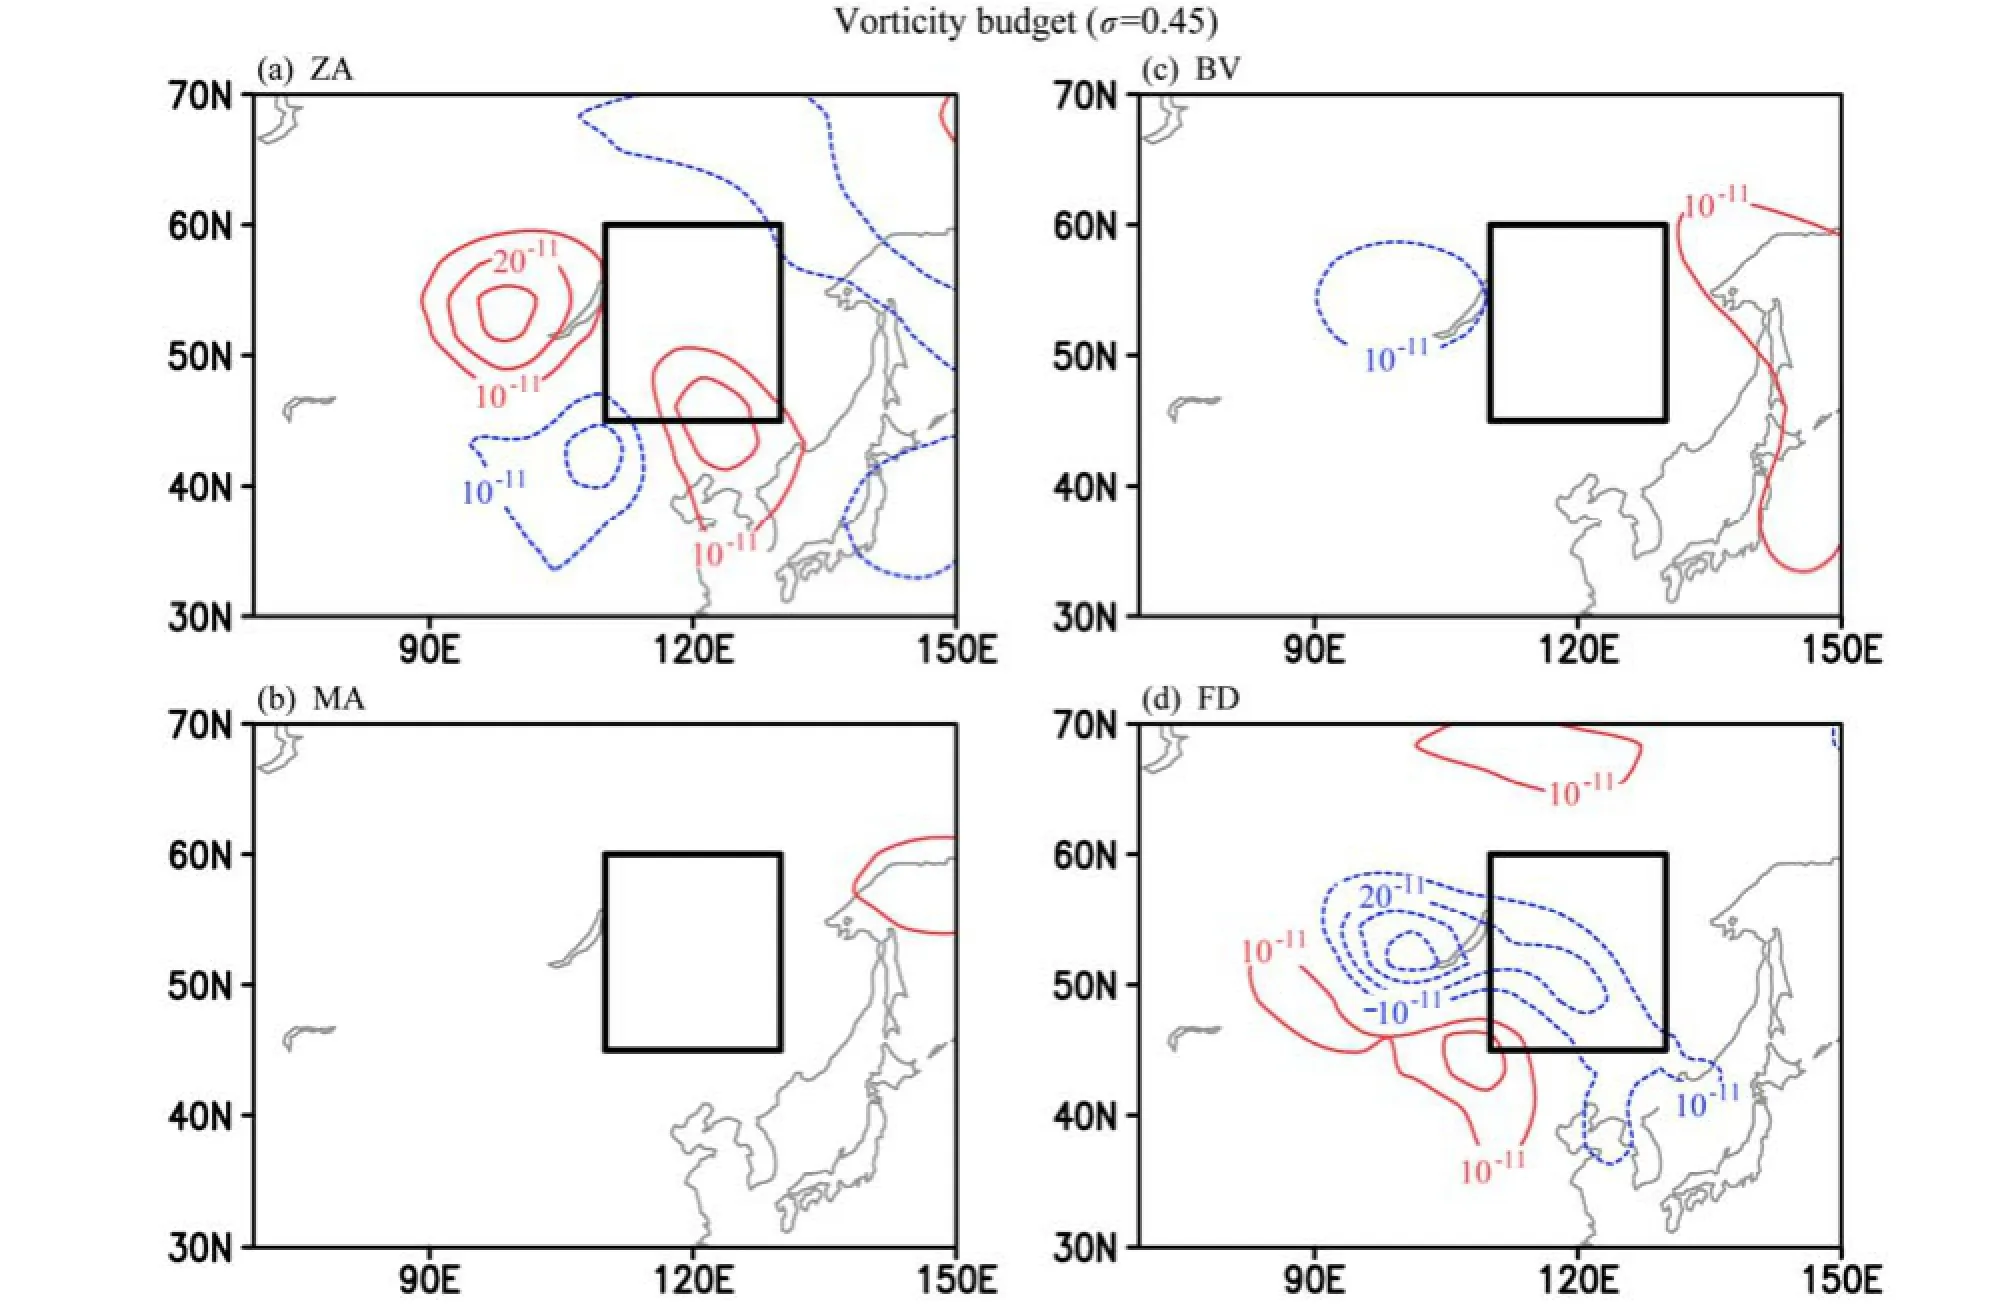
图11 同图10,但为涡度方程中各分量(σ=0.45):(a)ZA表示涡度扰动的纬向;(b)MA表示经向平均平流项;(c)BV表示异常风场引起的地转涡度水平平流项;(d)FD表示水平风场扰动辐合辐散对涡度的影响;等值线间隔为1×10⁻¹¹s−2Fig. 11 Same as Fig. 10, but for the components of the vorticity equation at the sigma level of 0.45. (a) ZA and (b) MA represent zonal- and meridional-mean advection of vorticity fluctuation, respectively, (c) BVrepresents horizontal advection of geostrophic vorticity caused by wind anomaly, and (d) FD represents the effects of divergence of horizontal wind on vorticity. The contour interval is 1×10⁻¹¹s−2.
6 结论和讨论
本文分析了夏季东北亚低压的年代际变化特征,在此基础上进一步探讨了其年代际变化的可能物理成因,得到主要结论如下:
(1)本文利用 NCEP-DOE资料研究了东北亚低压的基本特征,发现该低压中心仅出现在夏季的对流层低层,位于我国东北地区北部。
(2)NCEP-DOE、NCEP/NCAR、ERA-40和ERA-Interim四种再分析资料均揭示了夏季东北亚低压在 1991年前后出现一次显著的年代际转变,表现为 1991年以后夏季东北亚低压强度减弱。对应此次年代际转变,东北亚地区对流层环流呈现正压结构的位势高度增加,其南侧的高空西风急流中心强度减弱。
(3)与1991年后东北亚低压强度减弱相对应,环贝加尔湖地区夏季平均地表气温在 1991年之后显著增加。通过简单线性斜压模式模拟的东亚地区对流层环流对环贝加尔湖加热的响应和再分析资料中 1991年前后的变化基本一致:东北亚地区位势高度增加,并且在整个对流层表现为正压结构;同时其南侧的东亚高空西风急流强度减弱。涡度分析的结果表明,涡度变化主要是由纬向平流项和辐合辐散项决定。辐散使得涡度减少,对应反气旋异常形成;纬向输送正涡度平流,平衡散度项造成的涡度损失。以上结果说明环贝加尔湖地区地表加热主要是通过引起气流辐散形成反气旋异常,导致1990年代初之后夏季东北亚低压减弱。
徐康等(2011a,2011b)也注意到环贝加尔湖地区气温升高对应的局地反气旋环流异常。他们提出环贝加尔湖地区气温升高导致该地区对流层温度梯度和纬向风垂直梯度的减小,使得大气斜压型减弱,容易维持暖性异常反气旋。但是,局地异常的反气旋也可能导致该地区盛行下沉气流,云量减少,导致局地温度升高。因此,基于再分析数据诊断研究无法区分环贝加尔湖地区气温和环流之间的相互影响。在本研究中,基于数值模式试验的结果,我们从动力学的角度探讨了大气环流对环贝加尔湖地区增暖的响应,揭示出环贝加尔湖地区气温升高导致了该地区异常的反气旋环流和东北亚低压强度在 1990年代初之后显著减弱。这一结论支持了徐康等(2011a,2011b)观测分析得到的结果。但是,由于本研究采用的是线性数值模式,没有考虑到中高纬度地区地表气温和大气环流之间复杂的非线性相互作用。因此,对于地表增温引起反气旋异常的内在机理存在一定的不确定性。
有研究指出 1990年代初期以后,对应夏季东北亚低压强度减弱,东亚夏季风也存在显著的年代际转变(唐佳和武炳义,2012;Liu et al.,2012),华南地区降水增多(Huang et al.,2004;张庆云等,2007;Ding et al.,2008;Wu et al., 2010;黄荣辉等,2011;吕俊梅等,2014)。但是,对于夏季东北亚低压强度减弱和华南降水之间的年代际关联目前尚存在争议。一方面,Wu et al.(2010)指出在1992年后华南降水显著增加受到中国北部和蒙古地区的反气旋异常的影响,后者与前期春季青藏高原雪盖的变化有关。另一方面,Kwon et al.(2007)提出华南地区降水增强可能通过激发一个正压的Rossby波列向热带外传播,在东北亚地区上空形成反气旋异常,这可能导致东北亚低压强度在 1990年代初以后减弱。因此,夏季东北亚低压和东亚夏季风年代际变之间的关联需要借助更长时间段的观测资料分析和数值模式模拟作进一步的研究。
参考文献(References)
Chen W, Lu R Y. 2014. A decadal shift of summer surface air temperature over Northeast Asia around the mid-1990s [J]. Adv. Atmos. Sci., 31 (4): 735–742, doi:10.1007/s00376-013-3154-4.
Dee D P, Uppala S M, Simmons A J, et al. 2011. The ERA-Interim reanalysis: Configuration and performance of the data assimilation system [J]. Quart. J. Roy. Meteor. Soc., 137 (656): 553–597, doi:10. 1002/qj.828.
Ding Y H, Wang Z Y, Sun Y. 2008. Inter-decadal variation of the summer precipitation in East China and its association with decreasing Asian summer monsoon. Part I: Observed evidences [J]. Int. J. Climatol., 28 (9): 1139–1161, doi:10.1002/joc.1615.
郭其蕴. 1983. 东亚夏季风强度指数及其变化的分析 [J]. 地理学报, 38 (3): 207–217. Guo Qiyun. 1983. The summer monsoon intensity index in East Asia and its variation [J]. Acta Geographica Sinica (in Chinese), 38 (3): 207–217.
Harris I, Jones P D, Osborn T J, et al. 2014. Updated high-resolution grids of monthly climatic observations—The CRU TS3.10 Dataset [J]. Int. J. Climatol., 34 (3): 623–642, doi:10.1002/joc.3711.
Huang R H, Huang G, Wei Z G. 2004. Climate variations of the summer monsoon over China [M]// Chang C P. East Asian Monsoon. Singapore: World Scientific Publishing Co. Pte. Ltd., 213–270.
黄荣辉, 陈际龙, 刘永. 2011. 我国东部夏季降水异常主模态的年代际变化及其与东亚水汽输送的关系 [J]. 大气科学, 35 (4): 589–606. Huang Ronghui, Chen Jilong, Liu Yong. 2011. Interdecadal variation of the leading modes of summertime precipitation anomalies over eastern China and its association with water vapor transport over East Asia [J]. Chinese Journal of Atmospheric Sciences (in Chinese), 35 (4): 589–606, doi:10.3878/j.issn. 1006-9895.2011.04.01.
Jin F F, Hoskins B J. 1995. The direct response to tropical heating in a baroclinic atmosphere [J]. J. Atmos. Sci., 52(3): 307–319, doi:10.1175/1520-0469(1995)052<0307:TDRTTH>2.0.CO;2.
Kalnay E, Kanamitsu M, Kistler R, et al. 1996. The NCEP/NCAR 40-year reanalysis project [J]. Bull. Amer. Meteor. Soc., 77 (3): 437–471, doi:10.1175/1520-0477(1996)077<0437:TNYRP>2.0.CO;2.
Kanamitsu M, Ebisuzaki W, Woollen J, et al. 2002. NCEP-DOE AMIP-II reanalysis (R-2) [J]. Bull. Amer. Meteor. Soc., 83 (11): 1631–1643, doi:10.1175/BAMS-83-11-1631.
Kwon M H, Jhun J G, Ha K J. 2007. Decadal change in East Asian summer monsoon circulation in the mid-1990s [J]. Geophys. Res. Lett., 34 (21): L21706, doi:10.1029/2007GL031977.
Lee S S, Seo Y W, Ha K J, et al. 2013. Impact of the western North Pacific subtropical high on the East Asian monsoon precipitation and the Indian Ocean precipitation in the boreal summertime [J]. Asia–Pacific J. Atmos. Sci., 49 (2): 171–182, doi:10.1007/s13143-013-0018-x.
Lin Z D. 2014. Intercomparison of the impacts of four summer teleconnections over Eurasia on East Asian rainfall [J]. Adv. Atmos. Sci., 31 (6): 1366–1376, doi:10.1007/s00376-014-3171-y.
Lin Z D, Wang B. 2015. Northern East Asian low and its impact on the interannual variation of East Asian summer rainfall [J]. Climate Dyn., doi:10.1007/s00382-015-2570-9.
柳艳香, 郭裕福. 2005. 中高纬度气压系统异常对东亚夏季风年代际变化的影响 [J]. 高原气象, 24 (2): 129–135. Liu Yanxiang, Guo Yufu. 2005. Impact of pressure system anomaly over mid-high latitude on the interdecadal change of East Asia summer monsoon [J]. Plateau Meteorology (in Chinese), 24 (2): 129–135, doi:10.3321/j.issn:1000-0534.2005.02.001.
刘屹岷, 吴国雄, 刘辉, 等. 1999. 空间非均匀加热对副热带高压形成和变异的影响——III: 凝结潜热加热与南亚高压及西太平洋副高 [J].气象学报, 57 (5): 525–538. Liu Yimin, Wu Guoxiong, Liu Hui, et al. 1999. The effect of spatially nonuniform heating on the formation and variation of subtropical high. Part III: Condensation heating and South Asia high and western Pacific subtropical high [J]. Acta Meteor. Sinica (in Chinese), 57 (5): 525–538, doi:10.11676/qxxb1999.051.
Liu H W, Zhou T J, Zhu Y X, et al. 2012. The strengthening East Asia summer monsoon since the early 1990s [J]. Chin. Sci. Bull., 57 (13): 1553–1558, doi:10.1007/s11434-012-4991-8.
Lu R Y. 2001. Interannual variability of the summertime North Pacific subtropical high and its relation to atmospheric convection over the warm pool [J]. J. Meteor. Soc. Japan, 79 (3): 771–783, doi:10.2151/jmsj.79.771.
Lu R Y. 2002. Indices of the summertime western North Pacific subtropical high [J]. Adv. Atmos. Sci., 19 (6): 1004–1028, doi:10.1007/s00376-002-0061-5.
Lu R Y, Dong B W. 2001. Westward extension of North Pacific subtropical high in summer [J]. J. Meteor. Soc. Japan, 79 (6): 1229–1241, doi:10. 2151/jmsj.79.1229.
吕俊梅, 祝从文, 琚建华, 等. 2014. 近百年中国东部夏季降水年代际变化特征及其原因 [J]. 大气科学, 38 (4): 782–794. Lü Junmei, Zhu Congwen, Ju Jianhua, et al. 2014. Interdecadal variability in summer precipitation over East China during the past 100 years and its possible causes [J]. Chinese Journal of Atmospheric Sciences (in Chinese), 38 (4): 782–794, doi:10.3878/j.issn.1006-9895.1401.13227.
慕巧珍, 王绍武, 朱锦红, 等. 2001. 近百年夏季西太平洋副热带高压的变化 [J]. 大气科学, 25 (6): 787–797. Mu Qiaozhen, Wang Shaowu, Zhu Jinhong, et al. 2001. Variations of the western Pacific subtropical high in summer during the last hundred years [J]. Chinese Journal of Atmospheric Sciences (in Chinese), 25 (6): 787–797, doi:10.3878/j. issn.1006-9895.2001.06.06.
Sui C H, Chung P H, Li T. 2007. Interannual and interdecadal variability of the summertime western North Pacific subtropical high [J]. Geophys. Res. Lett., 34 (11): L11701, doi:10.1029/2006GL029204.
唐佳, 武炳义. 2012. 20世纪90年代初东亚夏季风的年代际转型 [J]. 应用气象学报, 23 (4): 402–413. Tang Jia, Wu Bingyi. 2012. Inter-decadal shift of East Asian summer monsoon in the early 1990s [J]. J. Appl. Meteor. Sci. (in Chinese), 23 (4): 402–413, doi:10.3969/j.issn.1001-7313. 2012.04.003.
陶诗言, 朱福康. 1964. 夏季亚洲南部 100毫巴流型的变化及其与西太平洋副热带高压进退的关系 [J]. 气象学报, 34 (4): 385–396. Tao Shiyan, Zhu Fukang. 1964. The 100-mb flow patterns in southern Asia in summer and its relation to the advance and retreat of the West-Pacific subtropical anticyclone over the Far East [J]. Acta Meteor. Sinica (in Chinese), 34 (4): 385–396.
Tao S Y, Chen L X. 1987. A review of recent research on the East Asian summer monsoon in China [M]// Chang C P, Krishnamurti T N. Monsoon Meteorology. Oxford: Oxford University Press, 60–92.
Uppala S M, Kallberg P W, Simmons A J, et al. 2005. The ERA-40 re-analysis [J]. Quart. J. Roy. Meteor. Soc., 131 (612): 2961–3012, doi:10.1256/qj.04.176.
王柏钧, 陈刚毅. 1992. 北太平洋海表温度与500hPa西太平洋副高和极涡相互作用的统计分析 [J]. 大气科学, 16 (3): 263–273. Wang Baijun, Chen Gangyi. 1992. A statistical analysis of the interaction among sea surface temperature in the North Pacific, 500 hPa subtropical high in the western Pacific and polar vortex [J]. Chinese Journal of Atmospheric Sciences (Scientia Atmos. Sinica) (in Chinese), 16 (3): 263–273, doi:10.3878/j.issn. 1006-9895.1992.03.02.
Watanabe M, Kimoto M. 2000. Atmosphere-ocean thermal coupling in the North Atlantic: A positive feedback [J]. Quart. J. Roy. Meteor. Soc., 126(570): 3343–3369, doi:10.1002/qj.49712657017.
武炳义, 张人禾. 2011. 东亚夏季风年际变率及其与中、高纬度大气环流以及外强迫异常的联系 [J]. 气象学报, 69 (2): 219–233. Wu Bingyi, Zhang Renhe. 2011. Interannual variability of the East Asian summer monsoon and its association with the anomalous atmospheric circulation over the mid-high latitudes and external forcing [J]. Acta Meteor. Sinica (in Chinese), 69 (2): 219–233.
吴国雄, 丑纪范, 刘屹岷, 等. 2002. 副热带高压形成和变异的动力学问题[M]. 北京: 科学出版社, 314pp. Wu Guoxiong, Chou Jifan, Liu Yimin, et al. 2002. Dynamics of the Formation and Variation of Subtropical Anticyclones (in Chinese) [M]. Beijing: Science Press, 314pp.
Wu R G, Wen Z P, Yang S, et al. 2010. An interdecadal change in southern China summer rainfall around 1992/93 [J]. J. Climate, 23 (9): 2389–2403, doi:10.1175/2009JCLI3336.1.
徐康, 祝从文, 何金海. 2011a. 近50年环贝加尔湖区变暖对中国华北夏季降水的影响机理 [J]. 高原气象, 30 (2): 309–317. Xu Kang, Zhu Congwen, He Jinhai. 2011a. Impact of the surface air temperature warming around Lake Baikal on trend of summer precipitation in NorthChina in the past 50 years [J]. Plateau Meteorology (in Chinese), 30 (2): 309–317.
徐康, 何金海, 祝从文. 2011b. 近50年中国东部夏季降水与贝加尔湖地表气温年代际变化的关系 [J]. 气象学报, 69 (4): 570–580. Xu Kang, He Jinhai, Zhu Congwen. 2011b. The interdecadal linkage of the summer precipitation in eastern China with the surface air temperature over Lake Baikal in the past 50 years [J]. Acta Meteor. Sinica (in Chinese), 69 (4): 570–580.
Yeo S R, Jhun J G, Kim W M. 2012. Intraseasonal variability of western North Pacific subtropical high based on the El Niño influence and its relationship with East Asian summer monsoon [J]. Asia−Pacific J. Atmos. Sci., 48 (1): 43–53, doi:10.1007/s13143-012-0005-7.
张庆云, 陶诗言. 1998. 亚洲中高纬度环流对东亚夏季降水的影响 [J].气象学报, 56 (2): 199–211. Zhang Qingyun, Tao Shiyan. 1998. Influence of Asian mid–high latitude circulation on East Asian summer rainfall [J]. Acta Meteor. Sinica (in Chinese), 56 (2): 199–211, doi:10.11676/qxxb1998.019.
张庆云, 吕俊梅, 杨莲梅, 等. 2007. 夏季中国降水型的年代际变化与大气内部动力过程及外强迫因子关系 [J]. 大气科学, 31 (6): 1290–1300. Zhang Qingyun, Lü Junmei, Yang Lianmei, et al. 2007. The interdecadal variation of precipitation pattern over China during summer and its relationship with the atmospheric internal dynamic processes and extra-forcing factors [J]. Chinese Journal of Atmospheric Sciences (in Chinese), 31 (6): 1290–1300, doi:10.3878/j.issn.1006-9895.2007.06.23.
周明煜, 杨广基, 宋正山, 等. 1980. 夏季西太平洋副热带高压的模拟试验 [J]. 大气科学, 4 (1): 12–20. Zhou Mingyu, Yang Guangji, Song Zhengshan, et al. 1980. The experimental simulation of the western Pacific subtropical high in summer [J]. Chinese Journal of Atmospheric Sciences (in Chinese), 4 (1): 12–20, doi:10.3878/j.issn.1006-9895. 1980.01.02.
Zhu C W, Wang B, Qian W H, et al. 2012. Recent weakening of northern East Asian summer monsoon: A possible response to global warming [J]. Geophys. Res. Lett., 39 (9): L09701, doi:10.1029/2012GL051155.
Zhu Y L, Wang H J, Zhou W, et al. 2011. Recent changes in the summer precipitation pattern in East China and the background circulation [J]. Climate Dyn., 36(7–8): 1463–1473, doi:10.1007/s00382-010-0852-9.
资助项目 国家自然科学基金项目41375086
Funded by National Natural Science Foundation of China (Grant 41375086)
文章编号1006-9895(2016)04-0805-12 中国分类号 P424
文献标识码A
doi:10.3878/j.issn.1006-9895.1511.15178
收稿日期2015-04-08;网络预出版日期 2015-11-06
作者简介杜梦醒,女,1990年出生,博士研究生,研究方向为气候动力学。E-mail: dumx@mail.iap.ac.cn通讯作者 林中达,E-mail: zdlin@mail.iap.ac.cn
Inter-decadal Change in the Summertime Northeast Asia Low-Pressure System in the Early 1990s
DU Mengxing1, 2, LIN Zhongda1, and LU Riyu1
1 State Key Laboratory of Numerical Modeling for Atmospheric Sciences and Geophysical Fluid Dynamics, Institute of Atmospheric Physics, Chinese Academy of Sciences, Beijing 100029
2 University of Chinese Academy of Sciences, Beijing 100049
AbstractEast Asian summer climate is controlled by a low pressure system centered over continental northern East Asia in the lower troposphere, which is named as the Northeast Asia low pressure (NEAL). Based on the NCEP-DOE, NCEP-NCAR, ERA-40, and ERA-Interim reanalysis data, we investigate the inter-decadal change of the summertime Northeast Asia Low-pressure system and discuss the possible physical mechanism associated with this change. Results show that NEAL experienced a significant decadal change in the early 1990s. The intensity of NEAL has decreased since 1991. Corresponding to the weakened NEAL, the tropospheric geopotential height field over Northeast Asia presents a barotropic-structure positive anomaly and the intensity of upper-tropospheric westerly jet to the south decreases. Based on results from the observational analysis and simulations of a linear baroclinic model, it is found that the surface warming around the Lake Baikal in the summer may be responsible for the weakening of the NEAL after the early 1990s.
KeywordsSummertime Northeast Asia low pressure, Inter-decadal variability, Local warming around the Lake Baikal