Research of social desirability responding effect on 16PF in mental test context
2016-04-14 00:35:03WANGYou-Lin,MARu-Meng,DAIJing等
转化医学电子杂志 2016年1期
Research of social desirability responding effect on 16PF in mental test context
WANGYou-Lin1,MARu-Meng2,DAIJing1,LIXiao-Jing1,ZHANGLi-Li1,HUIDuo-Duo1,MAJin1,HUWen-dong1,XVBo3
1Faculty of Aerospace Medicine, Fourth Military Medical University, Xi’an 710032, China;2Department of Experimental Surgery, Tangdu Hospital, Fourth Military Medical University, Xi’an 710038, China;3Health Division, Department of School Affairs, Fourth Military Medical University, Xi’an 710032, China
【Abstract】 AIM: To examine whether the social desirability response has an effect on the structure validity of 16PF. After controlling for the effect of social desirability, it can improve the predictive validity of 16PF and accuracy of different selection decision. METHODS: A total of 1224 subjects were tested for two times and the interval was 7 months. The 16PF and the “Social Desirability Scale in Context of Psychological Screening”, were used to verify and clarify the social desirability response to the structure of 16PF and its impact on the secondary factor structure theory model. RESULTS: The social desirability response had a significant effect on the 16PF root traits, structure validity and the theoretical model of the secondary factors, but the influence was small and the influence was not significant. CONCLUSION: The structure validity of the 16PF is not significantly affected by the test motivation or social desirability, and the social desirability response in the psychological test of the military academy students will not have a significant impact on the structure validity of the personality test.
【Keywords】 social desirability; 16PF; structure validity; predictive validity
1Introduction
Social expectations reactions (socially desirability responding, SDR) are response biases in the corporate personnel selection, recruitment and screening such as students’ psychological testing process, the validity of the measure may have a serious impact on the data[1]. Today many foreign scholars on social expectations reactions and its impact on personality tests conducted in-depth research and summed up a lot of researches.
Many psychological researches discussed on the impact of social expectations personality test reactions, but did not come to the same conclusion[2]. And they tried to control the social expectations component of personality test scores, using social expectations of the correction personality test scores, but did not improve the predictive validity tests[3]. Scientific research is an ongoing “ask a question”-“problem solving” process, with the research method and technology continue to mature and the experimental conditions gradually improved[4]. On the basis of previous studies, advanced technology, testing processes and strict environmental control were evaluated to further explore the control method in the SDR personality tests, assess its impact on personality tests, the actual personnel selection, and psychological screening, and provide a reference.
2Methods
2.1StudyA total of 1224 students from a military school and who were enrolled in 2010 participated in the study, with 1200 (98%) males and 24 (2%) females, 959 (78.3%) non-military students and 265 (21.7%) military students. The age ranges from 17 to 24 years, with mean age being 19.6 years. Non-military students are high school grads, and military students are those who served in grassroots military units for two years after high school.
2.2Test tools
2.2.1The Cartel 16 Personality Factor Questionnaire (16PF)The Cartel 16 Personality Factor Questionnaire (16PF) was compiled by the American psychologist Cattel and published officially in 1949. It evaluates one’s personality by analyzing 16 independent personality traits. It was introduced to China in the early 1980s, and was revised by Department of Psychology, East China Normal University in 1989. Chinese revision of 16PF totally includes 187 questions, and test interval is two weeks. Test-retest reliability is 0.48~0.92[5].
2.2.2The new“Social Expectation Scale in Conscription”Social Expectation Scale in Conscription has good reliability and validity. It can reflect the social expectations of candidates in conscription more accurately.
2.3Experimental procedureAll subjects were tested twice. The first test was carried out on September 2010 and the second test on May 2011, with a seven-month interval. The test was strictly controlled, and standardized guidance was used. The content of the guidance was the same with the first part.
Psychology major students were the main subjects. The test used DXC-6 multiple psychological assessment instrument developed by Teaching and Research Office of School of Aerospace Medicine. Guidance and test questions were automatically played by the instrument.
2.4Statistical analysisSPSS13.0 statistical software and LISRE L 8.70 structural equation modeling analysis software were used for statistical data analysis. Statistical approaches mainly included Exploratory Factor Analysis (EFA), Confirmative Factor Analysis (CFA), correlation analysis, linear regression analysis,etc.
3Results
3.1Difference examination of factor score of two 16PF testsThe results of the two tests were compared by paired-samplettest. Difference effect value d was calculated. When d equals about 0.2, difference effect is small; when d equals about 0.5, the difference effect is moderate; when d equals about 0.8, the difference effect is significant[1]. For stability, persistency, boldness, openness to change, and self-discipline, the first test was significantly higher than that of the second test; for sensitivity, vigilance, abstractedness, anxiety, self-reliance, and tonicity, the first test was significantly lower than that of the second test(P<0.01); and for social boldness, aggressiveness, excitement, and sophistication, the difference was small according to the d value; for cognitive ability evaluated by intelligence factors, although statistically significant difference can be observed when at the level of 0.05, the absolute value of difference effect was 0.07, which was very small (Table 1).
Table 1Comparison of factor scores of the two 16PF tests

(x±s)
*Difference was statistically significant whenP<0.05;**difference was statistically significant whenP<0.01.
3.2Exploratory analysis of 16PF source traits structureFactor analysis was performed on the 16 source traits of the first test. Principle component analysis and maximum varimax rotation method were used to extract the characteristic root factor greater than 1 and list each source trait factor loading on the respective factor. Data of the second test also used the principal component analysis and the maximum variance rotation method. To make the result correspond to that of the first test, a fixed number of extraction factor of 4 was extracted, and each source trait factor loading on the respective factor was listed(Table 2). In addition to aggressiveness factor, factor analysis concluded that results of the first test were consistent with those of the second test, the same characteristics were grouped into the same factor, and no significant difference was observed in factor loading. Accumulating contribution rate of the four factors of the first test was 60% and that of the second test was 57%, with no significant difference between them. The results showed that different test scenarios and different motives did not have significant impact on construct validity of 16PF.
Table 2Exploratory factor analysis of 16PF of the two tests
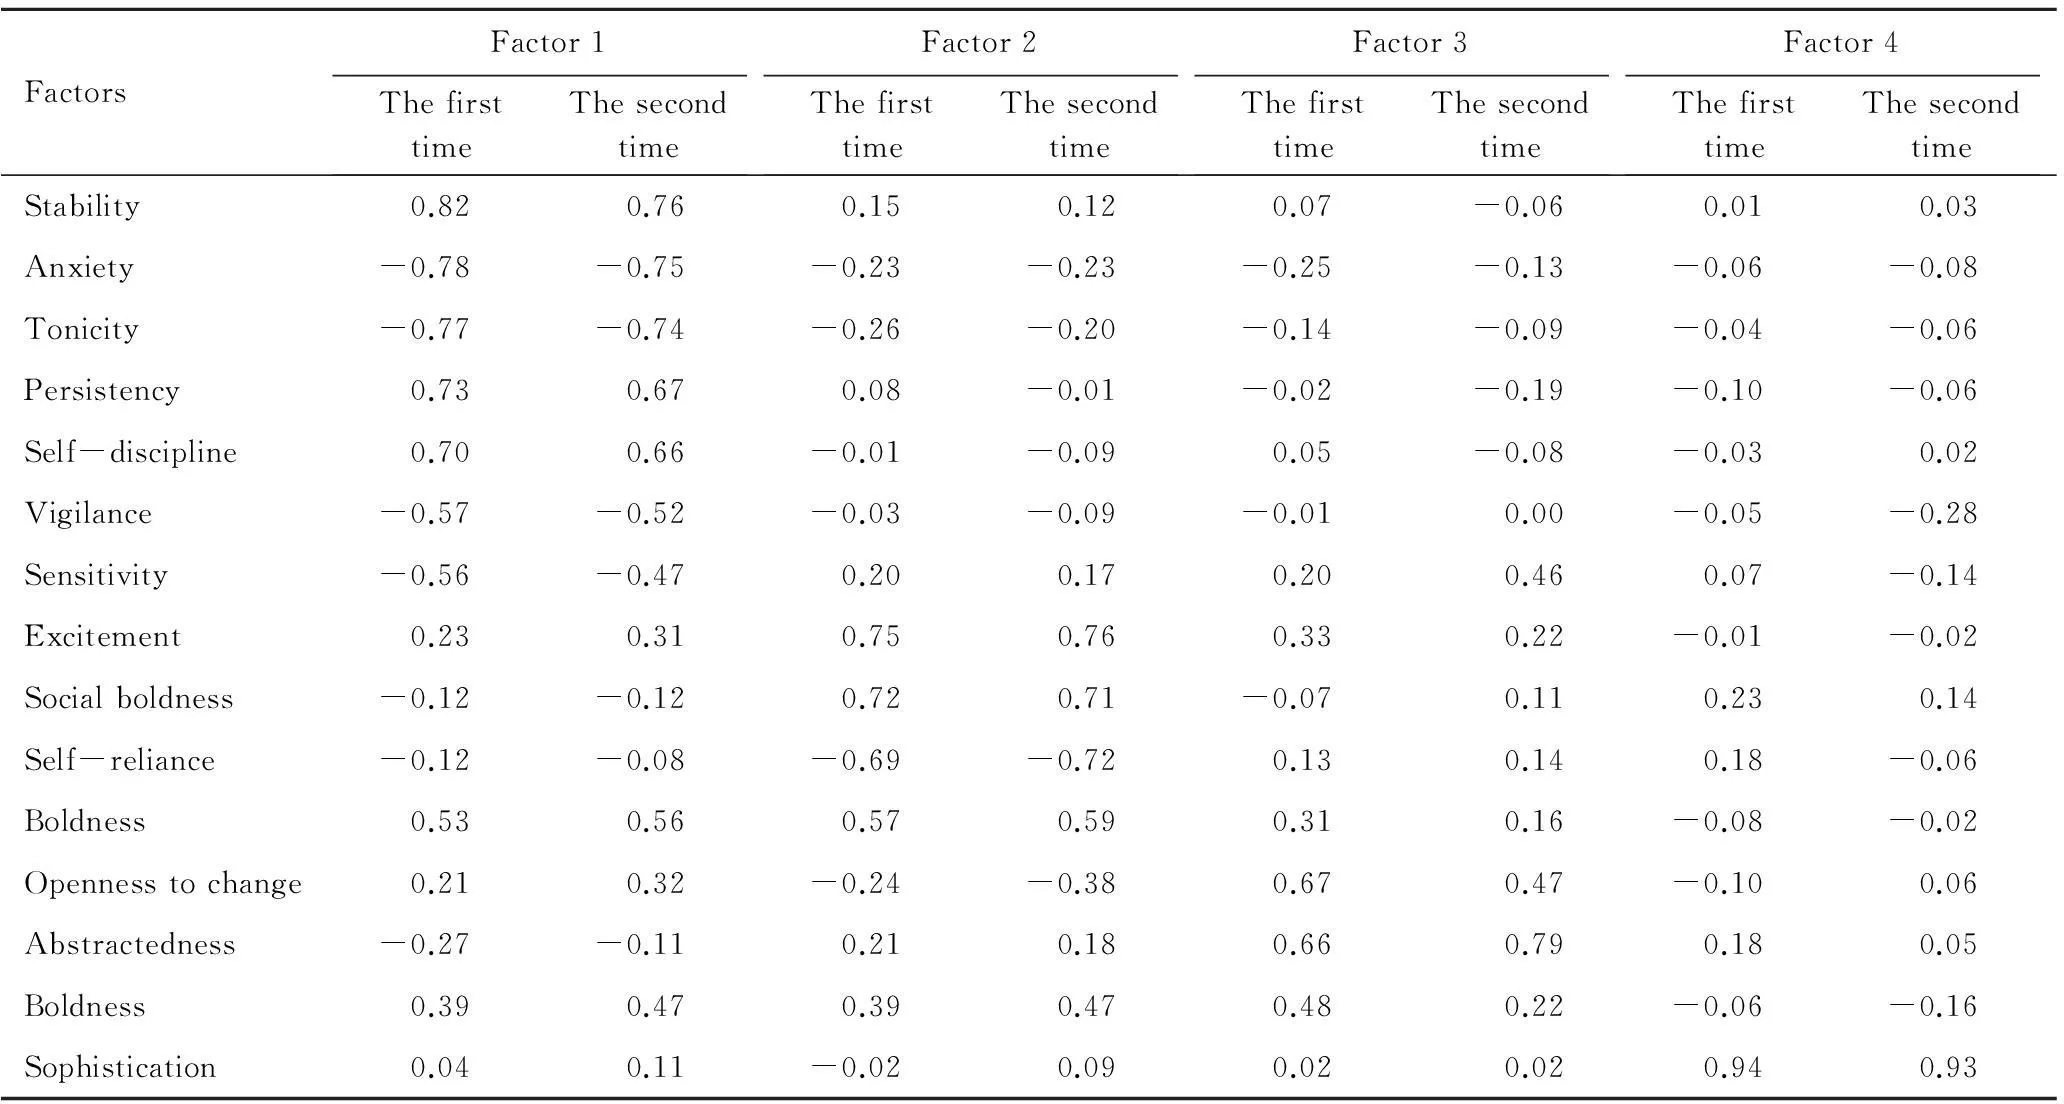
FactorsFactor1ThefirsttimeThesecondtimeFactor2ThefirsttimeThesecondtimeFactor3ThefirsttimeThesecondtimeFactor4ThefirsttimeThesecondtimeStability0.820.760.150.120.07-0.060.010.03Anxiety-0.78-0.75-0.23-0.23-0.25-0.13-0.06-0.08Tonicity-0.77-0.74-0.26-0.20-0.14-0.09-0.04-0.06Persistency0.730.670.08-0.01-0.02-0.19-0.10-0.06Self-discipline0.700.66-0.01-0.090.05-0.08-0.030.02Vigilance-0.57-0.52-0.03-0.09-0.010.00-0.05-0.28Sensitivity-0.56-0.470.200.170.200.460.07-0.14Excitement0.230.310.750.760.330.22-0.01-0.02Socialboldness-0.12-0.120.720.71-0.070.110.230.14Self-reliance-0.12-0.08-0.69-0.720.130.140.18-0.06Boldness0.530.560.570.590.310.16-0.08-0.02Opennesstochange0.210.32-0.24-0.380.670.47-0.100.06Abstractedness-0.27-0.110.210.180.660.790.180.05Boldness0.390.470.390.470.480.22-0.06-0.16Sophistication0.040.11-0.020.090.020.020.940.93
3.3Comparison of α coefficient of 16PF of the two testsα coefficient for each trait of the two tests was calculated as shown in Table 3. Although differences were observed between the two tests, the trends that reflected were almost the same. Stability, excitement, persistency, boldness, anxiety, and tonicity had better consistency and results of the two tests were similar. α coefficient of more than 0.7 occurred only in excitement. Intelligence, abstractedness, sophistication, and openness to change were lower than 0.3, or even presented as negative, and this may caused by that the questionnaire had not been amended for long time. Although, α coefficient of each source traits of 16PF was different and individual trait even less than 0.3 or presented as negative, internal reliability of the first test is slightly greater than that of the second, the trends that reflected were almost the same.
Table 3Comparison of α coefficient of 16PF of the two tests
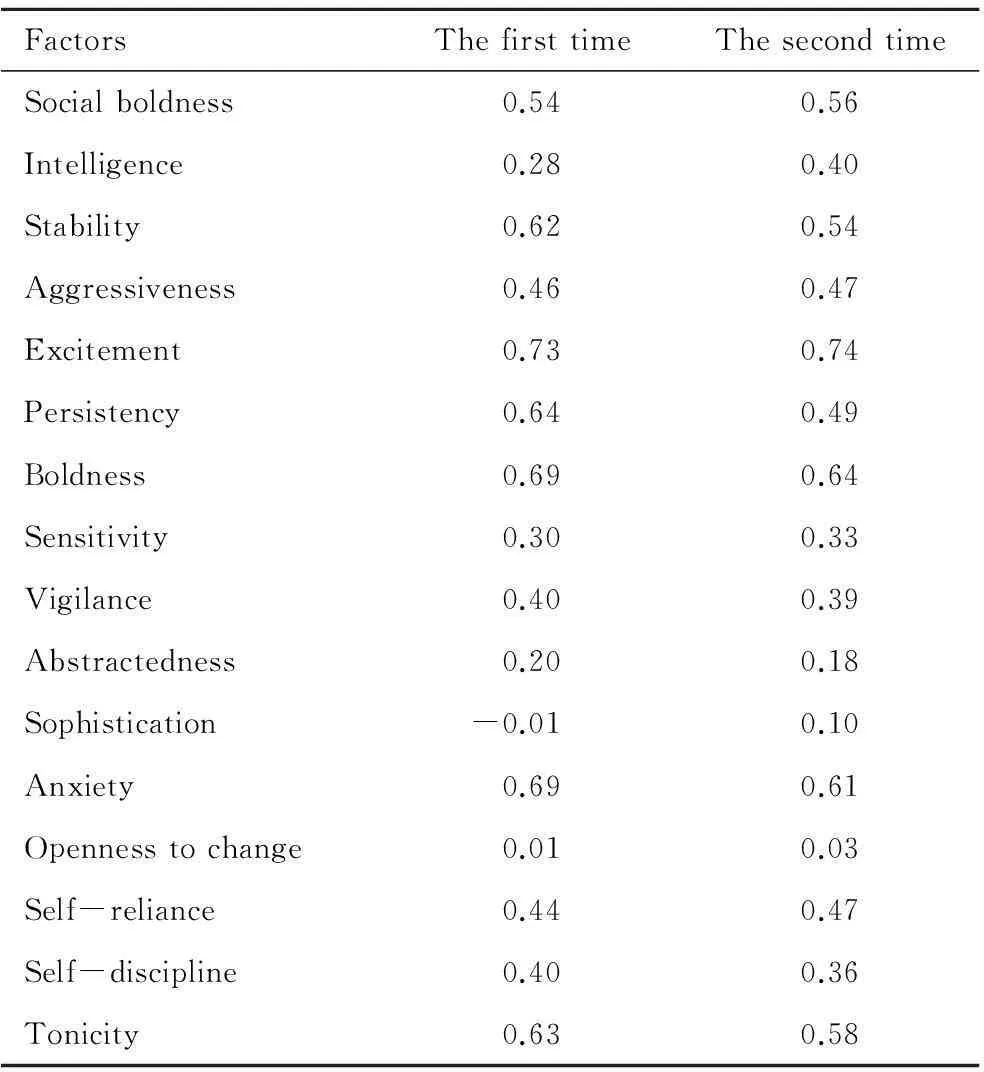
FactorsThefirsttimeThesecondtimeSocialboldness0.540.56Intelligence0.280.40Stability0.620.54Aggressiveness0.460.47Excitement0.730.74Persistency0.640.49Boldness0.690.64Sensitivity0.300.33Vigilance0.400.39Abstractedness0.200.18Sophistication-0.010.10Anxiety0.690.61Opennesstochange0.010.03Self-reliance0.440.47Self-discipline0.400.36Tonicity0.630.58
3.4Confirmation of the theoretical model of 16PF secondary factorMulti-group confirmatory factor analysis was used to confirm the theoretical model of the 16PF. The diagram of the theoretical model was shown in Figure 1. The structural model was developed by Karnofsky after years of experimental research and statistical analysis, including the adaptation and anxiety type, introversion and extroversion type, impetuous action and undisturbed intellect type, as well as coward and resolute type. Its correspondence with the source traits was shown in Figure 1.
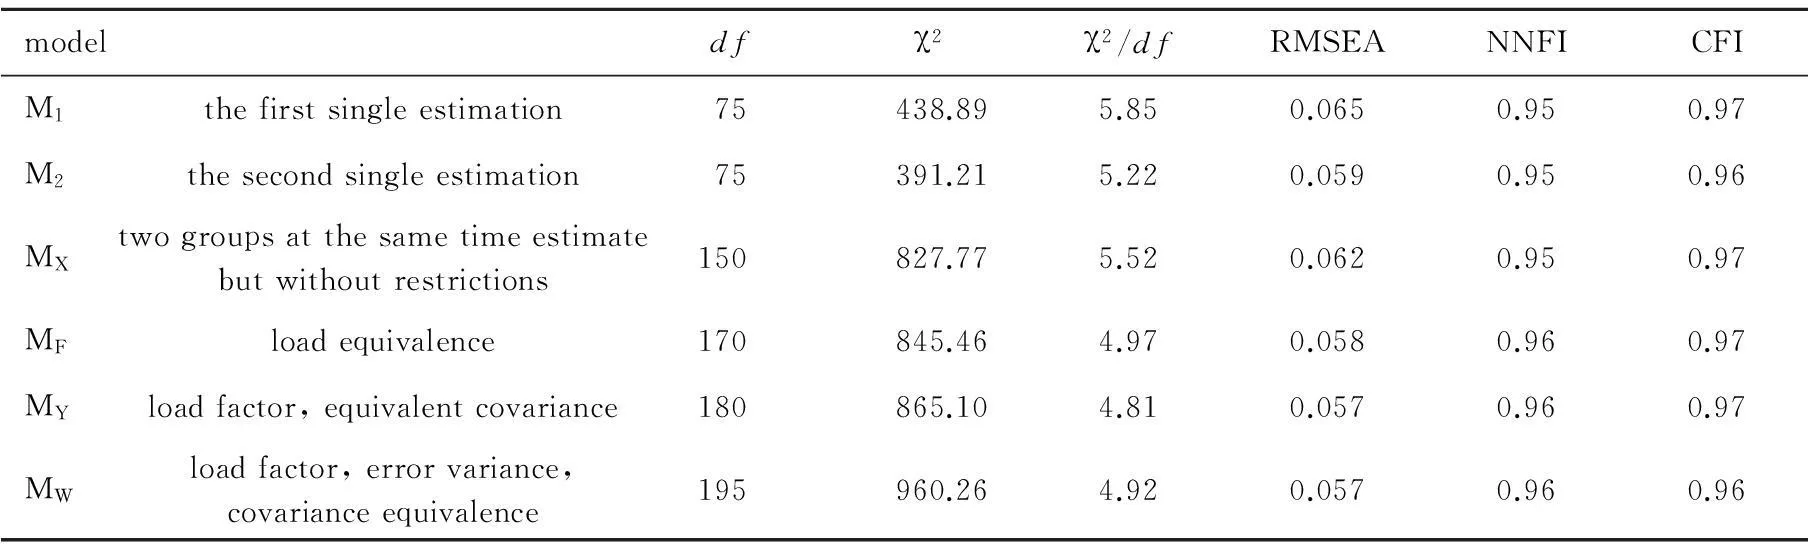
First of all, results of the first and the second test were calculated separately (Table 4). Among fitting indexes of M1and M2, χ2/dfwas slightly greater than 5, and all other indexes met the requirement of psychometrics. The fitting results were generally good. Whether the forms, namely the number of factors and factor loading pattern, were the same was examined. At the same time, the two groups were also evaluated without limitation. Indexes of MXmodel basically met the psychometric requirements, which showed that the two tests had the same theoretical morphology. The study further limited the loading equal in both groups, and compared testing results with MXaccording to the principle of nested model scomparison[3]. The results were as follows: Δχ2=17.69, Δdf=20, andP>0.05, which indicated that the two groups share the same factor loading. When limiting factor loadings and factor covariance equal and compa-ring it with the MF, the results showed that Δχ2=19.64,
Δdf=10, and 0.01 To sum up, the theoretical model fitted the observed structure of the entire secondary personality factors well and better met statistical requirements. Described from the perspective of the theoretical model, the social expectations of the reaction did not significantly affect the structure of secondary factors 16PF . X1: Adaptation and anxiety type; X2: Introversion and extroversion type; X3: Impetuous action and undisturbed intellect type; X4: Coward and resolute type Figure 1Structure diagram of theoretical model Table 4The results of multi-group confirmatory factor modeldfχ2χ2/dfRMSEANNFICFIM1thefirstsingleestimation75438.895.850.0650.950.97M2thesecondsingleestimation75391.215.220.0590.950.96MXtwogroupsatthesametimeestimatebutwithoutrestrictions150827.775.520.0620.950.97MFloadequivalence170845.464.970.0580.960.97MYloadfactor,equivalentcovariance180865.104.810.0570.960.97MWloadfactor,errorvariance,covarianceequivalence195960.264.920.0570.960.96 4Discussion Based on “Social Desirability Scale in Context of Psychological Screening”, this study explored the effect of social desirability response on construct validity of 16PF. The scores of 16PF were controlled by regression analysis using scores of social desirability scale, and control effect of the SDR was analyzed. According to Table 2, exploratory factor analysis on source trait of 16PF of the two tests showed that there were differences before and after aggressiveness loading, other 14 factors were the same in the two tests, and factor loading and contribution rate of variance were about the same. Without considering the intelligence factor for measuring the cognitive ability, the possible reason would be that the 16PF used in this study has not been revised for a long time. The secondary factor structure of 16PF has been less affected by social desirability response, judging from the data. The correlated coefficient of the source trait of 16PF, were about the same, which further proved the stability of interrelationship of all source traits. Internal consistency reliability of factors is also an indicator of the scale construct validity[4]. The two tests listed in Table 3 showed that although α factors of source traits of 16PF were different, the reflected trends were almost the same. The internal consistency of stability, excitement, persistence, boldness, anxiety, and tonicity was good, and the results of the two tests were similar. However, α factor of more than 0.7 only happened in excitability. Indexes of intelligence, abstractedness, sophistication, and openness to change were lower than 0.3, or even presented as negative. This result is consistent with studies of Starketal.[4]and Xuetal.[5]Although, α factor of each source trait of 16PF was different, some even lower than 0.3 or negative, the reflected trends were roughly the same, indicating that the test motives or social desirability response did not affect the internal consistency reliability of source traits of 16PF fundamentally, or impact was small. In summary, for psychological test in context of conscription, social desirability response does not change the structure of personality factors of 16PF. Does it affect the personality test? If it does, how much is the impact? As shown in Table 1, source traits of 16PF of the two tests were compared by paired samplettest. The results indicated that stability, perseverance, boldness, self-discipline of the first test was significantly higher than those of the second test. Sensitivity, vigilance, abstractedness, anxiety, self-reliance, and tonicity of the first test were significantly lower than those of the second. In the first test, all the subjects were full of hope for military life, and most of them would like to join the army and have strong motivation. In the second test, the subjects were guided that the test was not psychological test and not for selection, and the motivation was lower than in the first test. Personality test is prone to be affected by social desirability. If the test item meets or exactly the attitude and behavior that the society calls for, like stability, persistency, boldness,ect., the subjects are likely to answer positively. Therefore, the results of these test items were higher than those of the second. If the test item isn’t the behavior advocated by the society, like sensitivity, anxiety, tonicity,ect., the subjects are likely to answer negatively intentionally or unintentionally. Therefore, the results of these test items were lower than those of the second. As for social boldness, aggressiveness, excitement, sophistication,ect., there are no definite standard, and thetvalue is easily affected by the sample size, so results of the two tests were almost the same, judging from the effective value d of difference. For intelligence, since the cognitive ability is free from the impact of social desirability, the results of the two tests were almost the same, which indicates that social desirability has different effect on subscales. By analyzing the effect value of the difference of 16 source traits, we can see that significant difference presented in subscales between the two tests. Effect value ranged from 0.03 to 0.55 (mean 0.27), which are lower than 0.41 of the study of Mueller-Hansonetal.[6-8]Ellingsonetal.[ 9-11]has proposed that laboratory tests cannot reflect the social desirability response of the applicant in the reality. In laboratory, the subject does not consider the purpose of the test, and just reply according to what the society advocate, so the scores of personality scale are generally high. However, in the context of application, the applicant would response according to the social desirability based on the image of good citizen and good soldier. That is the reason why the subject with strong motivation scores differently in different personality scales. In the second test, despite that the guidance decreased the motivation of the subject, subjects (or part of them) may cover up their feelings, but SDR score did not decrease to zero. It also proved that social desirability’s effect on personality test in personnel selection and psychological test in conscription should be studied in real situations. Studies have proved that social desirability scale may test part of the personality, and this may also be the reason why the SDR score of second test did not reach zero, which need further verification. In conclusion, reliability of source traits of 16PF in the first test was slightly higher than those of the second test. For items advocated by society, such as stability, perseverance, boldness,etc., scores of the first were higher than those of the second test; those undesirable items, such as sensitivity, vigilance, anxiety,etc., scores of the first were lower than those of the second test. Apparently, scores of 16PF factor were affected by social desirability. However, multigroup and confirmatory factor analysis of the two tests indicated that social desirability has no significant impact on structure validity of psychometric personality tests. 【Reference】 [1] Zhao H. Psychological statistics[M]. Beijing: Atomic Energy Press,2004. [2] Gan YQ, Zhang YW, Zou L. Psychology and Behavior Scientific Statistics[M]. Beijing: Peking University Press, 2005. [3] Hou JT, Wen ZL, Cheng ZJ. Structural Equation Model and its Application[M]. Beijing: Education Science Press,2015. [4] Stark S, Chernyshenko OS, Chan KY, et al. Effects of the testing situation on item responding: cause for concern [J]. J Appl Psychol, 2001,86(5):943-953. [5] Xu R, Song HM, Miao DM. Confirmation of construct validity of Cattell’ s 16-personality factor questionnaire (Chinese revision)[J]. J Fourth Mil Med Univ,2007,28(8):744-746. [6] Mueller-Hanson R, Heggestad ED, Thornton GC 3rd. Faking and selection: considering the use of personality from select-in and select-out perspectives[J]. J Appl Psychol,2003,88(2):348-355. [7] Goffin RD, Christiansen ND. Correcting personality tests for faking: A review of popular personality tests and an initial survey of researchers[J]. Int J Selection Assessment, 2003,11(4):340-344. [8] Pauls CA, Stemmler G. Substance and bias in social desirability responding[J]. Pers Indiv Differ,2013,35(2):263-275. [9] Ellingson JE, Sackett PR, Hough LM. Social desirability corrections in personality measurement: Issues of applicant comparison and construct validity[J]. J Appl Psychol,1999,84(2):155-166. [10] Piedmont RL, McCrae RR, Riemann R, et al. On the invalidity of validity scales: evidence from self-reports and observer ratings in volunteer samples[J]. J Pers Soc Psychol,2000,78(3):582-593. [11] Deniz DS, Viswesvaran C, Reiss AD. Role of Social Desirability in Personality Testing for Personnel Selection: The Red Herring[J]. J App Psychol,1996,81(6):660-679. Corresponding author:HU Wen-Dong. E-mail: huwend@fmmu.edu.cn 文章编号:2095-6894(2016)01-47-06 ·临床与转化医学· Received:2015-08-25;Accepted:2015-09-10 Financial support:Key Project of the Military(Grant No. BWS13B064) Author:WANG You-Lin. E-mail:wangyoulin@fmmu.edu.cn
猜你喜欢
动漫星空(兴趣百科)(2020年12期)2020-12-12 05:31:42
中华养生保健(2020年5期)2020-11-16 01:43:52
祝您健康(2020年4期)2020-05-20 15:04:20
学生天地(2019年33期)2019-08-25 08:56:16
小学生学习指导(中年级)(2018年4期)2018-09-06 09:28:56
小学生作文(中高年级适用)(2018年4期)2018-05-14 06:30:14
新校长(2016年5期)2016-02-26 09:29:01
现代企业(2015年6期)2015-02-28 18:51:13
科学中国人(2015年13期)2015-02-28 09:13:00
中国医药科学(2015年15期)2015-02-27 12:32:25