Isometric muscle strength as a predictor of one repetition maximum in healthy adult females: a crossover trial
Manisha Parai*, Pramod Divakara Shenoy, Shalini Velayutham, Choo Kian Seng, Charmaine Yip Fung Yee
Department of Physiotherapy, Faculty of Medicine and Health Sciences (FMHS), Universiti Tunku Abdul Rahman, Kajang,Malaysia
INTRODUCTION
A dynamic isotonic muscle contraction (ITMC) causes joint movement and excursion of a body segment with the contraction and relaxation of muscle under tension. One repetition maximum (1RM) is defined as the maximum weight a person can lift only once in a complete range of motion (Rydwik et al., 2007; Demura et al., 2010). It is a gold standard for measuring muscular strength therefore it is used for most of the strength training programs (Donatelli, 2014). The 1RM test has been shown to be reliable in various populations (Schroeder et al., 2007; Levinger et al., 2009). Moreover, setting an intensity of resistance training based on a percentage of the 1RM has also been found to be effective for improving outcomes such as muscle strength, muscle power, and muscle hypertrophy(Holm et al., 2008; Taylor et al., 2009; Tokmakidis et al.,2009). Many studies have shown an increase in muscle strength when 1RM testing is repeated over several days to weeks (Rarick and Larsen, 1958; Niewiadomski et al.,2008). Therefore, most testing protocols suggest that muscle strength should be measured more than once; typically 2 or 3 testing sessions are recommended (Ploutz-Snyder and Giamis, 2001).
A familiarization process prior to 1RM strength testing is necessary to ensure a reliable test result (Selig et al.,2002; Levinger et al., 2009; Webber and Porter, 2010), this minimizes learning effect or systemic bias (Hopkins, 2000).Investigators have suggested that older individuals need 8–9 sessions of 1RM testing in order to increase the consistency of the 1RM measurements (Ploutz-Snyder and Giamis,2001). Therefore, multiple familiarization sessions are beneficial for 1RM measurements. This draws us to a thought that such sessions may not be practical for experimental research studies examining training outcome to record the strength changes for several resistances as well as numerous functional parameters. This unnecessarily increases the time requirement and extends the duration of the study, both of which might increase the likelihood of participant dropout in research studies and loss of interest in exercise for clients(Levinger et al., 2009). In the measure of 1RM, especially in patients, using a heavier weight and a larger number of repetitions imposes a greater risk of injury (Niewiadomski et al., 2008; Levinger et al., 2009).
1RM takes a long period of testing to have a consistent value and it also requires familiarization technique which is also a very intense and extensive procedure. To avoid the risks related to the measurement of 1RM, many studies have been conducted to produce regression equations for predicting 1RM muscle strength. Other studies have been undertaken to determine the accuracy of such equations.Prediction of 1RM strength allows an exercise specialist to assess an individual's maximal lifting capacity without subjecting the novice lifter to the increased risk associated with a 1RM lift (Hutchins et al., 2002; Niewiadomski et al.,2008; Urquhart et al., 2015). The advantage of calculating 1RM using the formula is that, it provides the therapist with the most widely accepted measure of strength without the risks associated with the formal 1RM testing (Donatelli,2014). However, the 1RM load lifting also requires great concentration and considerable mental preparation for the subject which can be an extremely intense experience that leaves them unsure and scared. Although there is no real data concerning the risk of injury in this test, the potential risk may be significantly increased by using very heavy loads (Niewiadomski et al., 2008; Levinger et al., 2009).
Testing 1RM uses isotonic movement which may be associated with increased risk of injury as it may include high speed of movement, inability to spread workload evenly over the entire range of motion (Loudon et al., 2013), unsafe for pathological joints, delayed onset of muscle soreness(Thompson, 2007). In addition, equipments which can be expensive can be required and incorrectly done movement may also increase the risk of injury (Clover, 2007). Measuring of 1RM with no matter the traditional way or prediction equation is at risk, so it brings us an ideal of using isometric movement in predicting RM. Isometric contraction is a static form of exercise in which a muscle contracts and produces force without an appreciable change in the length of the muscle and without visible joint motion (Kisner et al.,2012). It is a very easy, fast, accurate and popular method of testing the isometric strength of a particular muscle.Isometric measurement by Lafayette Manual Muscle Test System (model 01163) has been proven to be highly reliable (Arnold et al., 2010). This method avoids most of the risk factors that are observed in measuring 1RM using the prediction equation. Furthermore, it is cost-effective, more convenient to be done, and it does not aggravate sensitive joint surfaces (Thompson, 2007). Therefore, it reduces most of the risks involved in measuring 1RM using the traditional way and prediction equation. However, it is worth mentioning that isometric strength measurement cannot be replaced with the 1RM measurement which is a dynamic method.
Blazevich et al. ( 2002) performed a study to investigate the reliability and validity of two isometric squat (IS) tests and concluded that IS with an isometric rack showed significant and high correlation (r = 0.77) with 1RM squat. However,Demura et al. (2010) studied the relationship between 1RM and isometric measurement of squat (IS) and they found that some components (wide stance and parallel depth) of the squat correlated well with 1RM whereas others did not.Simple linear regression analysis in their study revealed a relationship of Y = 0.992X + 30.3 (Y: 1RM, X: IS). This suggests that IS using a back dynamometer may become an effective index for predicting 1RM squat. However, since the standard error of an estimate provided by the regression equation was quite large (11.19 kg), it could not estimate 1RM in non-athletes; this study concluded that estimating a 1RM by IS using a back dynamometer is likely to be difficult. Though some studies have been conducted to estimate 1RM from isometric strength measurements(Williamson et al., 2009; McGuigan et al., 2010), few reported the same conclusion. Therefore, we aim to find out if isometric strength can be compared with 1RM in female subjects without weight training experience. The primary objective of this study was to investigate whether there was a relationship between 1RM (Brzycki’s prediction equation) measurement and isometric maximum voluntary contraction (MVC) using a digital hand-held dynamometer.The secondary objective was to compare the dominant and non-dominant sides to see if any relationship or rule exists between two sides.
It will be an easier and safer method to estimate 1RM by comparing these two types of contraction. Our findings will bene fit various fields of physiotherapy, for example, hospital settings or sports environment because 1RM estimation does not consume too much time and effort from the clients.
SUBJECTS AND METHODS
This study was done in 2 phases: Phase 1 was a pilot study and phase 2 was a comparison study. The stepwise proce-dure is shown in Figure 1.
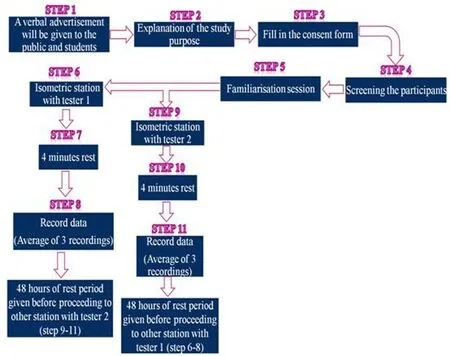
Figure 1: Flow chart showing the procedure of the study.
Phase 1: a pilot study
Phase 1 was a pilot study done to test the reliability of testing biceps muscle strength using a digital hand-held dynamometer (Lafayette Manual Muscle Test System model 01163, Patterson Medical, United Akrab, Petaling Jaya,Malaysia). The purpose of this phase was to find out the intra-tester reliability of a tester and inter-tester reliability between two testers in testing bicep muscle strength using a digital hand-held dynamometer. The pilot study was done in 10 healthy female subjects aged 19 to 35 years.
Prior to the commencement of the study, ethical approval was obtained from Universiti Tunku Abdul Rahman Scientific and Ethical Review Committee (UTAR-SERC). The study protocol was registered at Clinical Trials.gov (identifier: NCT02717793). A verbal advertisement was given for the purpose of obtaining volunteers for this phase. After disclosing the purpose of the study, all those who volunteered to be a part of the study had given their informed consent.This was followed by collection of demographic pro file and screening to exclude any subjects with unstable medical conditions, as mentioned in the consent form.
A familiarization session was given to the subject and a general warm up of 3 minutes was done by the subject.The isometric muscle contraction (IMMC) was measured using a digital hand-held dynamometer (Lafayette Manual Muscle Test System model 01163). Subject was in comfortable clothing, sitting with back supported; hip and knee kept at approximately 90 degrees, arm to be tested is kept adducted (beside the trunk), stabilized by another hand,just above the elbow joint. Elbow was kept in 90 degrees of flexion (measured with universal goniometer) and wrist was in supination (palm facing upward). The digital handheld dynamometer was held by the therapist against the flexor aspect of the distal forearm (distal radioulnar joint)of the subject. The subject was asked to maintain the position and a break test was done with progressive loading of 5 seconds given by the tester. The peak isometric strength was recorded by a second tester at the end of 5 seconds. A standardized instruction and verbal encouragement were given to the subject for motivation. The subject and the tester were blinded to the values recorded on the digital hand-held dynamometer. An average of three measurements (with a rest period of 4 minutes in between each trial session) was recorded for the analysis. After each trial session, the rate of perceived exertion was asked in the subject using the “1–10 Borg rating of perceived exertion scale”(Noble et al., 1983). After a rest period of 48 hours,the same procedure was performed on the same subject by the second tester. In the rest period of 48 hours, the subject was instructed to maintain the level of hydration and food intake, and not to perform any intense activity, strengthening of upper extremities or drink alcohol. The readings recorded by one tester in the first testing session and those recorded by another tester in the second testing session after 48 hours were compared and the intra-rater reliability and inter-tester reliability were analyzed.
Phase 2: a crossover trial
Phase 2 procedure was the same as phase 1. Healthy females who were not included in the pilot study (person who do not report any pre-existing medical condition and with normal body mass index (BMI)), aged 19–35 years, were included in phase 2. Thirty participants volunteered to participate in this study. Subjects who presented with one of the following conditions were excluded from this trial: musculoskeletal,or neurological disorder, a history of high blood pressure,heart disease, rheumatologic disease that affect the mobility, unstable cardiorespiratory, and cardiovascular disorder.
The study was carried out at Department of Physiotherapy,Physiotherapy Centre, University Tunku Abdul Rahman,Bandar Sungai Long. There were three testers. Tester 1 and tester 2 performed the isometric muscle strength testing using a digital dynamometer, and tester 3 performed isotonic muscle strength testing using 1RM.
After phase 1 of the study, another verbal advertisement was given to recruit volunteers for the phase 2 of the study.After explaining the purpose of the study, the volunteers signed the informed consent form. This was followed by collection of demographic pro file and screening the participants. Each participant underwent a familiarization session. The study setting was divided into two stations(Station A-ITMC and Station B-IMMC). The subjects were randomly allocated to either of the station using the lottery method (Featherston and Donovan, 1998). A rest period of 48 hours was given to the subjects between each station.In the rest period of 48 hours, subjects were given instruction to maintain the level of hydration and food intake,and not to perform any intense activity, strengthening of upper extremities or drink alcohol. Before proceeding to the station, a general warm up of 5 minutes had been done by the subjects. Active exercises for neck, shoulder, and the upper extremities was done for 2 minutes and the folowing cardiovascular training exercise (treadmill walking or stationary cycling) was done for 3 minutes.
In Station A-ITMC, the 1RM measurement was done using the Brzycki 1RM prediction equation. The biceps brachii muscle of both sides was tested. The subject was in sitting position with back supported, hip and knee kept in 90 degrees, arm beside the trunk, and elbow in extension with wrist in supination (palm facing forward). The angle was measured with a universal goniometer. The subject was instructed to make elbow flexed to a fully extended position with the weights. The positions of the subject are shown in the diagram (Figures 2, 3).

Figure 2: Erect sitting postures in anatomical position in the frontal (A)and sagittal (B) views.
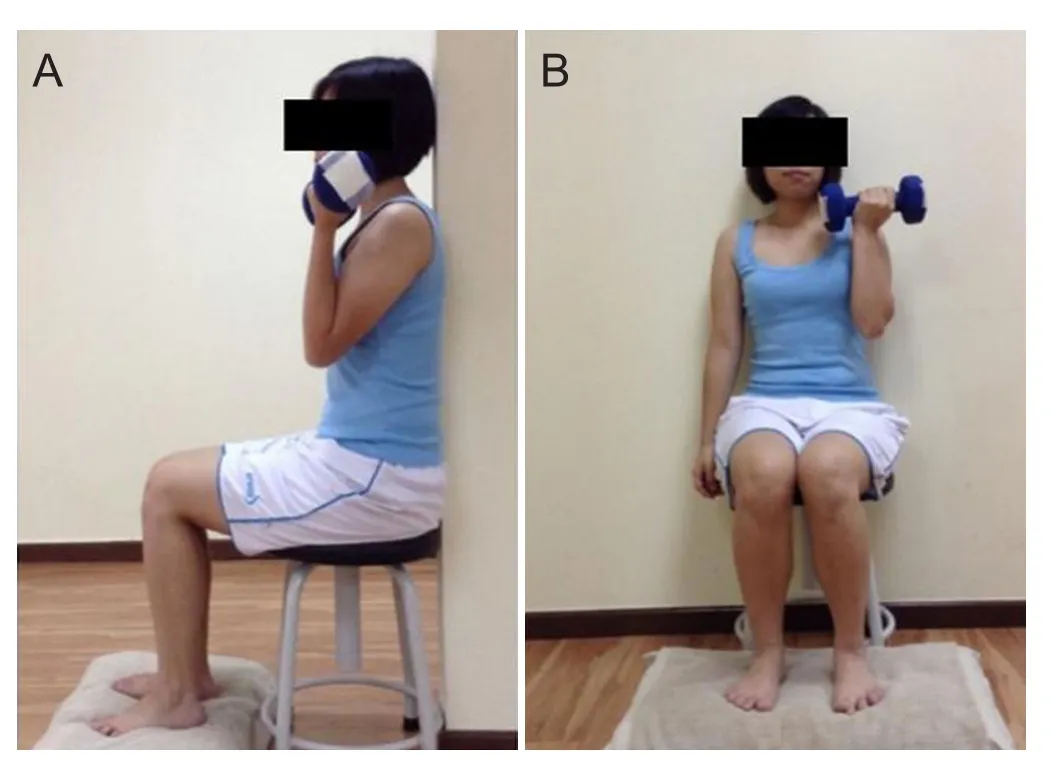
Figure 3: Full flexion of the elbow, erect sitting posture in anatomical position in the sagittal (A) and frontal (B) views.
During the first testing session, the subject was instructed to perform a general warm up for 5 minutes, as mentioned above. Thereafter, the subject was asked to perform 10 repetitions of the movement using the amount of resistance that the subject felt she would be able to lift for only less than 10 times. The weight was selected based on a list of weights provided (1 to 10 kg). When the subject performed the movement for 10 times or more, then the resistance was increased 1 kg at a time, until the subject could perform only 9 or fewer repetitions of the movement correctly throughout the range of motion. A rest period of 3 minutes was given to the subject before the new attempt was done with the increased weight. A standardized verbal encouragement was provided for motivation.
The resistance was increased in order to meet the requirement of 1RM measurement using the Brzycki 1RM prediction equation 1RM = (100 × W) / (102.78 – (2.78 × R)),where W= weight used (in kg) and R = maximal number of repetitions performed which can be used only if 9 or less repetitions can be completed. The maximum weight and the number of repetitions were recorded and 1RM (in kg) was calculated with the following formula:
In Station B-IMMC, a digital hand-held dynamometer(Lafayette Manual Muscle Test System model 01163) was used. The process included was the same as that of phase 1. The positions of the subject and therapist are shown in Figure 4.

Figure 4: Positions of the subject and therapist in testing isometric muscle strength in the sagittal (A) and frontal (B) views.
Statistical analysis
Phase 1
The data were analyzed using IBM SPSS Statistics 18.0 software (Statistical Product and Service Solutions software,Advanced Business Analytics (M) Sdn Bhd, Malaysia) for Microsoft Windows. The inter-rater and intra-rater reliability of tester 1 and tester 2 were analyzed and the intraclass correlation coefficient (ICC) was recorded.
Phase 2
The data were analyzed using IBM SPSS Statistics 18.0 software (Statistical Product and Service Solutions software) for Microsoft Windows. In this study, the relationships between Station B-IMMC (MVC with a hand-held dynamometer) and Station A-ITMC (1RM with Brzycki Prediction Equation) were examined using Spearman’s correlation coefficient. Linear regression was used to find out the regression equation. Paired t-tests were done to analyze the variances. A value of P < 0.05 was accepted as the level of statistical significance for all analyses. The list below showed the results of paired t-tests that had been done.
I. Correlation between Station A-ITMC and Station BIMMC on the dominant and non-dominant sides.
II. Correlation between Station B-IMMC and 1RM (Regression Prediction Equation obtained from Station B-IMMC) on dominant and non-dominant sides.
III. Correlation between readings of Station B-IMMC and Station A-ITMC on the dominant and non-dominant sides.
RESULTS
Phase 1
Ten female subjects completed the pilot study. We found a moderate to good inter-rater reliability and inter-rater reliability. The intra-tester reliability of tester 1 and tester 2 was moderate with the intraclass correlation coefficient value of 0.668 and 0.631, respectively. The inter-tester reliability of both tester 1 and tester 2 was good with the intraclass correlation coefficient value of 0.966.
Phase 2
We had 30 female subjects in which 28 were right-handed and two were left-handed. One dropped out of the trial so the data of 29 subjects were included in the final analysis. The mean age of the female subjects was 20.77 ± 1.28 years and BMI was 20.43 ± 1.85 kg/m2. No obvious injuries occurred during the study, except for mild muscle soreness, which was expected and informed to the subjects to be common with unaccustomed exercise for untrained individuals.
Since there was a positive moderate correlation, readings obtained from Station A-ITMC and Station B-IMMC on both dominant and non-dominant sides could be compared.There was a significant difference between Station A-ITMC and Station B-IMMC on both dominant and non-dominantsides (Table 1).
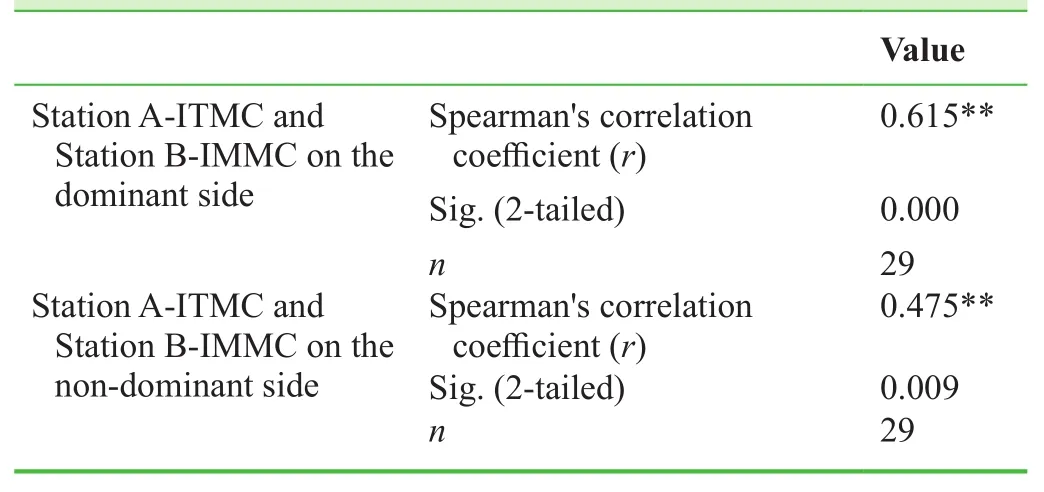
Table 1: Correlations between one repetition maximum(Brzycki Prediction Equation) and maximum voluntary contraction (hand-held dynamometer)
The prediction equation derived from linear regression analysis for the dominant side, i.e., Y = 0.391X + 1.472 and the prediction equation derived from linear regression analysis for the non-dominant side was Y = 0.251X+ 2.629. The scatter plot diagram of the relationship is shown in Figure 5.
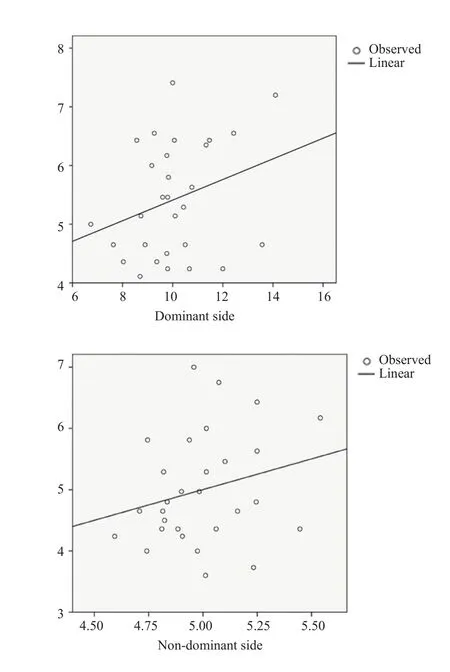
Figure 5: Scatter plot showing a linear relationship between maximum voluntary contraction and Brzychi one repetition maximum.
There was a significant difference between station BIMMC and 1RM (regression prediction equation obtained from Station B-IMMC) on both dominant and non-dominantsides (Table 2).

Table 2: Comparisons between (i) station A-ITMC and station B-IMMC and (ii) between station B-IMMC and 1RM(regression prediction equation obtained from station B-IMMC)
There was no significant difference in readings of station A-ITMC or station B-IMMC between the dominant andnon-dominant sides (Table 3).
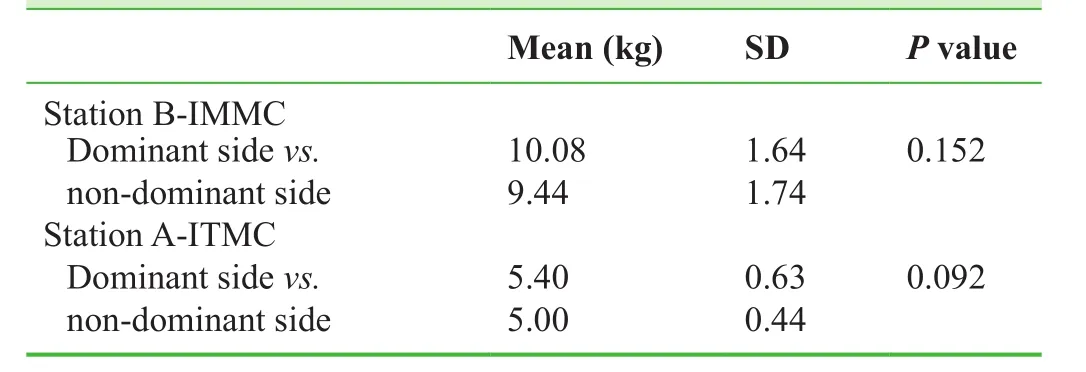
Table 3: Comparison of readings of station B-IMMC and station A-ITMC between the dominant and non-dominant sides
DISCUSSION
Twenty-nine female university students (mean age 20.77± 1.28 years, mean BMI 20.43 ± 1.85 kg/m2) volunteered to participate in this study. The standard deviations of age and BMI were low in our study because the subjects were from a population with similar age and BMI.
There were a couple of studies with similar objectives to ours. Demura et al. (2010) investigated the relationship between IS using a back dynamometer and 1RM squat for maximum force and muscle activities and examined the effectiveness of IS-based 1RM estimation method. They included 15 young men with weight training experience and concluded that IS with wide stance and parallel depth may be useful for the estimation of 1RM squat. In their study,they found a significant and high correlation (r = 0.73) between the IS squat and 1RM squat. However, they concluded that estimating a 1RM by IS using a back dynamometer may be difficult as the standard error of an estimate value obtained by their regression equation was very large (11.19 kg), and they also reported that the ability to perform the activity with a back dynamometer may not be preferable by normal individuals without any athletic background and also by the patients. The limitation to their study was a small sample size (n = 15) in which they focused only on trained individuals. Unlike their study, our study had a larger sample size (n = 29) and used normal population; and our findings may be more beneficial in future if they are also performed in patient population. Demura et al. (2010)found a significant and high correlation (r = 0.73) between the IS squat and 1RM squat. Likewise, in our study, there was a moderate correlation between station B-IMMC and station A-ITMC on both dominant and non-dominant sides(dominant, r = 0.615; non-dominant, r = 0.475). The difference in results may be due to different types of subjects included in the study. In addition, the targeted muscle was also different. Our results showed low standard error (1.12 kg) which indicates that the regression equation may be applicable for various populations. This occurs possibly because of a larger number of samples we had (n = 29).The result difference different from previous study is likely attributable to different populations. Demura et al. (2010)included young males with weight training while our study included only females from non-athletic background. The reason of choosing only female subjects as the participants is merely for convenience. Further studies can be done in diverse populations (athletes, males, females, patients)with even a larger sample size to improve the reliability of the findings.
In another study, reliability and validity of two isometric squat tests were examined between isometric and dynamic measures of strength (Blazevich et al., 2002). Fourteen male subjects performed maximal IS and isometric forward hack squat tests on 2 occasions and 1RM free-weight squat and forward hack squat tests on 1 occasion. There was a strong relation between average IS and 1RM squat performance (r= 0.77). There was also no difference between the observed 1RM values and those predicted by the regression equations.Blazevich et al. (2002) found correlations between isometric and 1RM tests without sufficient size, which indicates high validity of the isometric tests. They stated that this might be due to the small sample size. In our study, Blazevich used a large-scaled measurement approach with a force plate,which is difficult to be used in a real training scenario due to the high cost and general availability.
Our results showed that there was significant difference in the mean between station A-ITMC and station B-IMMC on the dominant and non-dominant sides. Thus, we considered that IMMC and 1RM were two different entities. IMMC is a static form of exercise in which it contracts and produces force without an appreciable change in the length of the muscle and without visible joint motion (Kisner et al.,2012). Whereas, 1RM is ITMC causes joint movement and excursion of a body segment as the muscle contracts and shortens or lengthens under tension. However, since IMMC and ITMC showed a positive moderate correlation, we had plotted a regression line which gave us a different regression equation for dominant and non-dominant sides. This regression prediction equation was then used to calculate a new 1RM (regression prediction equation obtained from station B-IMMC) value which was then used for further analysis.
When a paired t-test was used, there was significant difference between station B-IMMC and new 1RM (regression prediction equation obtained from station B-IMMC)on the dominant and non-dominant sides. This signi ficant statistical difference proves that even though we had used the station B-IMMC reading to derive the linear regression equation, there is a constant value which makes the station B-IMMC reading to be different from the regression prediction equation.
There was also no difference observed between 1RM(Brzycki prediction equation) and 1RM (regression prediction equation obtained from station B-IMMC) on the dominant and non-dominant sides when analyzed. This suggests that any of the equations can be used interchangeably to predict 1RM. The regression prediction equation derived from our study will be safer to predict 1RM of patients because as we know, in Brzycki prediction equation, ITMC is used and the likelihood of injury is higher, as isotonic movement which is done incorrectly with high speed of movement and the inability to spread workload evenly over the entire range of motion can increase the risk of injury. Whereas the new 1RM (regression prediction equation obtained from station B-IMMC) is derived from IMMC.
After 48 hours of interval given to the subjects before proceeding to the next station in our study, the subjects were subjectively asked if there is any discomfort felt. Six out of 29 participants complained of pains which the patients assume to be delayed onset muscle soreness and slight joint pain after station A-ITMC. However, none out of the 29 patients complained of any pain after completing the station B-IMMC. This suggests that isometric IMMC is safer than ITMC in determining the muscle strength.
There are many studies comparing the muscle strength of the dominant and non-dominant hands using the 10%rule. In our study, we found that the hand dominance rule was not applicable and there were no significant differences in IMMC and ITMC between the dominant and non-dominant sides. Further studies involving a larger sample size are needed to be performed to obtain a de finite conclusion.
Thirty subjects were initially included in this study, but one dropped out without any specific reason and we related the dropout to the long rest period of 48 hours in between.This drop out can be expected as this study needs the subjects to be present at the exact timing on recording days.The limitation of sample size was due to the time constraint of this research. The time factor also became a barrier to a further follow up on the effects of the strength measurement using the newly derived regression formula on the subjects.
In conclusion, this study reveals that IMMC reading incorporated into the derived regression formula can be used to predict 1RM in healthy females, if the regression formula is proven to be effective in a further study. Therefore, it will be an easier and safer method for clinicians in various fields of physiotherapy, in hospital settings or sports environment to estimate 1RM using this method without consuming too much time and effort from the client.
We sincerely thank all the participants who had joined our research project, our fellow classmates, and lecturers who had given the advice and support throughout the study.
Conflicts of interest
None declared.
Author contributions
MP and PDS conceptualized the idea, designed the study,provided statistical expertise in analysis, interpreted the data, and critically revised the paper for important intellectual content. SV, CKS and CYFY collected the data,analyzed and interpreted the data, and wrote the paper.All authors approved the final version of this paper for publication.
Plagiarism check
This paper was screened twice using Cross Check to verify originality before publication.
Peer review
This paper was double-blinded and stringently reviewed by international expert reviewers.
Arnold CM, Warkentin KD, Chilibeck PD, Magnus CR (2010) The reliability and validity of handheld dynamometry for the measurement of lower-extremity muscle strength in older adults. J Strength Cond Res 24:815-824.
Blazevich AJ, Gill N, Newton RU (2002) Reliability and validity of two Isometric squat tests. J Strength Cond Res 16:298.
Clover J (2007) Sports medicine essentials: Core concepts in athletic training and fitness instruction, 2ndedition. United States:CENGAGE Delmar Learning.
Demura S, Miyaguchi K, Shin S, Uchida Y (2010) Effectiveness of the 1RM estimation method based on isometric squat using a back-dynamometer. J Strength Cond Res 24:2742-2748.
Donatelli RA (2014) Sports-specific rehabilitation. United States:Churchill Livingstone.
Featherston K, Donovan JL (1998) Random allocation or allocation at random? Patients' perspectives of participation in a randomised controlled trial. BMJ 317:1177-1180.
Holm L, Reitelseder S, Pedersen TG, Doessing S, Petersen SG,Flyvbjerg A, Andersen JL, Aagaard P, Kjaer M (2008) Changes in muscle size and MHC composition in response to resistance exercise with heavy and light loading intensity. J Appl Physiol(1985). 105:1454-1461.
Hopkins WG (2000) Measures of reliability in sports medicine and science. Sports Med 30:375-381.
Hutchins MD, Becque MD, Gearhart RF, Carroll PJ (2002) Accuracy of 1RM prediction equations for the bench press and biceps curl. Med Sci Sports Exerc 34:S35.
Kisner C, Colby LA, Kisner Carolyn Colby Lynn A (2012) Therapeutic exercise: Foundations and techniques, 6thedition. Philadelphia: F.A. Davis.
Levinger I, Goodman C, Hare DL, Jerums G, Toia D, Selig S (2009)The reliability of the 1RM strength test for untrained middle-aged individuals. J Sci Med Sport 12:310-316.
Loudon JK, Manske RC, Reiman MP, Loudon PDJK (2013) Clinical mechanics and Kinesiology with web resource. Champaign,IL: Human Kinetics Publishers.
McGuigan MR, Newton MJ, Winchester JB, Nelson AG (2010) Relationship between Isometric and dynamic strength in recreationally trained men. J Strength Cond Res 24:2570-2573.
Niewiadomski W, Laskowska D, Gąsiorowska A, Cybulski G,Strasz A, Langfort J (2008) Determination and prediction of one repetition maximum (1RM): Safety considerations. J Hum Kinet 19:109-120.
Noble BJ, Borg GA, Jacobs I, Ceci R, Kaiser P (1983) A categoryratio perceived exertion scale: relationship to blood and muscle lactates and heart rate. Med Sci Sports Exerc 15:523-528.
Ploutz-Snyder LL, Giamis EL (2001) Orientation and familiarization to 1RM strength testing in old and young women. J Strength Cond Res 15:519.
Rarick GL, Larsen GL (1958) Observations on frequency and intensity of isometric muscular effort in developing static muscular strength in post-pubescent males. Res Q Exerc Sport 29:333-341.
Rydwik E, Karlsson C, Frandin K, Akner G (2007) Muscle strength testing with one repetition maximum in the arm/shoulder for people aged 75 + - test-retest reliability. Clin Rehabil 21:258-265.
Schroeder ET, Wang Y, Castaneda-Sceppa C, Cloutier G, Vallejo AF, Kawakubo M, Jensky NE, Coomber S, Azen SP, Sattler FR (2007) Reliability of maximal voluntary muscle strength and power testing in older men. J Gerontol A Biol Sci Med Sci 62:543-549.
Selig SE, Carey MF, Menzies DG, Patterson J, Geerling RH, Williams AD, Bamroongsuk V, Toia D, Krum H, Hare DL (2002)Reliability of isokinetic strength and aerobic power testing for patients with chronic heart failure. J Cardiopulm Rehabil 22:282-289.
Taylor JD, Fletcher JP, Tiarks J (2009) Impact of physical therapist directed exercise counseling combined with fitness center-based exercise training on muscular strength and exercise capacity in people with type 2 diabetes: A Randomized clinical trial. Phys Ther 89:884-892.
Thompson CRR (2007) Prevention practice: A physical therapist's guide for health, fitness, and wellness. United States: SLACK.
Tokmakidis SP, Kalapotharakos VI, Smilios I, Parlavantzas A(2009) Effects of detraining on muscle strength and mass after high or moderate intensity of resistance training in older adults.Clin Physiol Funct Imaging 29:316-319.
Urquhart BG, Moir GL, Graham SM, Connaboy C (2015) Reliability of 1RM split-squat performance and the efficacy of assessing Both bilateral squat and split-squat 1RM in a single session for non–resistance-trained recreation ally active men. J Strength Cond Res 29:1991-1998.
Webber SC, Porter MM (2010) Reliability of ankle isometric, isotonic, and isokinetic strength and power testing in older women.Phys Ther 90:1165-1175.
Williamson M, Bellar D, Muller M, Patrick TJ, Barkley J, Glickman EL (2009) The relationship of arm span to maximum voluntary Isometric contraction and 1rm bench press performance. Med Sci Sports Exerc 41:456-457.
 Clinical Trials in Orthopedic Disorder2016年2期
- Clinical Trials in Orthopedic Disorder的其它文章
- Polymerase chain reaction for diagnosis of isolated tuberculosis of the wrist joint
- Lateral dislocation of the elbow: a report of two cases and literature review
- Consistency of microbiological and pathological tests between infected bone and surrounding deep soft tissues in diabetic foot osteomyelitis: study protocol for a singlecenter, self-controlled, open-label trial
- Minimally invasive closed reduction and internal fixation with fully threaded headless cannulated compression screws for repair of distal radius fracture: study protocol for a randomized controlled trial
- Minimally invasive treatment of proximal humerus fractures with locking compression plate improves shoulder function in older patients: study protocol for a prospective randomized controlled trial
- Treatment of intertrochanteric femoral fracture with proximal femoral medial sustainable intramedullary nails: study protocol for a randomized controlled trial
