Effect of Point Cloud Data Simplification and Encryption on Micro-Topography Data Analysis
, , , ,
Shaanxi Provincial Land Engineering Construction Group, Xi’an 710075, China
1 Introduction
The point cloud data acquired by terrestrial laser scanner are huge, which has long been a difficulty affecting post-processing of data, and many scholars have made a lot of researches to solve this problem[1-3]. In most cases, for a DEM project, it does not require all the information expressed from DEM surface, and it simply measures the data points of the corresponding surface to achieve certain terrain surface accuracy and reliability[4]. The three-dimensional laser scanner is used in various fields, and at the same time, the high data point density and data redundancy of laser scanner also appear in people’s eyes[5]. Zhang Liyan, Liu Chunetal.[1-2]have made a lot of studies on three-dimensional laser scanning technology, but these studies mainly focus on the application of reverse engineering, and the three-dimensional laser scanning technology gets more points, but in the flat terrain area, only a small number of points are required to clearly express the surface form, and in complex terrain area, it needs more points to describe the surface. Terrain surface curvature describes the curved surface shape and concavity and convexity change of local terrain in various cross-sectional directions, reflecting the local terrain structure and form[6]. The curvature value of any point on the curved surface has different geological meaning and geometric definition[7]. Many kinds of curvature have been proposed for practical application. For one point, there is minimum, maximum or mean curvature; for the motion of matter and sediment on terrain surface, there is profile curvature, tangent curvature or contour curvature. Surface roughness is an important indicator to reflect the physical properties of surface micro-topography[8], and a concrete manifestation of surface microrelief. It can directly reflect changes in surface elevation, and the most commonly used ways of observation for surface roughness include probe method, chain method, three-dimensional imaging method and other methods[9]. After simplification and encryption, it causes great changes in data organization and ordering in the sampling points, and also leads to changes in the observed slope, thus indirectly affecting the area of curved surface. In China’s loess area, micro-topography is further defined as the terrain feature of surface relative elevation in the range of 5-25 cm within a small area[10]. In general, it is very difficult to observe such terrain by using a scanner, and there are obvious differences in the distribution of the acquired observation data, so the simplification and encryption of observation results can make the point cloud data arrangement more reasonable, and have important influence on micro-topography observation.
2 Materials and methods
2.1ExperimentaldesignThe experiment is completed in State Key Laboratory of Loess Plateau Soil Erosion and Dryland Farming. The test soil is the loess soil in Yangling and the soil bulk density is controlled to 1.15—1.16 g/cm3. The erosion groove specification is 2 m × 1 m × 0.6 m (length × width × height), and the slope is 15°. Two kinds of terrain (deep plowing; bare slope raking) are used. Rainfall lasts 1 h, and rain intensity is 90 mm/h.
2.2PointclouddataacquisitionBefore and after the rainfall, the three-dimensional laser scanner is used to obtain the point cloud data about surface micro-topography. In order to avoid the impact of topographic relief on micro-topography, three observation stations are used to scan the slope, and obtain point cloud data. The sampling interval is 1, 5, 10 mm.
2.3DataselectionandpreprocessingDuring the test, deep-plowing terrain and bare slope are selected, and 1, 5, 10 mm observation scales are used to describe terrain change on the surface. In the test process, in order to avoid the effect of erosion plot edge blocking on the observed results, we select the area of 1.7 m×0.8 m in the plot as the main source of data, and carry out simplification and encryption on the original scanning data. The raw point cloud data are imported into ScanMaster, and the outliers in the whole scanning data are removed. The simplification and encryption modules of the supporting scanner software are used for processing. The data of 1 mm scanning accuracy are simplified into 5, 10 mm, respectively; the data of 5 mm scanning accuracy are encrypted into 1 mm and simplified into 10 mm; the data of 10 mm scanning accuracy are encrypted into 1, 5 mm, respectively. The processed data and raw data are exported in the file format of .txt, to facilitate the processing of third-party software. The simplification and encryption methods are to reduce the data redundancy or improve the sampling accuracy of data points by changing data storage way, organization form and spacing of sampling points. The theoretical basis of simplification and encryption is the first law of geography, that is, the correlation between things is related to the adjacent distance, and the longer the distance, the higher the correlation. The change in the number of sampling points after simplification and encryption of various types of data can be shown in Table 1. As can be seen from Table 1, in the process of 1 mm data simplification, the data amount of sampling points is significantly reduced, when it is simplified to 5 mm scale, the number of sampling points decreases by 84.16%, and when it is simplified to 10 mm scale, the number decreases by 96.04%. When the 5 mm scale is encrypted into 1 mm, the number of sampling points increases by 10, and the increase in the amount is not obvious; when it is simplified into 10 mm, the number of sampling points decreases by 13.1%, and the change is obvious compared with encryption; after encryption of 10 mm data, the number of sampling points does not change, but the organization form of sampling points is changed. Various groups of exported data are imported into ArcGIS for processing, to generate the corresponding DEM data, and the eigenvalues of slope, slope aspect and curvature are extracted. Using the raster data, the plane area of corresponding slope is calculated, and the average slope between the raster data is used to project the plane area onto curved surface to calculate the curved surface area:
S1=N×L2
(1)
S2=S1/cos(P/180)cos(P/180)
(2)
whereS1is plane area;S2is curved surface area;Nis the corresponding slope raster number;Lis the corresponding raster side length;Pis the slope, 1°classification criterion is used to reduce the effect of slope classification on terrain changes.
Based on the calculation results of formula (1)-(2), we calculate the roughness of the slope, and in the entire testing process, we use surface roughness to measure the roughness change of surface. The specific formula is as follows:
Cz=S2/S1
(3)
whereCzis surface roughness, the ratio of curved surface area to plane area, and whenCz=1, the roughness is lowest.
The data of curvature, curved surface area and slope aspect extracted from ArcGIS are entered in Excel for preliminary statistical analysis to get the preliminary statistical data, and then these data are imported into Origin for the corresponding analysis to get the data for analysis.
Table1Thesamplingpointchangeaftersimplificationtreatment

Samplinginterval1mm5mm10mm1—5mm1—10mm5—1mm5—10mm10—5mm10—1mmNumberofsamplingpoints67357092663656355410668032670682663552317066355463554
3 Results and analysis
3.1EffectofsimplificationandencryptiononsurfacecurvaturechangeThe full curvature is used to describe the structural form of surface, and by the reclassification, the curvature is divided into ≤0 and >0. We make statistical analysis on the number of various types of raster and compare the micro-topography surface curvature change in two kinds of terrain after simplification and encryption. The surface curvature change after 1 mm data simplification is shown in Fig. 1. When the bare slope curvature is simplified into 5 mm, there is a significant change, however, when it is simplified into 10 mm, the change is slightly less than 5 mm. It can be found that with the increase of simplification scale, the bare slope curvature change gradually gets gentle; there are two completely distinct variations in deep tillage curvature when it is simplified into 5 mm and 10 mm, indicating that simplification has a more significant impact on deep plowing terrain. The curvature change after 5 mm data simplification and encryption is shown in Fig. 2. The bare slope curvature change is very small and almost negligible when it is simplified into 10 mm, but the curvature change is more obvious when it is encrypted into 1 mm, so the curvature change after 5 mm data simplification and encryption is subtle, but encryption has a relatively large impact on curvature. The deep tillage curvature change when it is simplified into 10 mm is very close to the deep tillage curvature change when it is encrypted into 5 mm, and simplification has a great impact on curvature, so on this scale, simplification and encryption have quite different impact on the curvature of two kinds of terrain. The curvature change after 10 mm data encryption is shown in Fig. 3. When it is encrypted into 5 mm and 10 mm, the bare slope curvature change is not obvious. The deep tillage curvature change is not obvious when it is encrypted into 5 mm, but there is a great change when it is encrypted into 1 mm, indicating that encryption has a significant impact on high-relief terrain curvature change. In summary, it can be concluded that simplification and encryption treatment has a more obvious impact on high-relief terrain curvature, but it has no significant impact on low-relief terrain curvature.
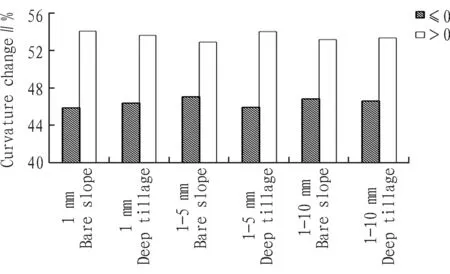
Fig.1Thecurvaturechangeafter1mmdatasimplification
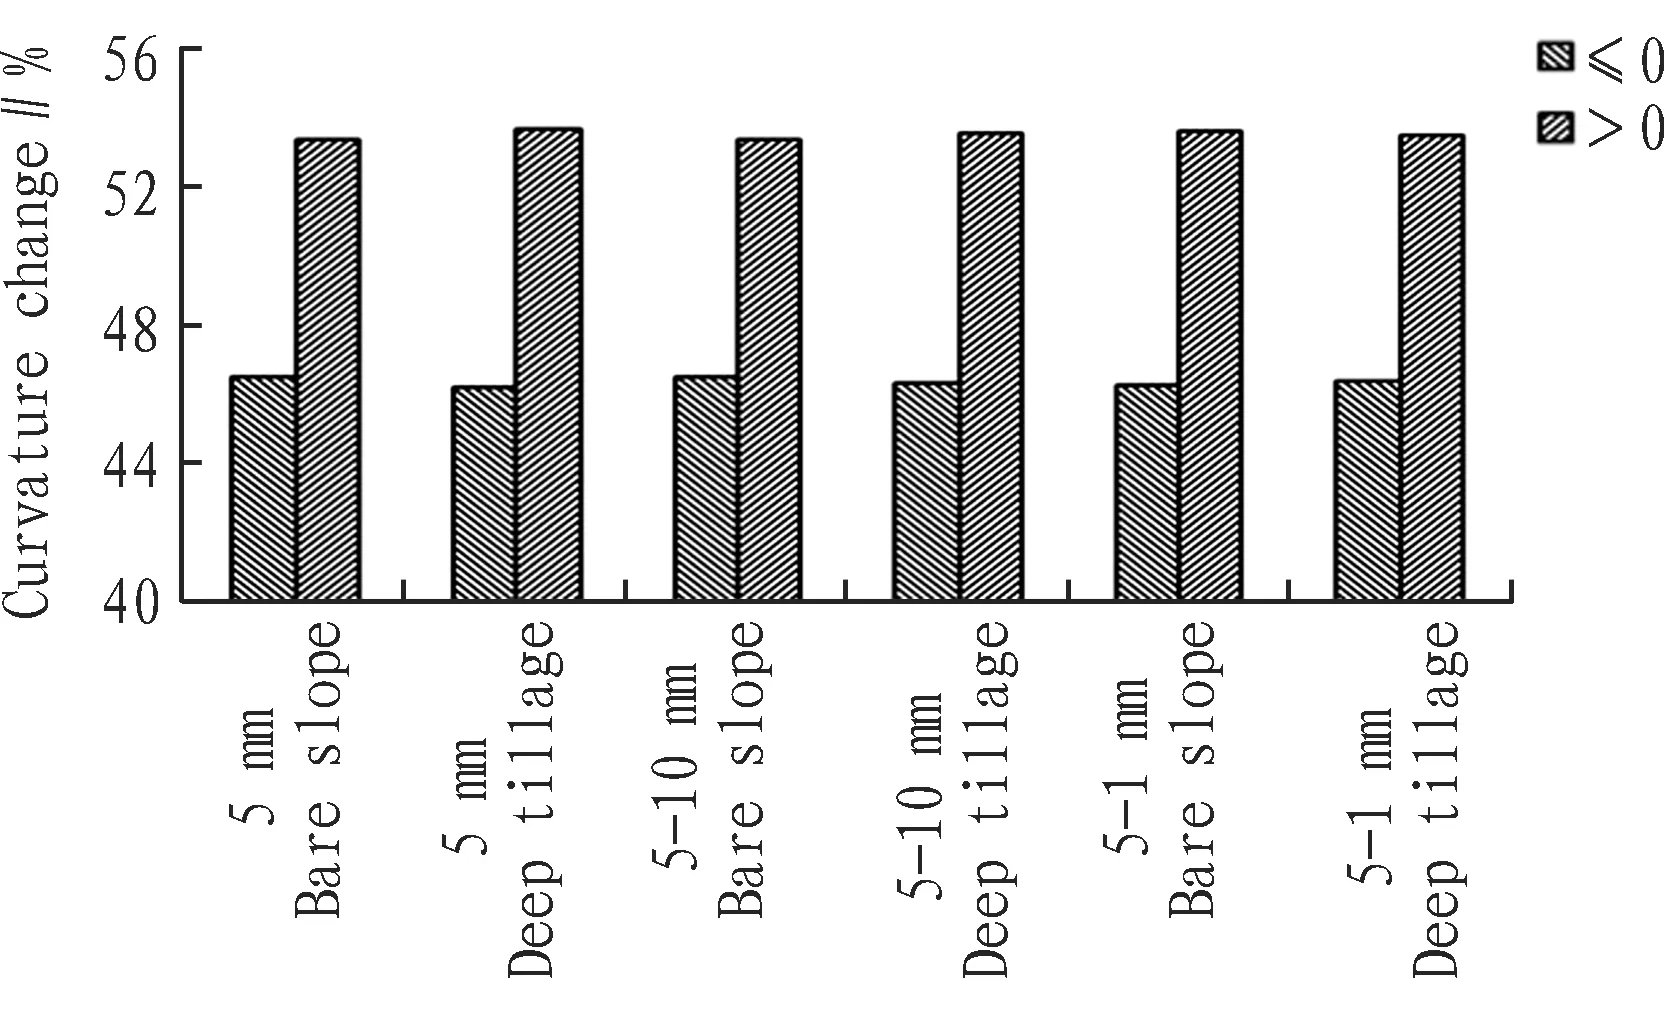
Fig.2Thecurvaturechangeafter5mmdatasimplificationandencryption
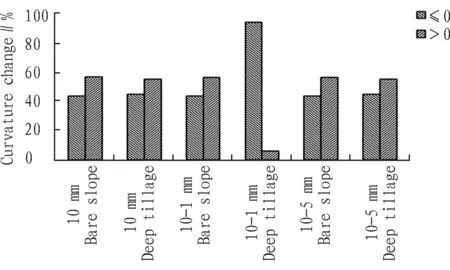
Fig.3Thecurvaturechangeafter10mmdataencryption
3.2Effectofsimplificationandencryptiononmicro-topographyslopeaspectchangeIn ArcGIS, we extract different observation scales and the slope aspect data after simplification and encryption. With 15 ° as one split point, the slope aspect is reclassified. The proportion of raster number in slope aspect to total raster number is used to study the effect of simplification and encryption on slope aspect. As shown in Fig. 4-6, the bare slope aspect change is large at 120°-200° before and after 1 mm simplification and encryption, while the deep tillage terrain slope aspect change is subtle at various slope levels. After 5 mm data simplification and encryption, both bare slope and deep tillage have slight influence on the observation results of slope aspect in each section. After 10 mm simplification, the slope aspect change of bare slope and deep tillage is small and almost negligible, and there are only subtle differences in the high slope section. The unobvious slope aspect change after 5 mm and 10 mm data simplification and encryption, is mainly due to the effect of observation scale on the surface conditions.
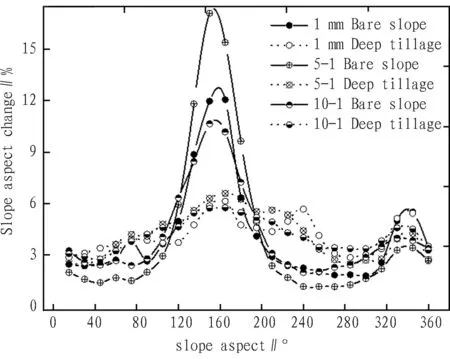
Fig.4Slopeaspectchangeafter1mmdatasimplification
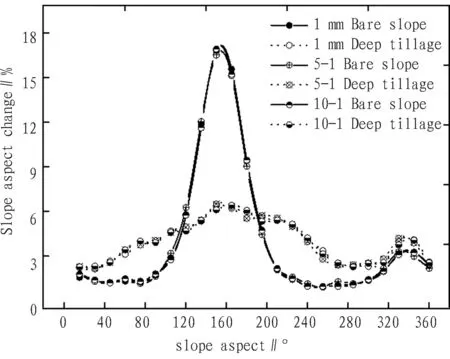
Fig.5Slopeaspectchangeafter5mmdatasimplificationandencryption
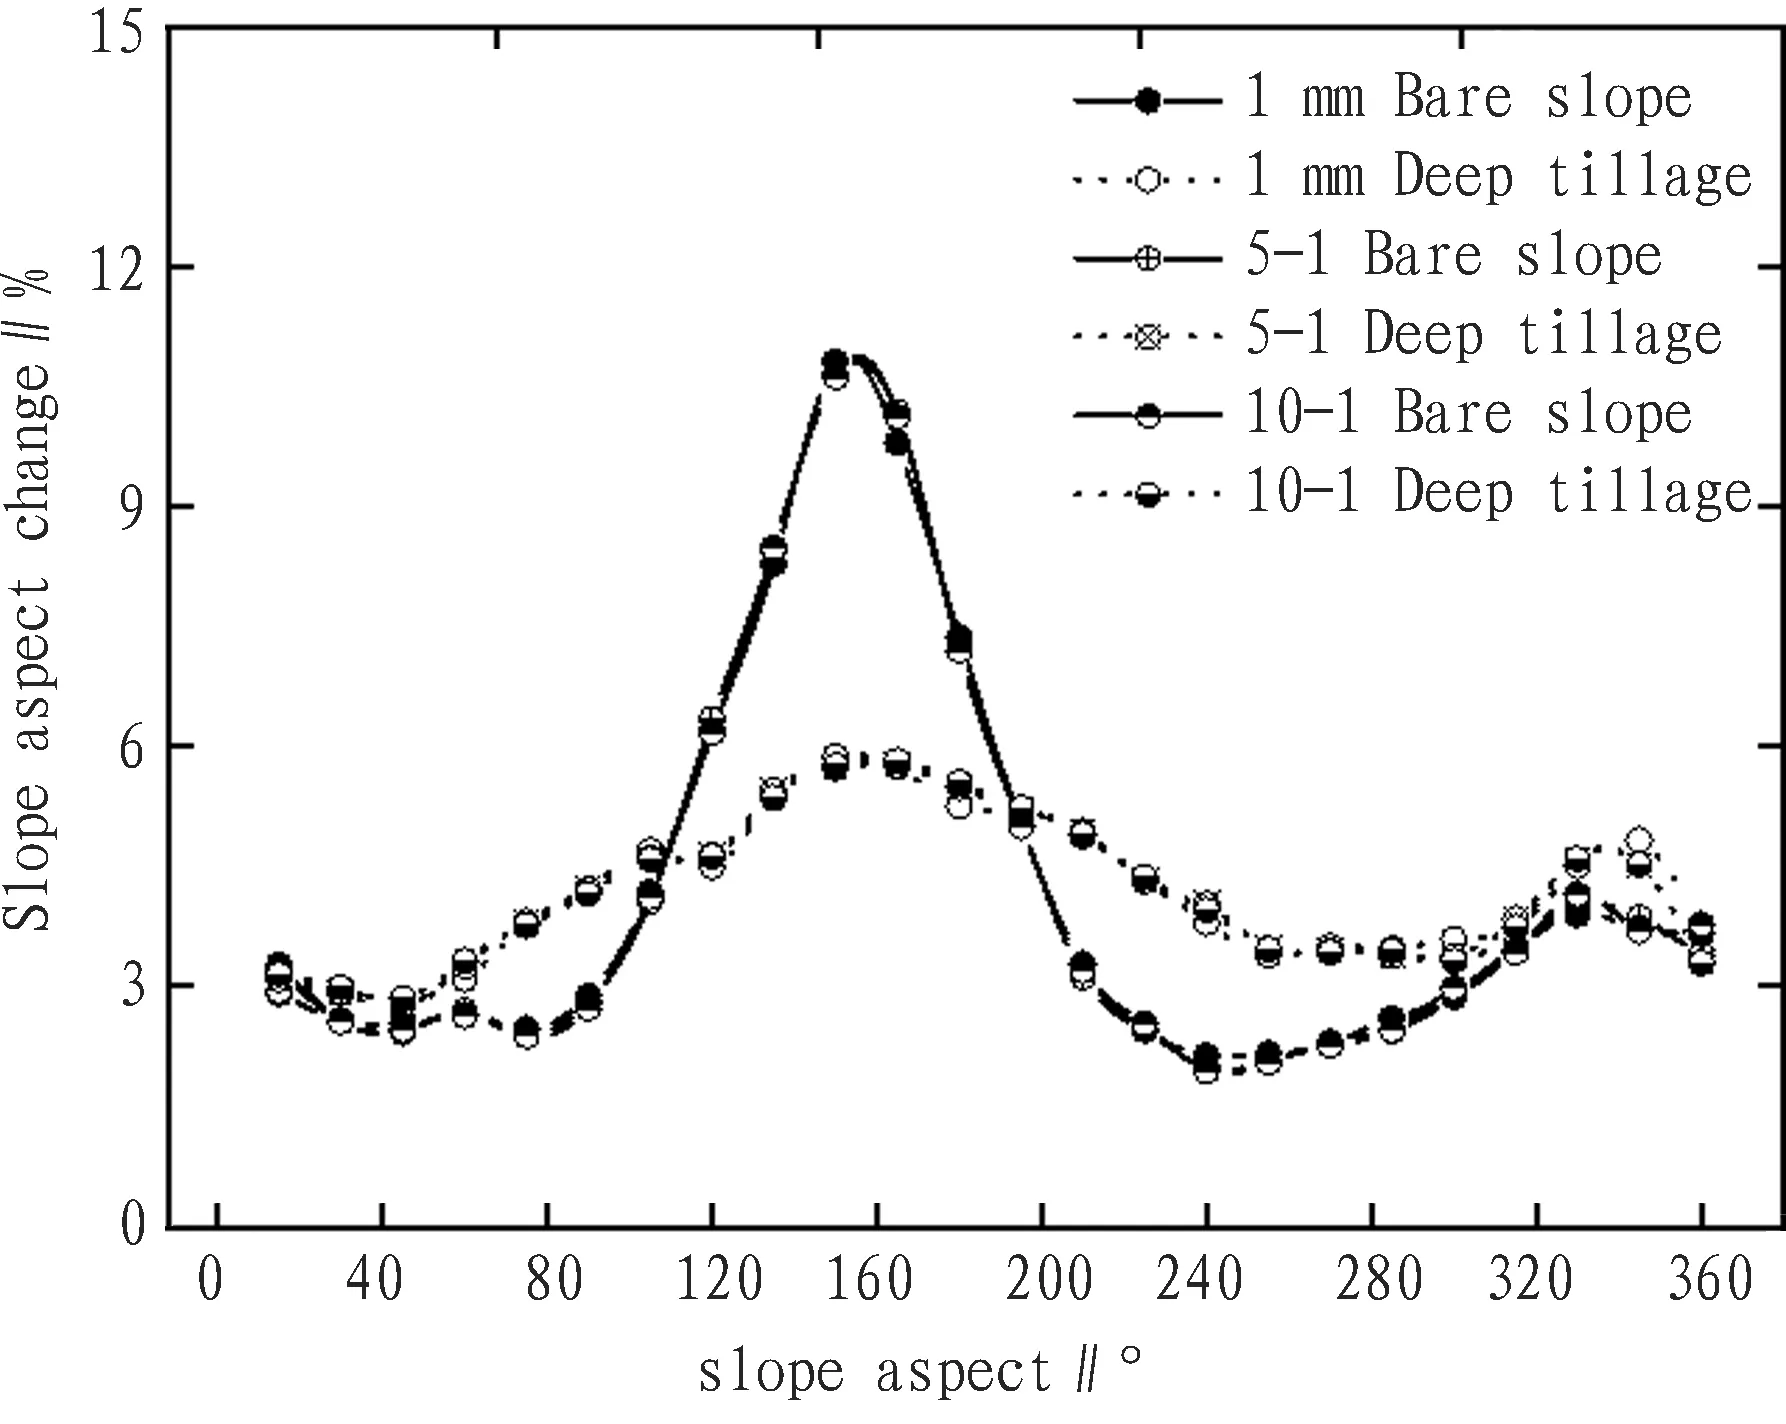
Fig.6Slopeaspectchangeafter10mmdataencryption
3.3EffectofsimplificationandencryptiononsurfaceroughnessThe effect of simplification and encryption on roughness change of the corresponding sloping surfaces is shown in Table 2. After 1 mm data simplification, the surface roughness increases with the increasing simplification scale. Under simplification and encryption of 5 mm bare slope data, roughness increases, and the two treatments have basically the same effect on roughness. For the 5 mm deep tillage, simplification increases roughness while encryption reduces roughness, indicating that encryption has a significant impact on the roughness of two kinds of terrain. In the encryption process of 10 mm bare slope data, the roughness first decreases and then increases with the reduction of encryption scale; in the encryption process of deep tillage slope, the roughness change shows a decreasing trend, and the roughness decline rate tends to increase with the decrease of the scale. Obviously, 1 mm scale simplification has a regular impact on surface roughness; 5 mm encryption and simplification cause complex changes in complex terrain roughness; 10 mm encryption and simplification cause complex changes in deep tillage roughness, and the bare slope change is regular.
Table2Sloperoughnesschangeaftersimplificationandencryption

Item1mmbareslope1mmdeeptillage1-5mmbareslope1-5mmdeeptillage1-10mmbareslope1-10mmdeeptillage5mmbareslope5mmdeeptillage5-10mmbareslopeCurvedsurfacearea1.84951.96531.91161.99071.94952.00481.79351.89221.7941Planearea1.62001.62001.62001.62001.62001.62001.62001.62001.6200Roughness1.14171.21311.18001.22881.20341.23751.10711.16801.1075Item5-10mmdeeptillage5-1mmbareslope5-1mmdeeptillage10mmbareslope10mmdeeptillage10-1mmbareslope10-1mmdeeptillage10-5mmbareslope10-5mmdeeptillageCurvedsurfacearea1.89541.79421.89171.89951.96721.90171.96391.89761.9660Planearea1.62001.62001.62001.62001.62001.62001.62001.62001.6200Roughness1.17001.10751.16771.17251.21431.17391.21231.17141.2136
4 Conclusions
In this paper, we select three indicators (surface curvature, slope aspect and surface roughness) to evaluate the effect of simplification and encryption on micro-topography data analysis. The results show that simplification and encryption have a significant impact on the curvature of high-relief terrain, but have no significant impact on low-relief terrain; the slope aspect change is not significant after 5, 10 mm data simplification and encryption; 1 mm simplification has a regular impact on surface roughness, 5 mm encryption and simplification have a complex impact on high-relief terrain, and 10 mm encryption has a complex impact on high-relief terrain roughness change but a regular impact on bare slope change.
[1] ZHANG LJ, ZHOU RR. Research on cloud data simplification[J]. Journal of Computer-Aided Design & Computer Graphics,2001,13(11):1019-1023. (in Chinese).
[2] LIU C, YANG W. Data capturing and spatial modeling based on 3-D laser ranger scanning[J]. Geotechnical Investigation & Surveying,2006(4):49-53.(in Chinese).
[3] HUANG CL, WU K, XIANG J. 3D laser scanning point cloud data compression method[J]. Science of Surveying and Mapping,2009,34(2):142-144.(in Chinese).
[4] LI ZL, ZHU Q. Digital elevation model[M]. Wuhan: Wuhan University Press, 2001. (in Chinese).
[5] ZHANG XH. On the theory and method of airborne laser radar measurement technology[M]. Wuhan: Wuhan University Press, 2007. (in Chinese).
[6] ZOU QM, LIU XJ. Digital terrain analysis[J]. Geomatics & Spatial Information Technology, 2007(3): 146-146.(in Chinese).
[7] ZHENG ZC, WU FQ, HE SQ,etal. Effects of soil surface roughness on runoff and sediment discharges with laboratory experiments[J]. Transactions of the Chinese Society of Agricultural Engineering, 2007(10):19-24.(in Chinese).
[8] SCHMIIDT J, BRINKMANN ISEJ. Comparison of polynomial models for land surface curvature calculation[J]. International Journal of Geographical Information Science, 2003, 17(8): 797-814.
[9] ZHANG LC, YANG W, LI ZX,etal. Quantification of soil surface roughness during soil erosion using laser micro-topographical scanner[J].Transactions of the Chinese Society of Agricultural Engineering, 2014(22):155-162.(in Chinese).
[10] ZHANG QF, WANG J, ZHAO LS,etal. M-DEM-based micro-topography characteristics of artificial tillage loess slope[J]. Journal of Arid Land Resources and Environment, 2012, 26(9): 1491-1491. (in Chinese).
EBSCO Publishing, headquartered in Ipswich, Massachusetts, is an aggregator of premium full-text content. EBSCO Publishing's core business is providing online databases via EBSCOhost to libraries worldwide. EBSCOhost is used by libraries, schools, academic institutions, medical institutions, and corporations. The company is a subsidiary of Birmingham, Alabama-based EBSCO Industries. EBSCO Industries is located at number 196 of the top 200 privately held companies in the United States by Forbes Magazine. The company's core business is providing online databases via its proprietary software, EBSCOhost, to libraries. EBSCO provides over 350 full-text and secondary databases. Content for these databases include full-text journals, magazines, books, monographs, reports, ebooks, business book summaries and various other publication types. It also provides databases for reference to the health and business sectors, such as DynaMed.
 Asian Agricultural Research2016年10期
- Asian Agricultural Research的其它文章
- Small Town Construction in the 13th Five-Year Plan Period: A Case Study of Shangrao City
- Advances in Researches of Functional Rice
- Ecological and Environmental Protection of Jiangxi Province from the Perspective of Low Carbon Economy
- Government’s Responsibility for Control of Agricultural Environmental Pollution in China
- Feasibility Analysis and Policy Recommendations for Production of Hybrid Rice Seed in Foreign Countries
- A Study on the Funding Management of Agricultural Scientific Research Project in the New Situation
