Numerical simulation and analysis of confined turbulent buoyant jet with variable source*
EL-AMIN Mohamed F., AL-GHAMDI Abdulmajeed, SALAMA Amgad, SUN Shuyu1. Mathematics Department, Faculty of Science, Aswan University, Aswan 8158, Egypt. Computational Transport Phenomena Laboratory (CTPL), Division of Physical Sciences and Engineering(PSE), King Abdullah University of Science and Technology (KAUST), Thuwal 955-6900, Jeddah, Kingdom of Saudi Arabia, E-mail: mohamed.elamin@kaust.edu.sa. College of Engineering and Islamic Architecture, Umm Al-Qura University, Makkah, Kingdom of Saudi Arabia
Numerical simulation and analysis of confined turbulent buoyant jet with variable source*
EL-AMIN Mohamed F.1,2, AL-GHAMDI Abdulmajeed3, SALAMA Amgad2, SUN Shuyu2
1. Mathematics Department, Faculty of Science, Aswan University, Aswan 81528, Egypt
2. Computational Transport Phenomena Laboratory (CTPL), Division of Physical Sciences and Engineering(PSE), King Abdullah University of Science and Technology (KAUST), Thuwal 23955-6900, Jeddah, Kingdom of Saudi Arabia, E-mail: mohamed.elamin@kaust.edu.sa
3. College of Engineering and Islamic Architecture, Umm Al-Qura University, Makkah, Kingdom of Saudi Arabia
(Received August 8, 2014, Revised December 16, 2014)
In this work, experimental and numerical investigations are undertaken for confined buoyant turbulent jet with varying inlet temperatures. Results of the experimental work and numerical simulations for the problem under consideration are presented. Four cases of different variable inlet temperatures and different flow rates are considered. The realizable k-εturbulence model is used to model the turbulent flow. Comparisons show good agreements between simulated and measured results. The average deviation of the simulated temperature by realizable k-εturbulent model and the measured temperature is within 2%. The results indicate that temperatures along the vertical axis vary, generally, in nonlinear fashion as opposed to the approximately linear variation that was observed for the constant inlet temperature that was done in a previous work. Furthermore, thermal stratification exits,particularly closer to the entrance region. Further away from the entrance region the variation in temperatures becomes relatively smaller. The stratification is observed since the start of the experiment and continues during the whole course. Numerical experiments for constant, monotone increasing and monotone decreasing of inlet temperature are done to show its effect on the buoyancy force in terms of Richardson number.
realizable k-εmodel, turbulent jet, stratification, heat stores, CFD
Introduction0F
Although stratification of fluids due to the existence of temperature gradients is not desirable in many processes that require homogenization, it is, in other processes (e.g., heat storage tanks) desirable because of the low mixing mechanisms involved which help to maintain the required temperature distribution. The problem, however, in thermally stratified heat storage tanks is its sensitivity to external disturbance. That is the state of thermal stratification could be destroyed once sufficient disturbance is introduced. In particular,the conditions at the inlet are considered as one example of such disturbance sources. Therefore, it is important to study the effect of inlet conditions on stratification behavior of such systems. Since, in heat storage tanks and in many other applications, fluids enter the tank in the form of buoyant jet, great deal of works on jet flow have been published either experimentally or numerically. However, the problem of buoyant heated jet with variable source temperature as can be found in many industrial and environmental applications, has received relatively little attention. Jet flow can be divided mainly into three types, pure jet, pure plume and forced plume. In pure jets, fluids enter the domain with high momentum fluxes that essentially cause high intensity of turbulent mixing. In pure plume, on the other hand, buoyancy fluxes cause local acceleration leading to turbulent mixing. In the general case of a forced plume a combination of initial momentum and buoyancy fluxes are responsible for turbulent mixing. Several techniques were developed to study jets in confined spaces as will be explained later. Lately, with the increase of computers efficiencies andcapacities, computational fluid dynamics (CFD) became one of the essential tools to exploring the fluids' behavior of such fundamental importance. In turbulent flows the Reynolds average Navier-Stokes (RANS)technique are usually adopted in order to make the system amenable to solution. The problem in using RANS approach however, is that till now, there is no uniform set of equations to model all kinds of turbulent flows and heat transfer scenarios. Therefore, it is important to choose the model which suites the case under investigation and even to calibrate its coefficients in order to fit experimental results. El-Amin et al.[1]investigated the 2-D upward, axisymmetric turbulent confined jet and developed several models to describe flow patterns using realizable k-εturbulence model. Furthermore, CFD analysis of the flow structure of a horizontal water injected jet into a rectangular tank has been done by El-Amin et al.[2]. Their findings were later used by Panthalookaran et al.[3]to calibrate both realizable and RNG k-εturbulence models so that they may be used for simulating stratified hot water storage tanks.
Many experimental works were conducted to highlight the interesting patterns and the governing parameters pertinent to this kind of flows including the work of Agrawal and Prasad[4]and O'Hern et al.[5]and many other authors have investigated several phenomena pertinent to buoyant jets. For example, the problem of bifurcation in a buoyant horizontal laminar jet was studied by Arakeri et al.[6]. With respect to the kind of fluids used in buoyant jet studies, several researchers have considered different fluids for either experimental or numerical investigations. For example O'Hern et al.[5]performed experimental work on a turbulent buoyant helium plume. El-Amin and Kanayama[7,8]studied buoyant jet resulting from hydrogen leakage. They developed the similarity formulation and obtained solutions of the centerline quantities such as velocity and concentration. Furthermore,El-Amin[9]introduced a numerical investigation of a vertical axisymmetric non-Boussinesq buoyant jet resulting from hydrogen leakage in air as an example of injecting a low-density gas into high-density ambient. On the other hand, the mechanics of buoyant jet flows issuing from a general 3-D geometry into an unbounded ambient environment with uniform density or stable density stratification and under stagnant or steady sheared current conditions was investigated by Jirka[10]. An integral model is formulated for the conservation of mass, momentum, buoyancy and scalar quantities in the turbulent jet flow. Furthermore Jirka[11]extended also this work to account for the plane buoyant jet dynamics resulting from the interaction of multiple buoyant jet effluxes spaced along a diffuser line. In the previous work by El-Amin et al.[1],analyses of the components of 2-D axisymmetric vertical unheated/heated turbulent confined jet using realizable k-εturbulence model were conducted. Moreover experimental work was elaborated for temperature measurements of such system to provide verification of the models used. In that work, several models were considered to describe axial velocity, centerline velocity, radial velocity, dynamic pressure, mass flux,momentum flux and buoyancy flux for both unheated(non-buoyant) and heated (buoyant) jet. In that work inlet temperatures were considered fixed. However, in many applications inlet temperatures are not, generally fixed. Many recent related papers can be found in Refs.[12-16].
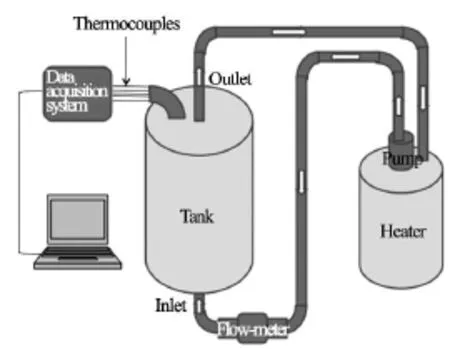
Fig.1 Schematic diagram of the experimental setup

Fig.2 Schematic representation of the calculation domain

Table 1 Summary of the experimental data with variable inlet temperature
In this work, analysis of vertical hot water jet entering a cylindrical tank filled with cold water with variable inlet temperature is conducted. The inlet temperature of the buoyant jet is allowed to change within a small range and is considered as a function of time. Numerical investigations under the above mentioned conditions are performed in order to obtain fields of pressure, velocity, temperature and turbulence. 2-D axisymmetric simplification is assumed to reduce the grid size in the solution domain and the realizable k-εmodel is used to model turbulent flow.
1. Measurements
Schematic diagram of the experimental setup is shown in Fig.1. The cylindrical tank, made of 0.005 m thick galvanized iron sheets, has a diameter of 0.36 m and a height of 0.605 m is shown in Fig.2(a). The inlet pipe is located at center of the bottom of the tank with an inner diameter of 0.02 m. the inlet pipe is inserted in the tank up to a height of 0.06 m above the base of the tank. The outlet pipe, located at center of the top of the tank, has an inner diameter of 0.02 m with a depth in the tank of 0.055 m from the top plate. The uncertainty in the diameter of the inlet and outlet pipes is ±0.001m. This geometry suggests that the tank, the inlet, and the outlet may be modeled as axisymmetric around the vertical axis. Thermal effects are measured by thermocouples of K-type that were calibrated against a standard PT-25 resistance thermometer with an average calibration error of ±0.25 K. The temperature is recorded in Kelvin using a data acquisition system connected with a personal computer. The data acquisition system has an error about ±1K. Moreover, the zero-order error in terms of resolution error for the thermocouples is ±0.005 K. Flow rate is measured using a magnetic-type flowmeter. The operation principle of a magnetic flowmeter is based on the Faraday's law of electromagnetic induction. When water flows through the magnetic field, a small voltage is induced which is proportional to the velocity of the flow and is accurately measured by two stainless steel electrodes mounted opposing each other inside the metering pipe. The resolution error of the voltages read by the flowmeter is negligible because it reads until 6 decimal digits. The instrumental error of the flowmeter is ±3.5%at various values of temperature.

Fig.3 Variable inlet (a) temperature, (b) Reynolds number and(c) turbulence intensity as a function of time for Cases 1-4
The above estimated errors are included in the measured data. Thermal effects are measured by inserting a vertical rod with 9 stainless steel sheathed K-type thermocouples. The nine sensors are distributed at different heights as, 0.06 m, 0.12 m, 0.18 m,0.24 m, 0.30 m, 0.36 m, 0.42 m, 0.48 m and 0.54 m measured from the bottom. The distance between the symmetry axis and the thermocouples' rod is 0.09 m,i.e., in the middle between the symmetry axis and the tank wall. The inlet temperature was measured using another thermocouple which is located at the inlet pipe. It is important to indicate that all precautions have been taken to make sure the geometrical symmetry is achieved in the sense of the alignment of the inlet and outlet tubes, the smoothness of tube materials, the inlet geometry, etc..
For the variable inlet temperature, the used parameters are listed in Table 1. The duration for measurements for each case was approximately 30 min. The inlet temperature and the initial temperature are given in column 2 and 3 of the Table 1, respectively, and the flow rate is given in column 4. The inlet velocity,Reynolds number and turbulence intensity at the inlet nozzle are calculated from the given data.
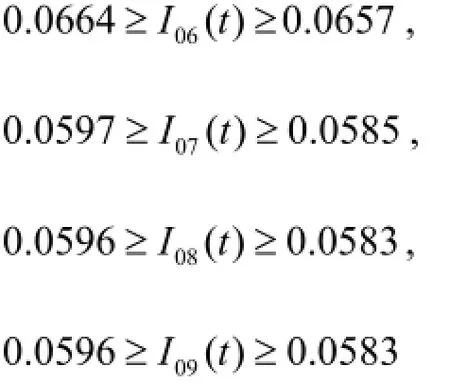
The best fitting for the given curves of the inlet variable temperature, Fig.3(a), can be represented by a 5th order polynomial as a function of time, as given by Eqs.(A1)-(A4) in the Appendix. The corresponding Reynolds numbers, Fig.3(b), and inlet turbulence intensity, Fig.3(c), are calculated as functions of inlet temperature which in turn have been represented by 5th order polynomials of time, which are given in Eqs.(A5)-(A8) and (A9)-(A12), respectively, with the aid of Eqs.(13)-(14). These functions may be represented by other polynomials with less order but the deviation from the measured data will increase.
The following empirical relation (Fluent User's Guide, Fluent Inc.) is used to describe the turbulent intensity at the inlet nozzle as a function of the Reynolds number,I0=0.16(Re)-0.125. The Reynolds number, upon considering the inlet diameter as a length scale, is given by,Re=u0d/n.
The measured temperature profiles for variable inlet temperature are plotted as a function of time, at different sensors positions (Cases 1-4) in Figs.4(a)-4(d). It is apparent that the temperatures along the vertical axis vary in nonlinear fashion with time, especially, at larger heights z≥0.18 m(plume region). Also, the figures indicate that the temperature increases as time increases. Thermal stratification is observed looking at the difference in temperature from top (higher)to bottom (lower). The degree of stratification, however, seems to be more pronounced in the lower half of the tank than in the top half. The stratification is verified from the beginning of the experiment and continues during the whole time.
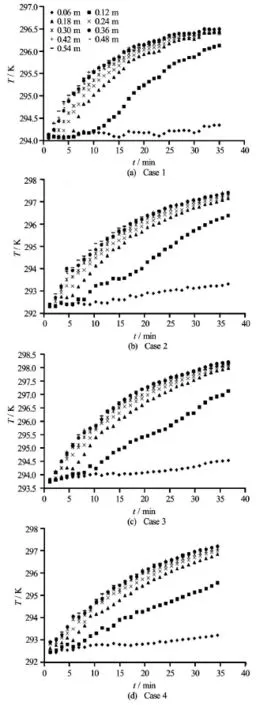
Fig.4 Profiles of measured temperature as a function of time, at different sensors positions, for variable inlet temperature,Cases 1-4
2. Mathematical formulation
A comparison was done by El-Amin et al.[1]totest different turbulence models when simulating confined buoyant jet, and they reported that the best model is the realizable k-εmodel. Therefore, in this work we use this model to simulate the problem under consideration. The realizable k-εmodel developed by Shih et al.[17]involves a new eddy-viscosity formula and a new model equation for dissipationεbased on the dynamic equation of the mean-square vorticity fluctuations. The RANS are given in Eqs.(2)-(3), and the energy equation is represented by Eq.(4). The governing equations of mass, momentum and turbulence are given below.
Continuity equation:

Radial momentum equation:

Energy equation:

Turbulent kinetic energy(k )equation:
Turbulence dissipation rate(ε)equation:
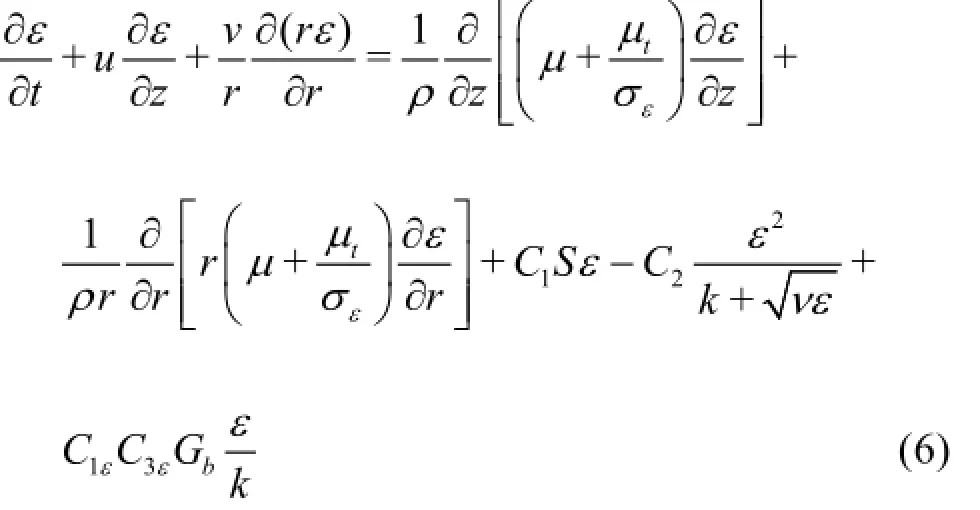
In the above equations,uandvare the mean axial and radial velocity components, respectively. The other quantities are time,t , densityρ, acceleration due to gravity,g , pressure,p , dynamic viscosity,µ, kinematics viscosity,n, thermal conductivity,λ, turbulent Prandtl number fork,σk, turbulent Prandtl number forε,σk,T is the temperature,T0is the reference operating temperature.
The turbulence dissipation rate is denoted byε, whilek is the turbulent kinetic energy of the turbulent fluctuations per unit mass. The turbulent viscosity µtis defined as

where the coefficient Cµis a new variable defined in the realizable k-εmodel and given by the relation:

where
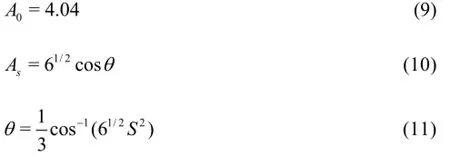

The eddy viscosity formulation is based on the realizability constraints, the positivity of the normal stress and Schwarz inequality for turbulent shear stresses.
Furthermore, in Eq.(20),C1defined by the form

and

is the generation of turbulent kinetic energy due to the mean velocity gradient.

The velocity componentu parallels to the gravitational vector andv is the component of the velocity perpendicular to the gravitational vector. In this way, C3ε=1for buoyant shear layers in which the main flow direction is aligned with the direction of gravity(the case under study). For buoyant shear layers those are perpendicular to the gravitational vector,C3ε=0.
The relation gives the generation of turbulence due to buoyancy

where Prtis the turbulent Prandtl number for energy andβis the thermal expansion coefficient. The model constants of the k-εmodel are established to ensure that the model performs well for certain canonical flows such as pipe flow, jet flow, and boundary layer flow, in this paper C1ε=1.44,C2=1.9,σk= 1.0,σε=1.2and Prt=0.85will be used.
Shih et al.[17]have compared their model (realizable k-εturbulence model) with experimental data as well as with the standard k-εmodel for a round jet flow and other flows. The comparison shows a good matching between their model and the experimental data than the standard model. The realizable k-ε model implies that the model satisfies specific constraints on the Reynolds' stresses that make the model more consistent with the physics of turbulent flows and hence more accurate than the other turbulent models. This model contains a new transport equation for the turbulent dissipation rate. Also, a critical coefficient of the model,Cµ, is expressed as a function of mean flow and turbulence properties, rather than assumed to be constant as in the standard model. This allows the model to satisfy certain mathematical constraints on the normal stresses consistent with the physics of turbulence (realizability). Additionally, the realizable k-εmodel uses different sources and sinks terms in the transport eddy dissipation. The modified prediction ofεalong with the modified calculation of µt, makes this model superior to the other k-εmodels. For the jet flow this model does better in predicting the spreading rate especially, for near region z<0.35(see El-Amin et al.[1]).
Boundary conditions need to be specified on all surfaces of the computational domain. Boundaries presented in this study include inflow (Inlet), outflow(outlet), solid wall and axis of symmetry as shown in Fig.2(b). with Ωin,Ωoutand Ωwalldenote the boundary of the inlet, outlet and wall, respectively. In addition to the non-realistic boundary on the axis of symmetry Ωaxis. The velocity-inlet boundary conditions imposed at the nozzle are

here Tinis defined in Eqs.(A1)-(A4) for the cases of variable inlet temperature.
Due to the stagnant conditions of water inside the tank before the beginning of the influx, all velocity components were initially set to zero. Heat transfer through the walls of the tank is not taken into consideration (adiabatic walls). Density of water, specific heat,thermal conductivity and viscosity are formulated as a piecewise-linear profile of temperature. The turbulence intensity and hydraulic diameter characterizes the turbulence at the inlet boundary. The following equation of empirical correlation for pipe flows is used to describe the turbulence intensity at the inlet boundary as a function of the Reynolds number,

Alternatively, one can use the followingkandεon the inlet boundary as (see Kadem et al.[18])

whered is the nozzle diameter.
The boundary condition on the axis of symmetry is represented by free-slip condition, that is, a non-realistic wall with no-friction when velocity and other components near the wall are not retarded. Unlike the no-slip boundary condition for which flow has zero velocity in the wall, free-slip flow is tangent to the surface. On the axis of symmetry, the radial velocity componentv , and the gradient of the other dependent variables (u,ε,k,T ) were equal to zero. So, one may write

Solid wall boundary conditions are imposed along the solid walls, the no-slip boundary condition for velocities, zero value for turbulent kinetic energy, and zero gradients for temperature and energy dissipation rate were used.

where n1is the outward normal to the wall.
Finally, the outlet boundary at which water discharged freely, can be formulated as

where n2is the outward normal to the outlet boundary.
Also, static pressure can be defined at a known given point in the domain and Fluent will extrapolate all other conditions from the interior of the domain. Initial conditions are described as follows

In fact, very small values are given as initial conditions forkandεinstead of zero to speed up convergence of the solution.
3. Numerical investigations
Figure 2(b) shows the computational domain with dimensions of: radius is 0.18 m and height is 0.605 m. The radius of the inlet and outlet pipes is 0.01 m, while the inlet height inside the tank is 0.06 m and the outlet depth in the tank is 0.055 m. The meshes are built up of Quadratic Submap cells. The number of grid elements used for all calculations is 7 984. Fluent[19]is used to model the flow in the tank by solving the continuity, momentum, turbulence and energy equations.

Fig.5 Grid independence test
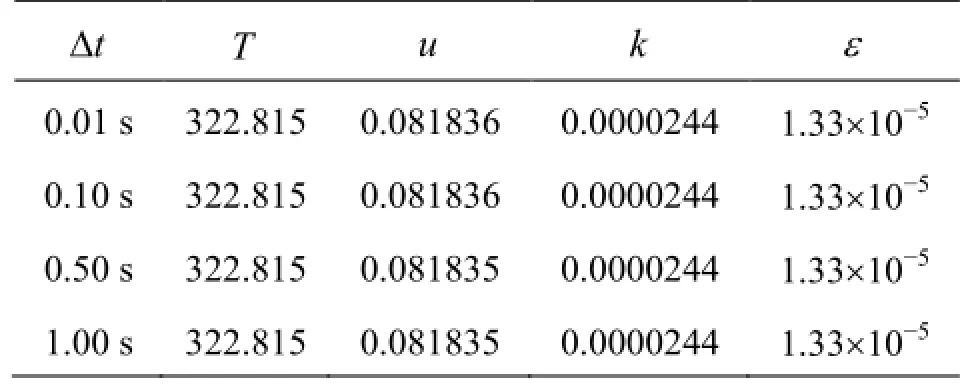
Table 2 Time step comparison for temperature, axial velocity, turbulent kinetic energy and turbulent dissipation rate of kinetic energy, for Case 4
In order to prove grid independence, numerical experiment for Case 4, is repeated on the systematically refined grids in quadrilateral cells of sizes 7 984(grid-1), 9 240 (grid-2), 12 880 (grid-3) and 23 560(grid-4) respectively. The minimum distances between the nodes in the respective grids are 0.00125 m,0.002 m, 0.0014285 m and 0.001 m and the maximum distances between the nodes are 0.0055 m,0.004583 m, 0.00366 m and 0.00275 m respectively in the order of refinement. Figures 5(a), 5(b) show the results of the grid refinement studies for the axial velocity and temperature, respectively. The maximumdeviation caused by grid is about 3% for the velocity,and 0.14 % for the temperature that could be negligible.

Fig.6 Comparison between measured and simulated temperature as function of tank height for variable inlet temperature (Cases 1-4)
In order to achieve convergence, under-relaxation is applied to pressure, velocities, energy, turbulent viscosity, turbulence kinetic energy and turbulent dissipation rate calculations. Body force weighted discretization is used for pressure and the velocity-pressure coupling is treated using the SIMPLE algorithm. A second-order upwind scheme is used in the equations of momentum, energy, turbulence kinetic energy and turbulence dissipation rate. Segregated implicit solver with the implicit second-order scheme is used.
In order to use a suitable time step, we performed a comparison for one case with different time steps as 0.01 s, 0.1 s, 0.5 s and 1 s, shown in Table 2. This comparison includes temperature, axial velocity, turbulent kinetic energy and turbulent dissipation rate of kinetic energy. From this table one can note that the differences are negligible. Then, to reduce the time of calculation we have to use the time step of 1 s.
Both measured and simulated temperatures as a function of the tank height for various times and variable inlet temperatures (Cases 1-4) are plotted in Figs.6(a)-6(d), respectively. Good agreement between the experimental and numerical data is observed. The maximum error observed is 0.35 K, however, for Cases 1, 2, 3 and 4 the maximum error is 0.2 K, 0.2 K,0.35 K and 0.35 K, respectively, occurs after 30 min of charging process.

Fig.7 Normalized axial velocity as a function of r/ czat different positions ofz of Case 4 at t=15 min
3.1 Axial and radial velocities
The mean positive axial velocity,u(excluding the reflected velocity with the negative values) is normalized with reference to the centerline velocity ucagainst r/ cz(r normalized by the jet width b=cz, cis the lateral spread rate of the jet) with different heights, for the Case 4 at 15 min, is plotted in Fig.7. It can be seen from this figure that axial velocity profile shows self-similar behavior. Therefore, axial velocity may be represented by a Gaussian distribution with centerline velocity,uc, height,z , and width,b, as parameters. The Gaussian function takes the form

This empirical model is plotted in Fig.8 along with the comparison with the simulated axial velocity. In this study, the parameter of lateral spread rate of the jet is as reported by Fischer et al.[20]. One can note a relatively large error at small velocities at the both ends of the bell-shaped curve. c=0.11which lies in the range of the standard values
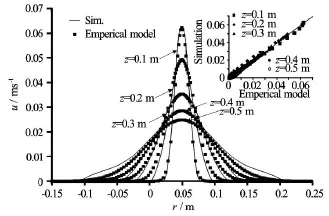
Fig.8 Comparison between simulated and empirical Gaussian model of axial velocity as a function ofr for different positions ofz in the Case 4 at t=15 min
Using the definition of axial velocity, Eq.(24),centerline axial velocity (velocity on the axis of symmetry) can be given as

such that uc=u( r→0).
Alternatively, the centerline velocity may be written in the form

as to be comparable with the common formula of the centerline velocity given in literature. It is notable that Au=Bud,Buspecifies the decay rate of the time averaged centerline velocity.
Dimensional arguments together with experimental observations suggest that the mean flow variables,which are known as similarity solutions, are conforming to Eqs.(25) (Fisher et al.[20]). The continuity equation, Eq.(1), for the time-averaged velocities can be solved by substituting the axial velocity form into Eq.(1) to obtain the cross-stream radial velocity in the form

where

3.2 Dynamic pressure
The dynamic pressure behaves similar to the axial velocity but of course it is a scalar quantity so we do not see negative beaks of the curve. The dynamic pressure can be defined according to the equation


or

where Pcis the centerline dynamic pressure, and h=c /.

Fig.9 Comparison between the simulated dynamic pressure and its Gaussian fitting as a function ofr for different positions ofz in the Case 4 at t=15 min
Figure 9 illustrates a comparison between the simulated dynamic pressure and its Gaussian fitting using Eq.(28) as a function ofr for different positio-ns ofz of the unheated jet at t=5 min(Case 4). This figure shows a good matching for this Gaussian distribution of the dynamic pressure.

Fig.10 Temperature as a function ofz on the axis of symmetry(r =0)with varying times, Case 1
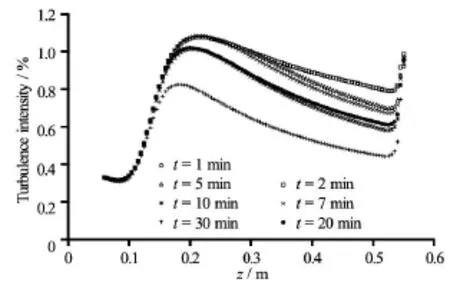
Fig.11 Turbulence intensity as a function ofz on the axis of symmetry(r =0)with varying times, Case 1

Fig.12 Velocity magnitude as a function ofr with varying values of z at t=10 min, Case 3
3.3 Selected simulated results
In Fig.10 temperature profiles are plotted against zat different times. One may notice relatively higher temperatures closer to the inlet up to, approximately, z≈0.12 m, and then it decreases aszincreases. As the time proceeds, the temperature closer to the inlet decreases as shown in the figure while it increases further away. The turbulence intensity as a function of the coordinatez along the axis of symmetry for various times is shown in Fig.11. The turbulence intensity is defined as the ratio of the root-mean-square of the turbulent velocity fluctuations and the mean velocity. Apparently closer to the inlet the velocity fluctuations increases due to the impingement of the jet in the relatively quiescent fluid in the tank. However,away from the inlet the intensity of turbulence decreases because of the decrease in velocity as the jet spreads laterally as manifested in Fig.12. For z≤0.14 m the turbulence intensity is the same all the time, while for z>0.14 mm the turbulence intensity decreases with time. It is interesting to note that inside the outlet pipe the turbulence intensity increases as manifested by the sharp increase in turbulence intensity towards the outlet pipe as a result of the influence of pipe wall.

Fig.13 Temperature as a function ofr with varying values of zat t =10 min, Case 3
The velocity magnitude as a function of radial axis distance,r , at different positions ofzat t= 10 min is plotted in Fig.12. The velocity magnitude in bottom part of the tank is larger closer to the axis of symmetry while it has smaller values far from it (i.e., asr increases). Aszincreases velocity magnitude decreases closer to axis of symmetryz while it increases asr increases. This behavior may be explained by the fact that the jet leaves the inlet with a higher velocity and disperses laterally as it moves far from the source. Figure 13 shows temperature as a function ofr for various values ofzat t=10 min. At the bottom of the tank (i.e., smallz ), the temperature is higher closer to the symmetry axis and it sharply decreases far from it (i.e., as r increases). Therefore, asz increases and the jet disperses more laterally, the temperature closer to the axis of symmetry decreases while increasing as rincreases.
Figure 14 displays the contours of static pressure,velocity magnitude, temperature, and turbulence intensity at 1 min, 10 min, 20 min and 30 min. The contours of the stream function are shown in Fig.15. These figures provide a complete understanding of the flow structures under the current conditions especially in the two regions around inlet and outlet.

Fig.14 Contours of, static pressure (1st row), velocity magnitude (2nd row), temperature (3rd row) and turbulence intensity (4th row) at 1 min (1st column), 5 min (2nd column), 15 min (3rd column) and 25 min (4th column),for Case 4
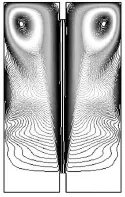
Fig.15 Contours of stream function at 30 min for Case 2
For the bottom part of the tank the flow profiles behave as most of jet flows acts in accordance to the Gaussian distribution with one peak, while the flow seems to be quiet with small velocity around the inlet and it may vanishes under the level of inlet. In the top part of the tank and after impinging the ceiling wall of the tank, three peaks can be seen. One represents the positive main flow inside the jet body and the other two are small close to the wall in the opposite direction (with negative velocity) and it increases as z increases. When the jet impinges the ceiling wall the flow opposites and causes motion from top to bottom close to the walls to form vortex-like structures.
3.4 Jet Richardson number
Richardson number is defined as the ratio of buoyancy to inertia forces. But for more convenience we will define the Richardson number according to the local centerline velocity. Richardson number is calculated using buoyancy-related terms (density difference)and the velocity at the same point. In jet flows,Richardson number takes the form[17]

Richardson number is plotted in Fig.16 against the heightz , at different times for Case 3. From this figure it can be seen that Richardson number is reduced in the region closer to the nozzle inlet, and then it increases with the height. In the bottom part the inertia effect dominates the buoyancy effect (jet-like zone),therefore Richardson number decreases. In the top part of the tank, on the other hand, the buoyancy effect dominates the inertia (plume-like zone) as manifested by the increase of Richardson number. Also, in this zone Richardson number increases with time because temperature increases with time and enhances the buoyancy while it decreases closer to the inlet as the inlet temperature is set to decrease.

Fig.16 Richardson number as a function of the heightz , at different times, with constant inlet temperature
In order to examine the effect of varying the inlet temperature on Richardson number we perform three numerical experiments, one of them with constantinlet temperature, and two with monotone increasing and monotone decreasing inlet temperature, respectively. The inlet temperatures for these numerical experiments are defined as:
Tin=308.9539 K, for the constant inlet temperature,
T=301.5519+0.01t2, for the monotone in
increasing inlet temperature,
T=308.9539-0.01t2, for the monotone de
increasing inlet temperature, where,1min≤t≤30 min, for monotone increasing inlet temperature,301.552≤Tin≤309.962and for monotone decreasing inlet temperature,308.954≤ Tin≤300.554.

Fig.17 Richardson number as a function of the heightz , at different times, with monotone increasing inlet temperature

Fig.18 Richardson number as a function of the heightz , at different times, with monotone decreasing inlet temperature
Figure 16 shows Richardson number for the case of constant inlet temperature. From this figure it can be seen that Richardson number's behavior is similar for all times closer to the inlet (i.e., in the jet-like region). In the plume-like region Richardson number increases with time because of the increase in temperature. Figures 17 and 18 illustrate Richardson number for the monotone increasing and monotone decreasing inlet temperature, respectively. One can notice that Richardson number in the plume-like region in the case of monotone increasing inlet temperature increases with time as a manifestation of the increased buoyancy, Fig.17. On the other hand, for the monotone decreasing inlet temperature, Fig.18, Richardson number decreases in the Jet-like region as a manifestation of the decreased temperature.
4. Conclusion
This work is devoted to investigate the problem of non-uniform inlet temperature of buoyant jet. An analysis for vertical hot water jets entering a cylindrical tank filled with cold water under the condition of variable inlet temperature is introduced. The variable inlet temperature is considered as a function of time of charging process. Experimental measurements are performed for the different cases in sequential time steps for both constant and variable inlet temperature. Numerical investigations under the above mentioned conditions are performed. The realizable k-εturbulence model is used to simulate turbulent flow for this problem. Comparisons between the measured and simulated temperature show good agreements. Selected empirical Gaussian model with standard parameters are used to represent the simulated results. Selected simulated quantities such as velocity magnitude, temperature and turbulence intensity are investigated. The results indicate that temperature varies, approximately,linearly with time for the constant inlet temperature cases, while, it seems to be, approximately, polynomial or logarithms functions of time for the variable inlet temperature, especially, for plume region. Also,thermal stratification exits, however thinner the thermal layers in top part of the tank are than that in the bottom part. The stratification is verified from the beginning of experiment and continues during the whole time.
Acknowledgements
The second author would like to thank the Institute of Scientific Research and Revival of Islamic Heritage, Umm Al-Qura University, for the support of the project (Grant No. 43308012).
[1] EL-AMIN M. F., SUN S. and HEIDEMANN W. et al. Analysis of a turbulent buoyant confined jet modeled using realizable k-εmodel[J]. Heat Mass Transfer, 2010, 46(8): 943-960.
[2] EL-AMIN M. F., SUN Shuyu and SALAMA Amgad. Simulation of buoyancy-induced turbulent flow from a hot horizontal jet[J]. Journal of Hydrodynamics, 2014,26(1): 104-113.
[3] PANTHALOOKARAN V., EL-AMIN M. F. and HEI-DEMANN W. et al. Calibrated models for simulation of stratified hot water heat stores[J]. International Journal of Energy Research, 2008, 32(7): 661-676.
[4] AGRAWAL A., PRASAD A. K. Integral solution for the mean flow profiles of turbulent jets, plumes, and wakes[J]. Journal of Fluids Engineering, 2003, 125(5):813-822.
[5] O'HERN T. J., WECKMAN E. J. and GERHART A. L. et al. Experimental study of a turbulent buoyant helium plume[J]. Journal of Fluid Mechanics, 2005, 544:143-171.
[6] ARAKERI J. H., DAS D. and SRINIVASAN J. Bifurcation in a buoyant horizontal laminar jet[J]. Journal of Fluid Mechanics, 2000, 412: 61-73.
[7] EL-AMIN M. F., KANAYAMA H. Integral solutions for selected turbulent quantities of small-scale hydrogen leakage: A non-buoyant jet or momentum-dominated buoyant jet regime[J]. International Journal of Hydrogen Energy, 2009, 34(3): 1607-1612.
[8] EL-AMIN M. F., KANAYAMA H. Similarity consideration of the buoyant jet resulting from hydrogen leakage[J]. International Journal of Hydrogen Energy,2009, 34(14): 5803-5809.
[9] EL-AMIN M. F. Non-Boussinesq turbulent buoyant jet resulting from hydrogen leakage in air[J]. International Journal of Hydrogen Energy, 2009, 34(18): 7873-7882.
[10] JIRKA G. H. Integral model for turbulent buoyant jets in unbounded stratified flows. Part 1: Single round jet[J]. Environmental Fluid Mechanics, 2004, 4(1): 1-56.
[11] JIRKA G. H. Integral model for turbulent buoyant jets in unbounded stratified flows, Part 2: Plane jet dynamics resulting from multiport diffuser jets[J]. Environmental Fluid Mechanics, 2006, 6(1): 43-100.
[12] CHEN Jian-gang, ZHANG Jian-min and XU Wei-lin et al. Particle image velocimetry measurements of vortex structures in stilling basin of multi-horizontal submerged jets[J]. Journal of Hydrodynamics, 2013, 25(4):556-563.
[13] BARATIAN-GHORGHI Z., KAYE N. B. and KHAN A. A. et al. The merging of two unequal axisymmetric parallel turbulent jets[J]. Journal of Hydrodynamics,2012, 24(2): 257-262.
[14] DU Yu-kun, WANG Rui-he and NI Hong-jian et al. Dynamical analysis of high-pressure supercritical carbon dioxide jet in well drilling[J]. Journal of Hydrodynamics, 2013, 25(4): 528-534.
[15] WANG X. L., LEE J. H. and LU T. J. et al. A comparative study of single-/two-jet crossflow heat transfer on a circular cylinder[J]. International Journal of Heat and Mass Transfer, 2014, 78(7): 588-598.
[16] SHIM Y. M., RICHARDS P. J. and SHARMA R. N. Turbulent structures in the flow field of plane jet impinging on a circular cylinder[J]. Experimental Thermal and Fluid Science, 2014, 57(3): 27-39.
[17] SHIH T. H., LIOU W. W. and SHABBIR A. et al. A new k-εeddy-viscosity model for high Reynolds number turbulent flows-model development and validation[J]. Computers and Fluids, 1995, 24(3): 227-238.
[18] KADEM K., MATAOUI A. and SALEM A. et al. Numerical simulation of heat transfer in an axisymmetric turbulent jet impinging on a flat plate[J]. Advanced Modeling and Optimization, 2007, 9(2): 207-217.
[19] FLUENT INC. Fluent user’s guide[M]. Lebanon, NH,USA: Fluent Inc., 1998.
[20] FISCHER H. B., LIST E. J. and KOH R. C. Y. et al.
Mixing in inland and coastal waters[M]. San Diego,USA: Academic Press, 1979.
Appendixes
The inlet variable temperature may be given as a function of time for each case as follows:

These polynomials are plotted in Fig.3(a). The ranges of variation of the inlet temperature are:

The corresponding Reynolds numbers are:

These polynomials are shown in Fig.3(b). The ranges of variation of the Reynolds numbers are:

Also, the nozzle inlet turbulence intensity can be represented in a polynomial form of time:
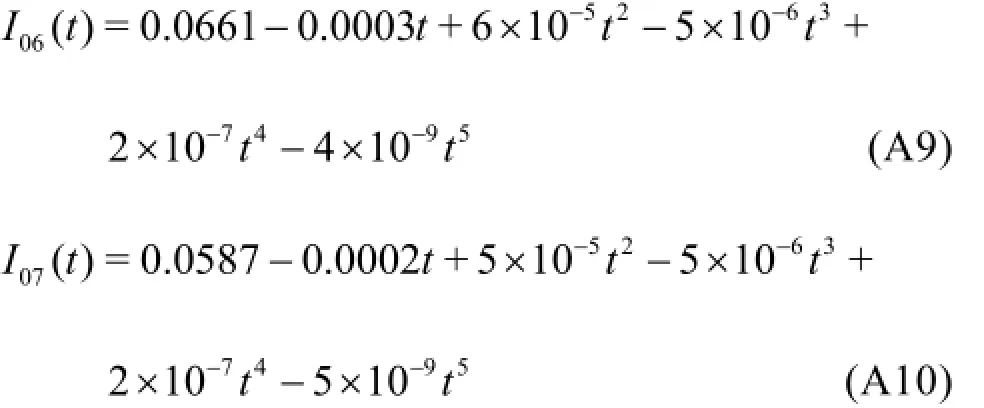

These profiles are illustrated in Fig.3(c). The ranges of variation of the inlet turbulence intensities are:
* Biography: EL-AMIN Mohamed F. (1971-), Male, Ph. D.,Professor
- 水动力学研究与进展 B辑的其它文章
- An effective method to predict oil recovery in high water cut stage*
- Numerical study of im purity distribution in ultrasonic heat meter body*
- Series solution of a natural convection flow for a Carreau fluid in a vertical channel with peristalsis*
- Effects of space and temperature dependent internal heat generation/absorption on MHD flow of a nanofluid over a stretching sheet*
- Effects of Navier slip on unsteady flow of a reactive variable viscosity non-Newtonian fluid through a porous saturated medium with asymmetric convective boundary conditions*
- Hydrodynamics of the interceptor on a 2-D flat plate by CFD and experiments*

