
Validation of the Modified Becker's Split-Window Approach for Retrieving Land Surface Temperature from AVHRR
2015-11-21 11:23:31QUANWeijun权维俊CHENHongbin陈洪滨HANXiuzhen韩秀珍andMAZhiqiang马志强
关键词:志强
QUAN Weijun(权维俊),CHEN Hongbin(陈洪滨),HAN Xiuzhen(韩秀珍),and MA Zhiqiang(马志强)
1 Key Laboratory for Middle Atmosphere and Global Environment Observation,Institute of Atmospheric Physics,Chinese Academy of Sciences,Beijing 100029
2 Environmental Meteorology Forecast Center of Beijing-Tianjin-Hebei,Beijing Meteorological Bureau,Beijing 100089
3 National Satellite Meteorological Center,China Meteorological Administration,Beijing 100081
Validation of the Modified Becker's Split-Window Approach for Retrieving Land Surface Temperature from AVHRR
QUAN Weijun1,2∗(权维俊),CHEN Hongbin1(陈洪滨),HAN Xiuzhen3(韩秀珍),and MA Zhiqiang2(马志强)
1 Key Laboratory for Middle Atmosphere and Global Environment Observation,Institute of Atmospheric Physics,Chinese Academy of Sciences,Beijing 100029
2 Environmental Meteorology Forecast Center of Beijing-Tianjin-Hebei,Beijing Meteorological Bureau,Beijing 100089
3 National Satellite Meteorological Center,China Meteorological Administration,Beijing 100081
To further verify the modified Becker's split-window approach for retrieving land surface temperature(LST)from long-term Advanced Very High Resolution Radiometer(AVHRR)data,a cross-validation and a radiance-based(R-based)validation are performed and examined in this paper.
LST,split-window approach,MODTRAN,AVHRR,validation
1.Introduction
Land surface temperature(LST)is a key parameter in estimating the radiation budget on the land surface because it combines the results of all surfaceatmosphere interactions and energy fluxes between atmosphere and ground(Karnieli et al.,2010;Qian et al.,2013).It is closely related to soil moisture and canopy evaportraspiration and therefore,can be used for monitoring vegetation water stress,assessing surface energy balance,detecting soil drought,investigating urban climate and environment,and indicating land surface thermal conditions(Wan et al.,2004; Weng et al.,2004;Wang et al.,2007;Kustas and Anerson,2009;Weng,2009;Zhu et al.,2015).Furthermore,LST was assimilated into weather prediction models to improve the simulation of land-atmosphere exchange(Price,1982;Diak and Whipple,1993).Due to the strong heterogeneity of land surface characteristics such as vegetation,topography,and soil(Liu Yuanbo et al.,2006;Neteler,2010),and due to the fact that LST changes rapidly on both spatial and temporal scales,LST measurements with detailed spatial and temporal sampling are required in order to capture its distribution and temporal evolution.Given the complexity of surface temperature over land,ob-taining ground measurements is not practical over wide areas.With the development of remote sensing from space,satellite data offer the only possibility for measuring LST over the entire globe with sufficiently high temporal resolution and complete spatially averaged values rather than point values(Wang and Lu,2006;Li et al.,2013a).
Supported by the Meteorological Key Technology Integration and Application Program of the China Meteorological Administration(CMAGJ2013Z20 and CMAGJ2015Z19).
∗Corresponding author:quanquan78430@163.com.
©The Chinese Meteorological Society and Springer-Verlag Berlin Heidelberg 2015
Up to now,several LST retrieval algorithms have been proposed in terms of various sensors aboard different satellites. These algorithms can be roughly grouped into three categories:the single channel algorithms(Ottl´e and Vidal-Madjar,1992;Qin et al.,2001;Jim´enez-Mu˜noz and Sobrino,2003;Jim´enez-Mu˜noz et al.,2009),the split-window algorithms(Becker,1987;Becker and Li,1990;Coll et al.,1994;Prata,1994;Sobrino et al.,1994;Wan and Dozier,1996;Tang et al.,2008;Quan et al.,2012),and the multi-angle algorithms(Prata,1993;Sobrino et al.,1996;Li et al.,2001),provided that the land surface emissivities(LSEs)are known a priori.If the LSEs are not known,the algorithms can be categorized into three types:stepwise retrieval method,simultaneous retrieval of LSEs and LST with known atmospheric information,and simultaneous retrieval with unknown atmospheric information(Li et al.,2013a).
Validation of satellite derived LST product is also important because it not only provides useful information for users to understand the reliability and accuracy of LST product but also offers feedback for algorithm developers to further improve the retrieval algorithm. There are three methods,to date,which are generally used to verify LST retrieved from space:the temperature-based method(T-based),the radiance-based method(R-based),and the crossvalidation method.The T-based method fulfills verification by comparing the retrieved LST with the coincident ground measured LST(Wan et al.,2002;Coll et al.,2005;Pinker et al.,2009).Its main merit is that it provides a direct evaluation of the retrieved LST with the ground measured LST(Li et al.,2013a). However,the reliability of the T-based validation depends heavily on the accuracy of the ground LST values and how well they represent the LST on the satellite pixel scale.Because of pixel scale discrepancies between satellite and ground instruments and the heterogeneities of ground,validating retrieved LST by using the T-based method is a complex and difficult task.The R-based method is an advanced alternative method for validating space-based LST measurements(Wan and Li,2008;Coll et al.,2012).This method does not rely on ground-measured LST values but it does require the LSE spectra and the measured atmospheric profiles over the validation site at the time of the satellite overpass(Wan and Li,2008;Li et al.,2013a).The R-based method uses the satellitederived LST,the measured atmospheric profiles,and the LSEs as input parameters to an atmospheric radiative transfer model(RTM),such as the Moderate Resolution Transmittance Model(MODTRAN)(Berk et al.,2003),to simulate the radiance reaching the top of atmosphere(TOA)when the satellite overpasses.The inputting LST is not adopted until the simulated radiance matches the satellite-measured radiance.Only then is the input LST recognized as a true LST value and is further used as a criterion to evaluate the accuracy of the retrieved LST.The success of the R-based method depends on the accuracies of the atmospheric RTM,the atmospheric profiles,and the LSEs on pixel scale.The cross-validation method uses a well validated LST product,e.g.,the MYD11A1,as a reference and compares the satellite-derived LST to the reference product(Frey et al.,2012).The success of this method relies on the spatial-temporal matching accuracy and the reliability of the reference product.
In our previous work,we have compared the Advanced Very High Resolution Radiometer(AVHRR)LST image retrieved from the modified Becker and Li's approach with the corresponding Moderate Resolution Imaging Spectroradiometer(MODIS)LST product over Beijing(Quan et al.,2012).To fully verify the performance of the modified Becker's approach,however,it is still necessary to validate the LST products of AVHRR retrieved from the modified Becker's approach by using diverse validation methods over wide regions.The current paper serves this purpose.In this paper,Section 2 reviews the modified Becker's split-window approach for retrieving LST from longterm AVHRR data.A brief description of the MODISLST/LSE products and the cross-validation procedure and results are also given in this section.Section 3 presents the procedure of the R-based method to validate the modified Becker's LST retrieval.The last section gives the conclusions and discussion.
2.Cross-validation
2.1 Scheme of cross-validation
The key points of the cross-validation method depend on the matching accuracies in observing time,location,and view angle between two LST products as well as quality of the reference LST product.It is well known that the observing times for all pixels in one image are nearly the same while the local solar times for them are quite different.For instance,in a polar-orbit satellite image such as an MODIS image,the difference in the local solar time between the east and the west pixels along the scanning line can be up to 1.5 h,which means that the east pixels are exposed to solar irradiation approximately 1.5 h before the west ones if the sky is clear(Duan et al., 2014).As a result,the LST products derived from the same satellite cannot be compared if the differences in the local solar times of the pixels are significant.This phenomenon also affects LST products acquired by different satellites at different times,and significantly limits the applicability of the instantaneous LST products(Li et al.,2013a).Therefore,in this paper,a point-based comparison scheme is chosen instead of the image-based comparison to guarantee that each comparison is highly spatially-temporally matched.This minimizes potential discrepancies due to location,observation time,and view zenith angle.
In this paper,548 weather stations are selected as validation sites(Fig.1).The land cover types include forests,shrublands,grasslands,croplands,urban areas,barren lands,desert,etc.(Fig.2).
First,the LST pairs from the AVHRR LST and the MYD11A1 products for 2002-2008 are extracted according to the positions(longitude and latitude)of the validation sites.The LST pairs thus selected must satisfy four criteria:(1)the local solar time difference for each pixel pair should less than 10 min to minimizethe temporal match error as much as possible;(2)the quality control(QC)bit flag of the MYD11A1 must be equal to 0,which means that the MODIS LST value selected as reference has good data quality,is cloud free,has a small error in emissivity,and so on;(3)the AVHRR LST pixel must be cloud free;and(4)the view zenith angle difference between AVHRR and MODIS is less than 5°.Then,statistical analysis is performed to validate the LST pairs by using the MODIS MYD11A1 LST value as a reference to illustrate the accuracy and consistency of the AVHRR LST product.

Fig.1.Locations of the validation sites(red dots)and radiosonde stations(blue rectangles).
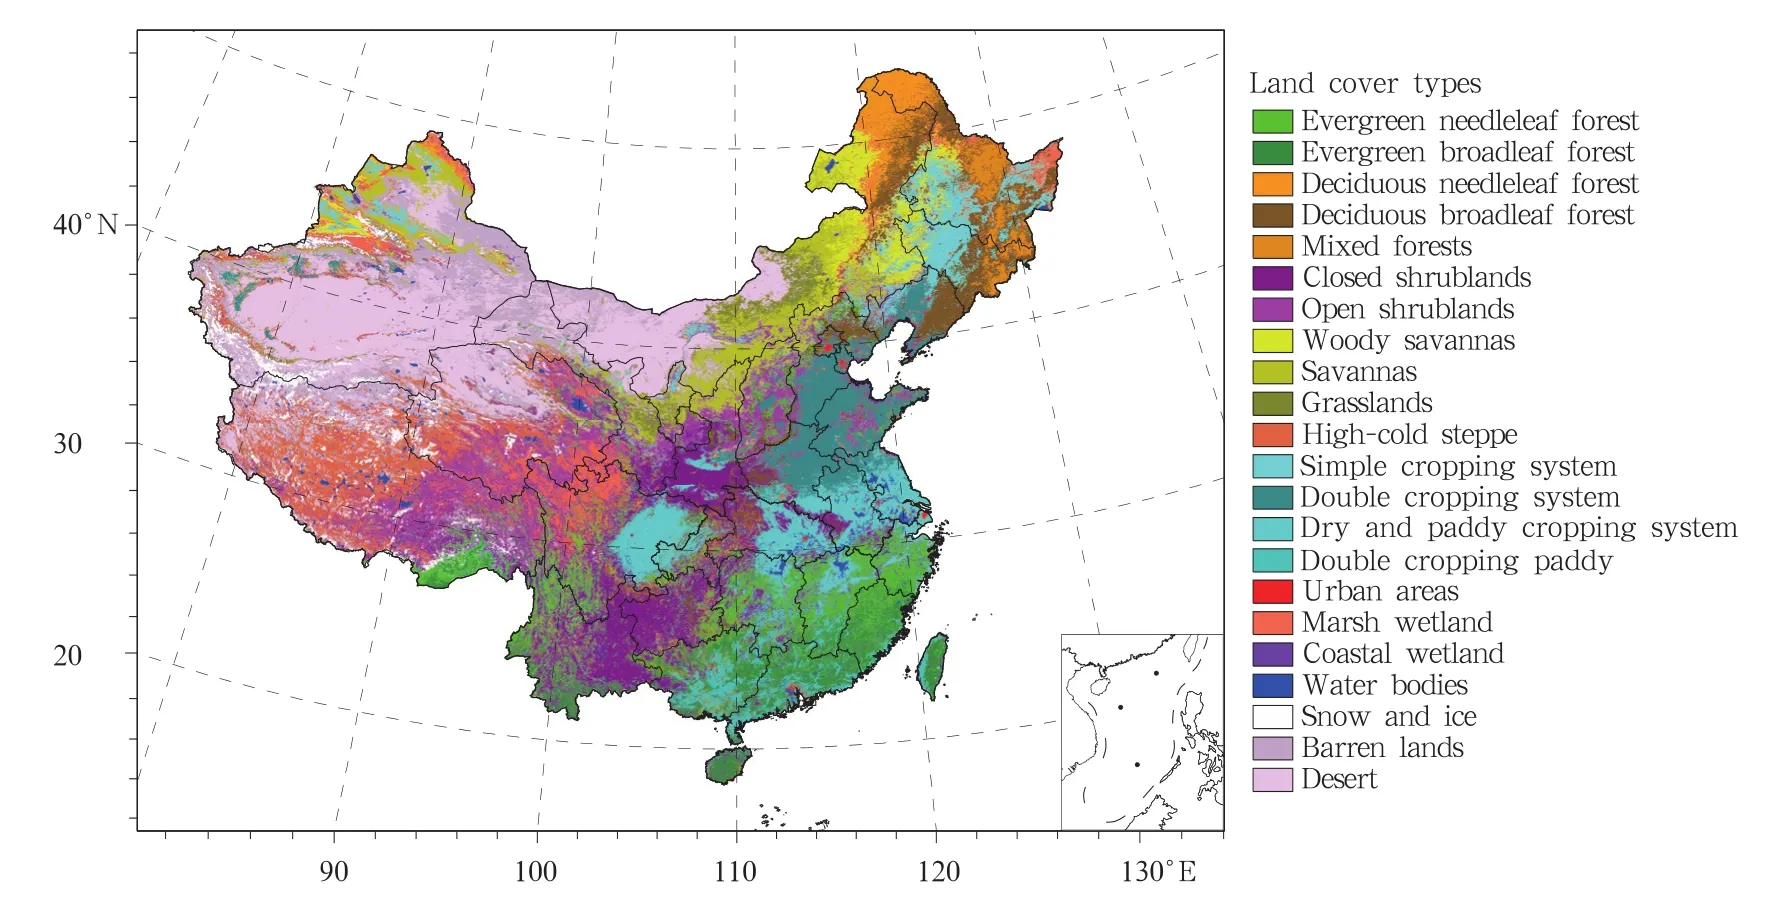
Fig.2.Land cover types(from Liu Yonghong et al.,2006).
2.2 AVHRR LST products
The AVHRR LST product is obtained by using the modified Becker's split-window approach(Quan et al.,2012)from long-term AVHRR data.The equation of the local split-window LST retrievalalgorithm proposed by Becker and Li(1990)is expressed as:

where Tsis the LST;T4and T5are brightness temperatures in channels 4 and 5 of the AVHRR,respectively.The regression coefficients A0,P,and M are calculated by using the following equation: where ε=(ε4+ε5)/2 is the average emissivity,and Δε= (ε4-ε5)is the emissivity difference between channels 4 and 5.It is noted that the original regression coefficients A0,α,β,γ′,α′,and β′in Eq.(2)were calculated in terms of the spectral response functions(SRFs)of channels 4 and 5 of NOAA-9 AVHRR.The SRFs of different AVHRRs always have some discrepancies,such as spectral bandwidth and spectral sensitivity,which could result in different brightness temperatures even though the radiance into the sensors is the same.In other words,when the Becker's splitwindow algorithm is applied to the AVHRRs other than NOAA-9 AVHRR,the error of LST could be as large as 2.3 K(Czajkowski et al.,1998).To make the Becker's split-window algorithm applicable to various AVHRRs,the regression coefficients in Eq.(2)were recalculated by using the MODTRAN model simulations along with the SRFs of channels 4 and 5 for AVHRRs aboard nine NOAA satellites from NOAA-7 to NOAA-18(see Table 4 in Quan et al.,2012).
2.3 MODIS LST and LSE products
The MYD11A1 product of version V005 over China from 2002 to 2008 is selected as a reference to validate the AVHRR LST product. The MYD11A1 product is retrieved from the observations of MODIS aboard the Aqua satellite,whoseoverpass time is close to that of NOAA afternoon satellites. The MYD11A1 dataset is downloaded from the Land Processes Distributed Active Archive Center(LP DAAC),which is one of several discipline-specific data centers within the NASA Earth Observing System Data and Information System(EOSDIS)(https://lpdaac.usgs.gov/products/modisproducts-table/myd11a1). There are 12 scientific datasets in the MYD11A1 product.Besides the LST,quality control(QC),view time(local solar time),view angle,and clear-sky coverage,the emissivities in bands 31 and 32 are also included.The emissivities in bands 31 and 32 are estimated based on the land cover type in the pixel,which is determined by the input data of 250 m resolution land cover(MYD12Q1)and daily 1-km snow cover(MYD10-L2),using the land cover classification-based emissivity method(Snyder et al.,1998).
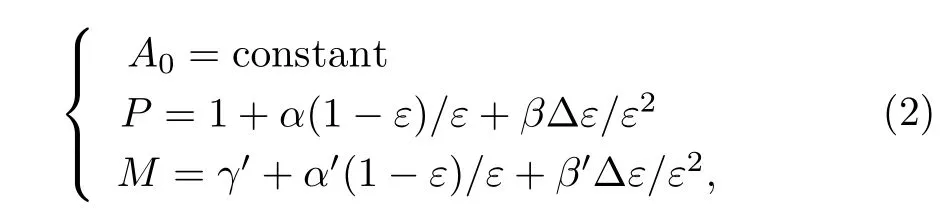
The MYD11A1 product is generated from the level-2 LST product MYD11-L2,in which the LST is derived by using the generalized split-window LST algorithm(Wan and Dozier,1996):
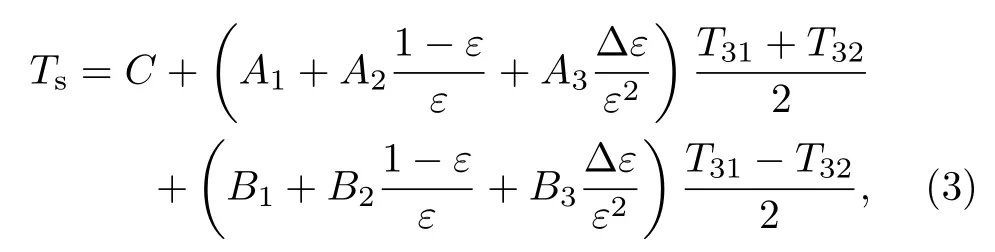
where Tsis the LST;T31and T32are brightness temperatures in channels 31 and 32 of the MODIS,respectively;ε= (ε31+ε32)/2 is the average emissivity,and Δε= (ε31-ε32)is the emissivity difference between channels 31 and 32 of the MODIS;C,A1,A2,A3,B1,B2,and B3are regression coefficients.
2.4 Cross-validation results
2.4.1 LST comparison results
First,extracting is applied to the region of interest(ROI)along with the locations of 548 weather stations(denoted as red points in Fig.1)for the longterm AVHRR LST and MYD11A1 products for producing an LST pair file,in which each line consists of the LST pair and some auxiliary data that are extracted from the AVHRR and MYD11A1 at the same location,e.g.,the observing time and view zenith angle of AVHRR and MODIS,the emissivities in channels 4 and 5 of AVHRR,the emissivities in channels 31 and 32 of MODIS,the QC flag of MYD11A1,etc.Finally,3481 LST pairs that satisfy the criteria described in Section 2.1 are selected from this file and further analyzed.The AVHRR LSTs are higher than the corresponding MYD11A1 in most of the cases(Fig.3a). On the other hand,the AVHRR LSTs,adjusted with a linear regression equation,are close to the MYD11A1 values(Fig.3b).It can be seen from Fig.3b that a good linear relationship exists between the AVHRR LST and the MYD11A1 product.The determination coefficient of regression(R2)is equal to 0.91,the bias is -0.03 K,and the root-mean-square-deviation(RMSD)is 3.0 K.
To further illustrate the performance of the modified Becker's split-window approach,the validation LST pairs are grouped into four categories according to the seasons. Simultaneously,in each category,six sub-categories are also generated in terms of the land cover type,i.e.,forests(evergreen needleleaf forest,evergreen broadleaf forest,deciduous needleleaf forest,deciduous broadleaf forest,and mixed forest),shrublands(closed shrublands and open shrublands),grasslands(woody savannas,savannas,grasslands,and high-cold steppe),croplands(single cropping system,double cropping system,dry and paddy cropping system,and double cropping paddy),deserts(barren lands and desert),and others(urban areas,marsh wetlands,coastal wetlands,water bodies,and snow and ice).The statistical results for the crossvalidation of each category and sub-category are listed in Table 1.
Table 1 indicates that the biggest difference occurs on desert lands for all seasons,for which the AVHRR LST is at least 1.5 K less than the MYD11A1. This phenomenon was also found on bare soil in the previous investigation,in which the errors in the general split-window(GSW)retrieved MODIS LSTs can be greater than near surface temperature by more than 16 K(Wan and Li,2008).On the other hand,the AVHRR LSTs are greater than the MYD11A1 by 0.9 and 0.7 K on forest land in spring and winter,respectively.The LST differences on croplands are close to0 in all seasons except winter,in which the LST difference has a value of 2.0 K.However,this value is not reliable due to the small sample number.Due to the larger seasonal variations of grasslands,the LST difference on grasslands is less than-0.1 K in spring and autumn but greater than 0.7 K in summer and winter,respectively.Table 1 also shows that the RMSD between the AVHRR LST and MYD11A1 ranges from1.6 to 4.1 K,and the mean correlation coefficients(R)for all land cover types are 0.932,0.761,0.957,and 0.954 in spring,summer,autumn,and winter,respectively.The lower correlation coefficient between the AVHRR LST and the MYD11A1 for summer may stem from total water vapor amount(WV)being at its maximum during this season and the different sensitivities of the two retrieval algorithms to WV.
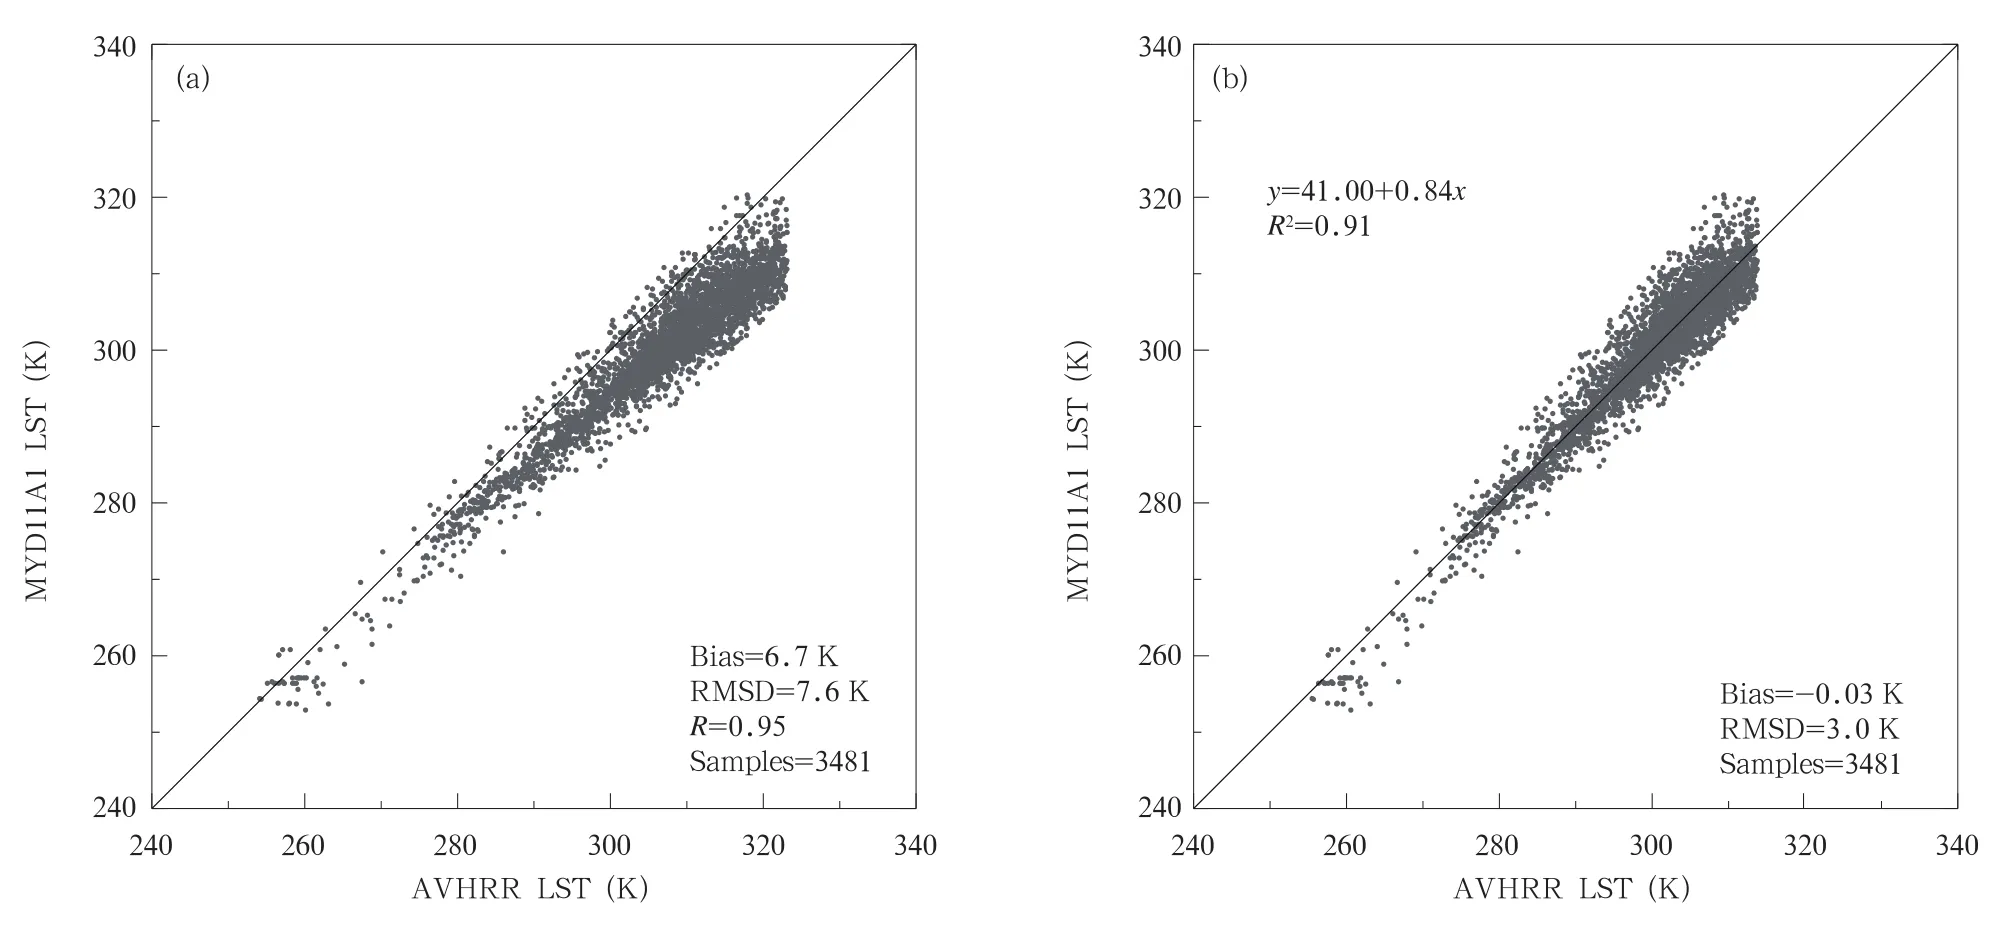
Fig.3.Scatter plots of MYD11A1 versus AVHRR LST derived from the modified Becker's split-window approach.(a)Before regression and(b)after regression.
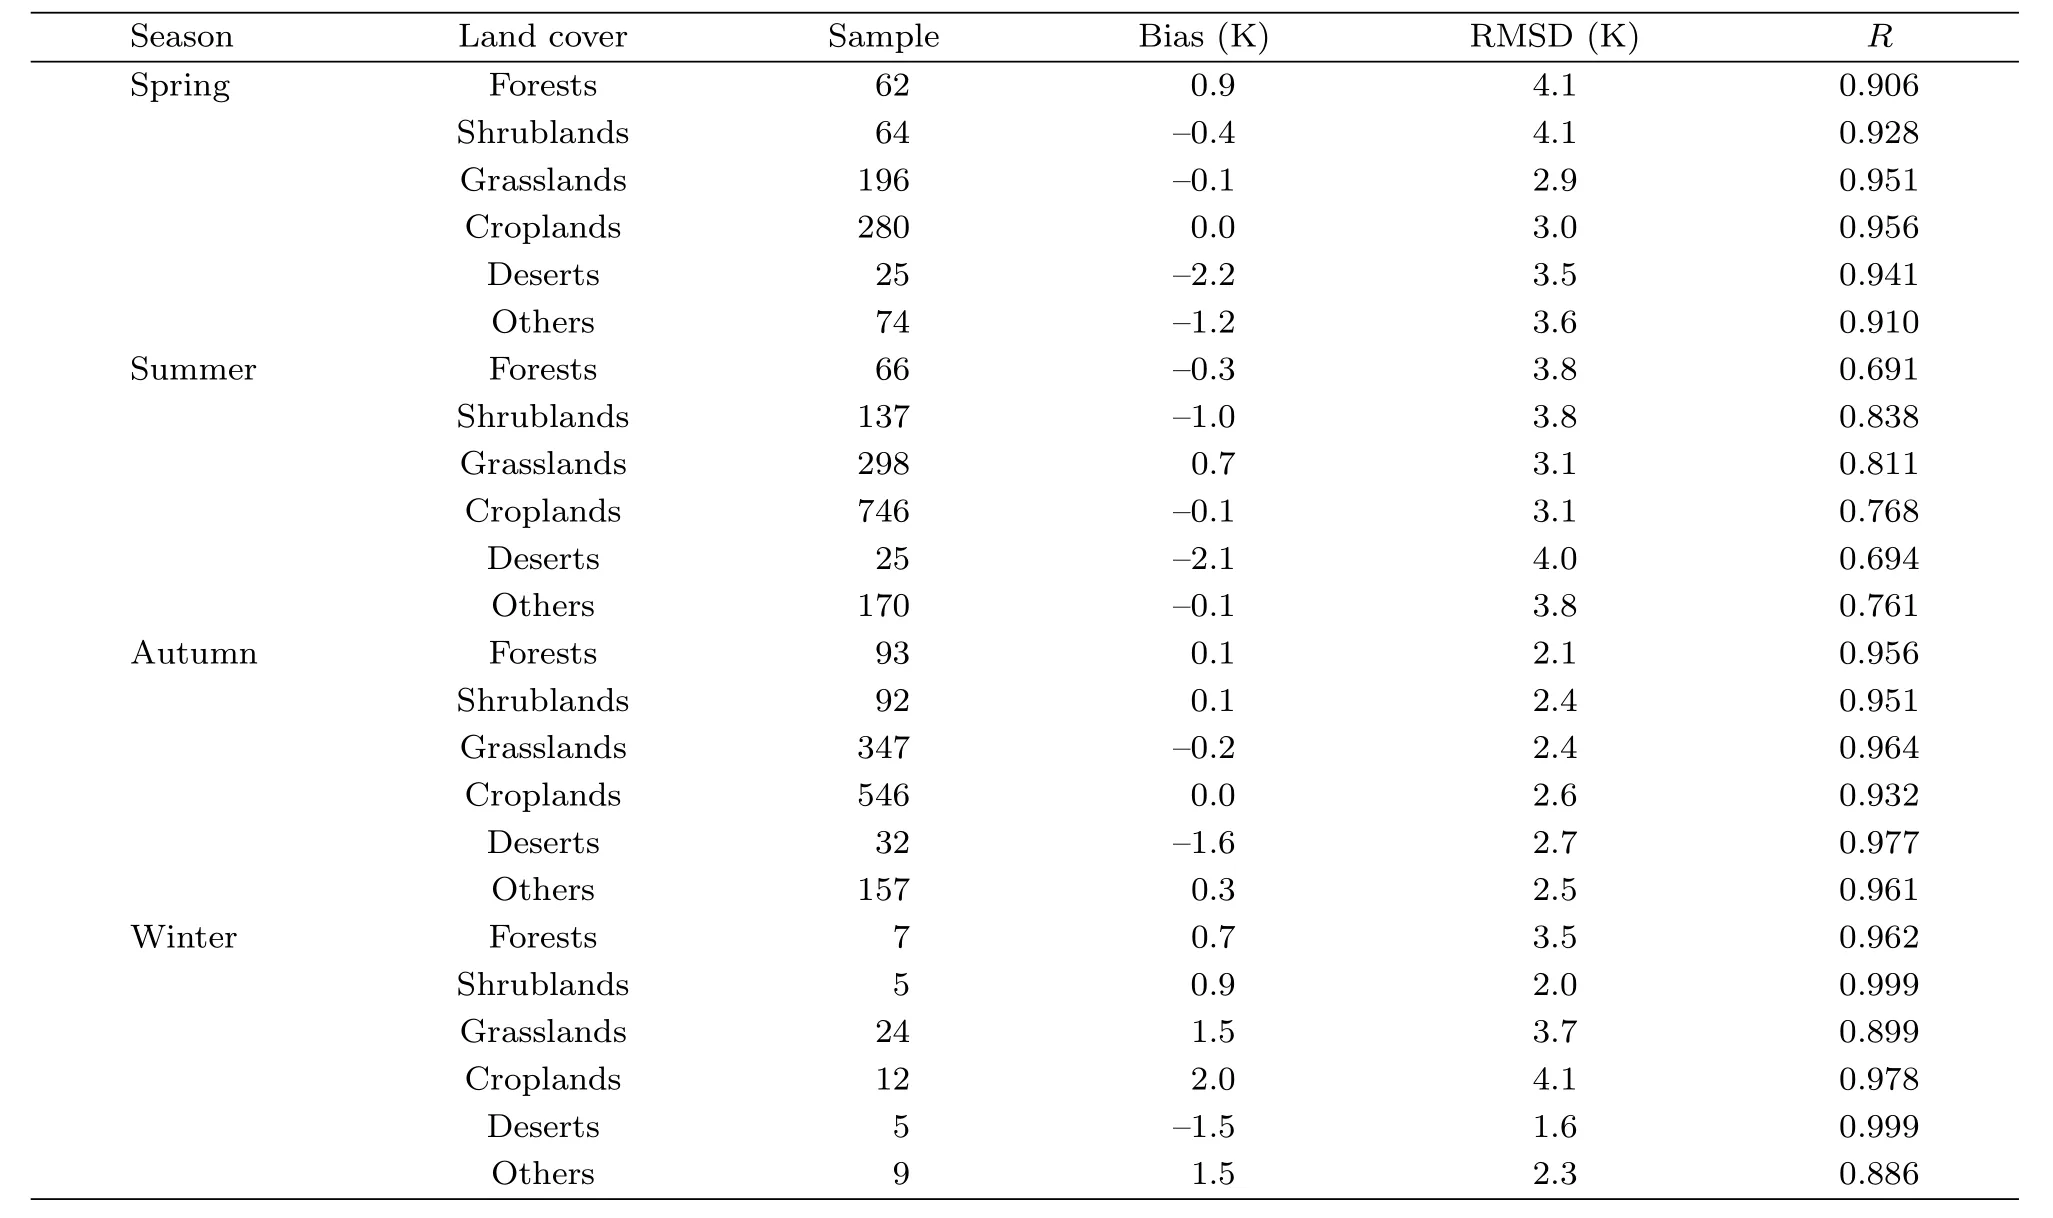
Table 1.Statistical results of the cross comparison between the MYD11A1 and AVHRR LST products for different land cover types
2.4.2 LSE comparison results
It is necessary to explain the spectral characters of the thermal-infrared(TIR)channels of AVHRR and MODIS before comparing their LSE products.The SRFs of Aqua/MODIS and NOAA-18/AVHRR(represents AVHRR sensors)are plotted in Fig.4.
Figure 4 indicates that the spectral width of the MODIS TIR channel is narrower than that of the corresponding AVHRR TIR channel.Additionally,there is almost no overlap between the two adjacent MODIS TIR channels while somewhat overlap exists between channels 4 and 5 of AVHRR.On the other hand,the central wavelength of channel 31 of MODIS tends towards a longer wavelength relative to that of channel 4 of AVHRR.
It should be noted that the LSE estimation methods used in the MYD11A1 and AVHRR LST products are quite different.The land surface emissivities adopted in retrieving MODIS LST are estimated with the classification-based emissivity method(CBEM),which assumes that similarly classified land covers exhibit similar LSEs.On contrast,the land surface emissivities used in deriving AVHRR LST are calculated based on the normalized difference vegetation index(NDVI)value,with a so-called NDVI-based emissivity method(NBEM).The NBEM takes advantage of a statistical relationship between the NDVI calculated from the visible-near infrared(VNIR)data and the LSE in the TIR channels(Van De Griend and Owe,1993;Valor and Caselles,1996;Sobrino and Raissouni,2000).
The reliability of CBEM depends on accuracy of land cover classification,prior knowledge for each class,and precision of the component(endmember)weight within a satellite pixel with coarse resolution(Li et al.,2013b).Snyder et al.(1998)pointed out that the accuracy of CBEM would degrade as a result of the uncertainties in the soil moisture,the annual biophysical cycle of vegetation,and the appearance of snow and ice.In some cases,there is not a direct correlation between the land cover based on the VNIR classification and the LSE in the TIR channel.
Since different formulae are adopted in the calculation of LSEs for soil,mixed soil,vegetation,and dense vegetation types,the main deficiency of the NBEM is the lack of continuity in the LSE values during the land cover type transitioning from soil to vegetation(Sobrino et al.,2008).Difficulty in obtaining a priori knowledge of the emissivities of soil and vegetation is another souce of error in this method(Jim´enez-Mu˜noz and Sobrino,2006).
Owing to the different LSE estimation methodsand the SRF discrepancies in TIR channels between MODIS and AVHRR,it seems unsound to compare the LSEs applied in the MYD11A1 and AVHRR LST products.In this paper,scatter points of the difference in LSE for 3481 validation LSE pairs are plotted in Fig.5 to help users roughly understand the relationships between them.It can be seen from Fig. 5 that the points are symmetrically distributed along the average lines,though the point distribution patterns are dispersive.Meanwhile,the general trends of the LSE differences are also plotted in Fig.5 with red lines,in which the data points are smoothed by using a moving average.Generally speaking,the LSE difference between AVHRR channel 4 and MODIS channel 31 is larger than that between AVHRR channel 5 and MODIS channel 32,and the average LSE difference(standard deviation)is-0.0092(0.0104)and-0.0038(0.0058),respectively.
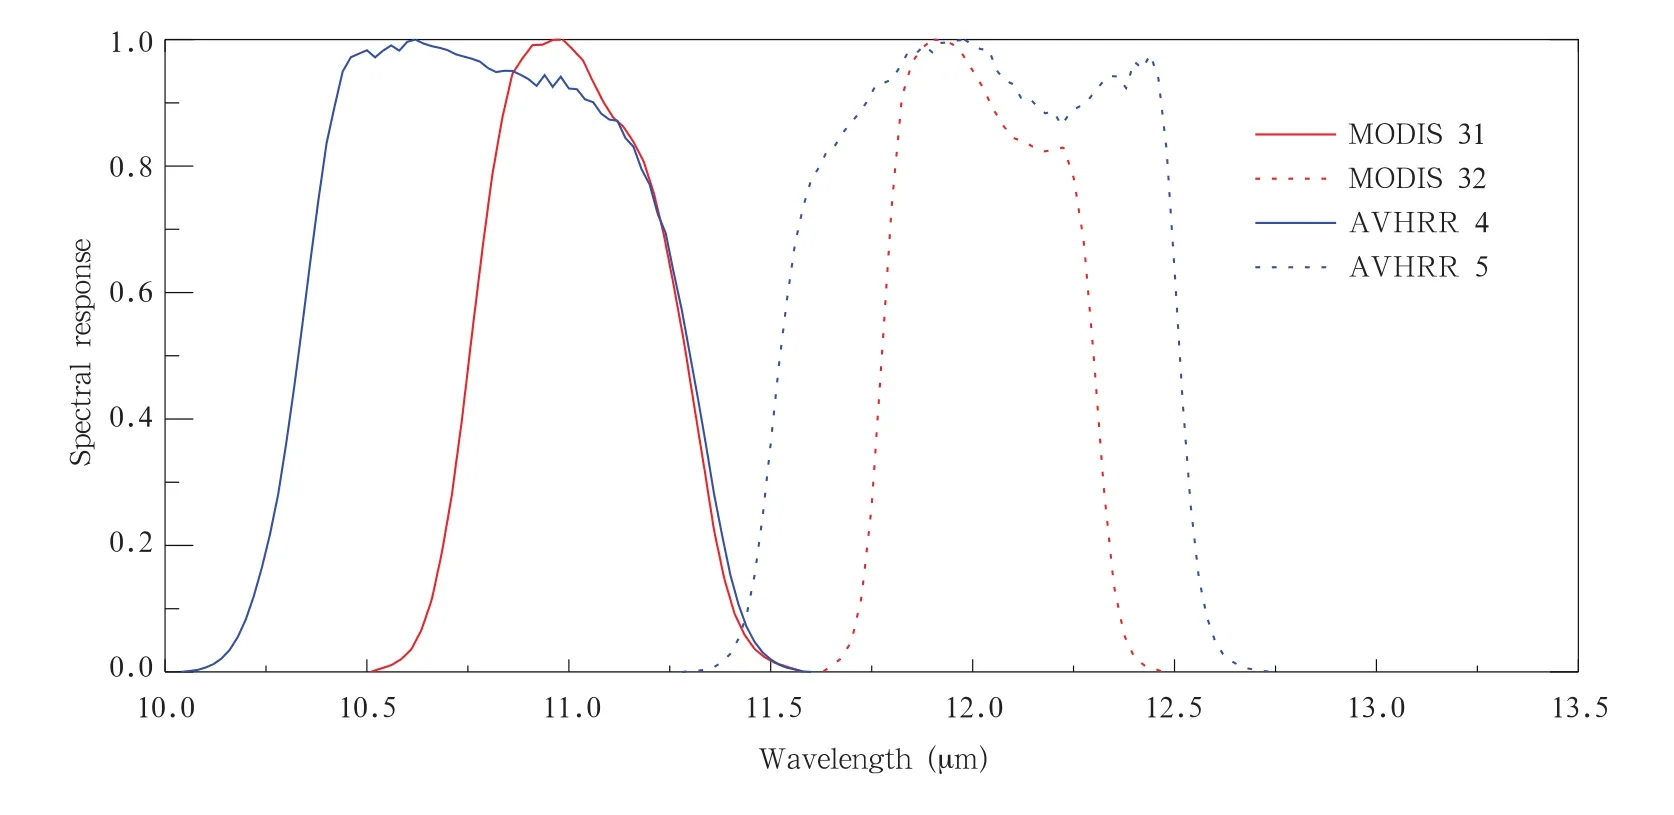
Fig.4.Aqua/MODIS and NOAA-18/AVHRR spectral response functions.
3.Radiance-based validation
3.1 Scheme of R-based validation
Wan and Li(2008)presented a radiance-based validation method to verify the MODIS LST V5 product.The core steps of this method contain three parts:1)calculate the TOA radiance in MODIS channel 31 by using the MODTRAN 4 code with the assumption that the surface emissivity spectrum and the atmospheric profiles have been precisely measured;2)simulate the radiance in MODIS channel 31 using the MODTRAN model by adjusting the input LST value. If the simulated radiance in MODIS channel 31 is equal to that measured by the MODIS sensor,the last input LST is considered the true LST value;and 3)comparethe retrieved MODIS LST with the last input LST in the second step.This method is suitable for validating the LST product in both day and night conditions and does not rely on ground-measured LST values.

Fig.5.Scatter plots of LSE differences(a)between AVHRR channel 4 and MODIS channel 31 and(b)between AVHRR channel 5 and MODIS channel 32.Blue points denote the differences in LSE between AVHRR and MODIS,and red lines are the results of those points after being smoothed by a moving average.Mean and Stddev are the mean value and standard devation calculated from the smoothed values,respectively.
The flow chart of the R-based validation method employed in this study is shown in Fig.6.First,the AVHRR LST product is derived from the AVHRR L1B data by using the modified Becker's split-window algorithm. Second,the TOA brightness temperature in AVHRR channel 4 and retrieved LST at four radiosonde stations(Beijing,Chifeng,Qingdao,and Zhangqiu)are extracted by using the ROI extracting method along with the positions of the stations from the AVHRR L1B and the AVHRR LST product,respectively.Third,atmospheric temperature and humidity profiles for the whole atmoshpere at the radiosonde stations are rebuilt by assembling the radiosonde balloon measurements,whose maximum detecting altitudes are lower than 30 km in most cases,and the standard atmospheric profiles with the altitude higher than 30 km.Fourth,the land surface emissivity estimated with the NDVI by using the NBEM method,the atmospheric profiles,and the initial surface temperature(Ts)are input into the MODTRAN 4.1 model to calculate the radiance reaching the TOA. The radiance is then further converted to the brightness temperature by using the inverse of Planck's radiation equation(Robel,2007,2009).This step does not stop until the simulated brightness temperature matches that observed by the AVHRR at the stations. Then,the input Tsis recognized as the true value of LST,i.e.,the inverted LST.Finally,the statistical results are given on the basis of the comparison between the inverted and the retrieved LST data.
3.2 Atmospheric profiles
Accurate temperature profile and total water vapor amount are two key parameters in the R-based LST validation method. It is worth noting that the observation times of routine radiosonde balloons are usually fixed at 0000 and 1200 UTC,which differs from the overpass times of the afternoon NOAA satellites.Fortunately,two additional observations at 0200 and 1400 BT(Beijing Time)during summer were performed at some radiosonde stations in China.In this paper,21 atmospheric profiles at 4radiosonde stations,observing at 1400 BT under clear sky conditions,are selected as input parameters into the MODTRAN and plotted in Fig.7.The four radiosonde stations(denoted with blue rectangles in Fig. 1)include Beijing(54511),Chifeng(54218),Qingdao(54857),and Zhangqiu(54727)stations.The differ-ences between the radiosonde balloon observation time and the satellite overpassing time are limited to 30 min in order to guarantee that these atmospheric profiles can represent the atmospheric conditions when the satellites are overpassing.These radiosonde balloon data come from the mandatory pressure level dataset of China Radiosonde Archive version 1.0(CRA-M1.0),produced by the National Meteorological Information Center of the China Meteorological Administration.At the same time,the WV values are also calculated by integrating the humidity profiles for the whole atmosphere(Yang and Qiu,2002),and are listed in Table 2.
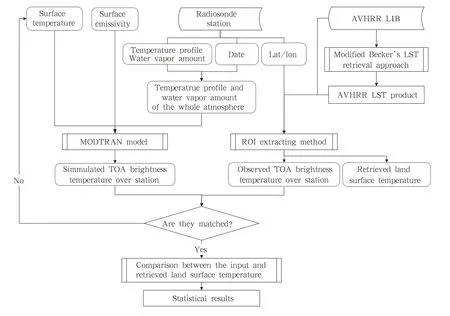
Fig.6.Flow chart of the R-based method to validate AVHRR LST product.
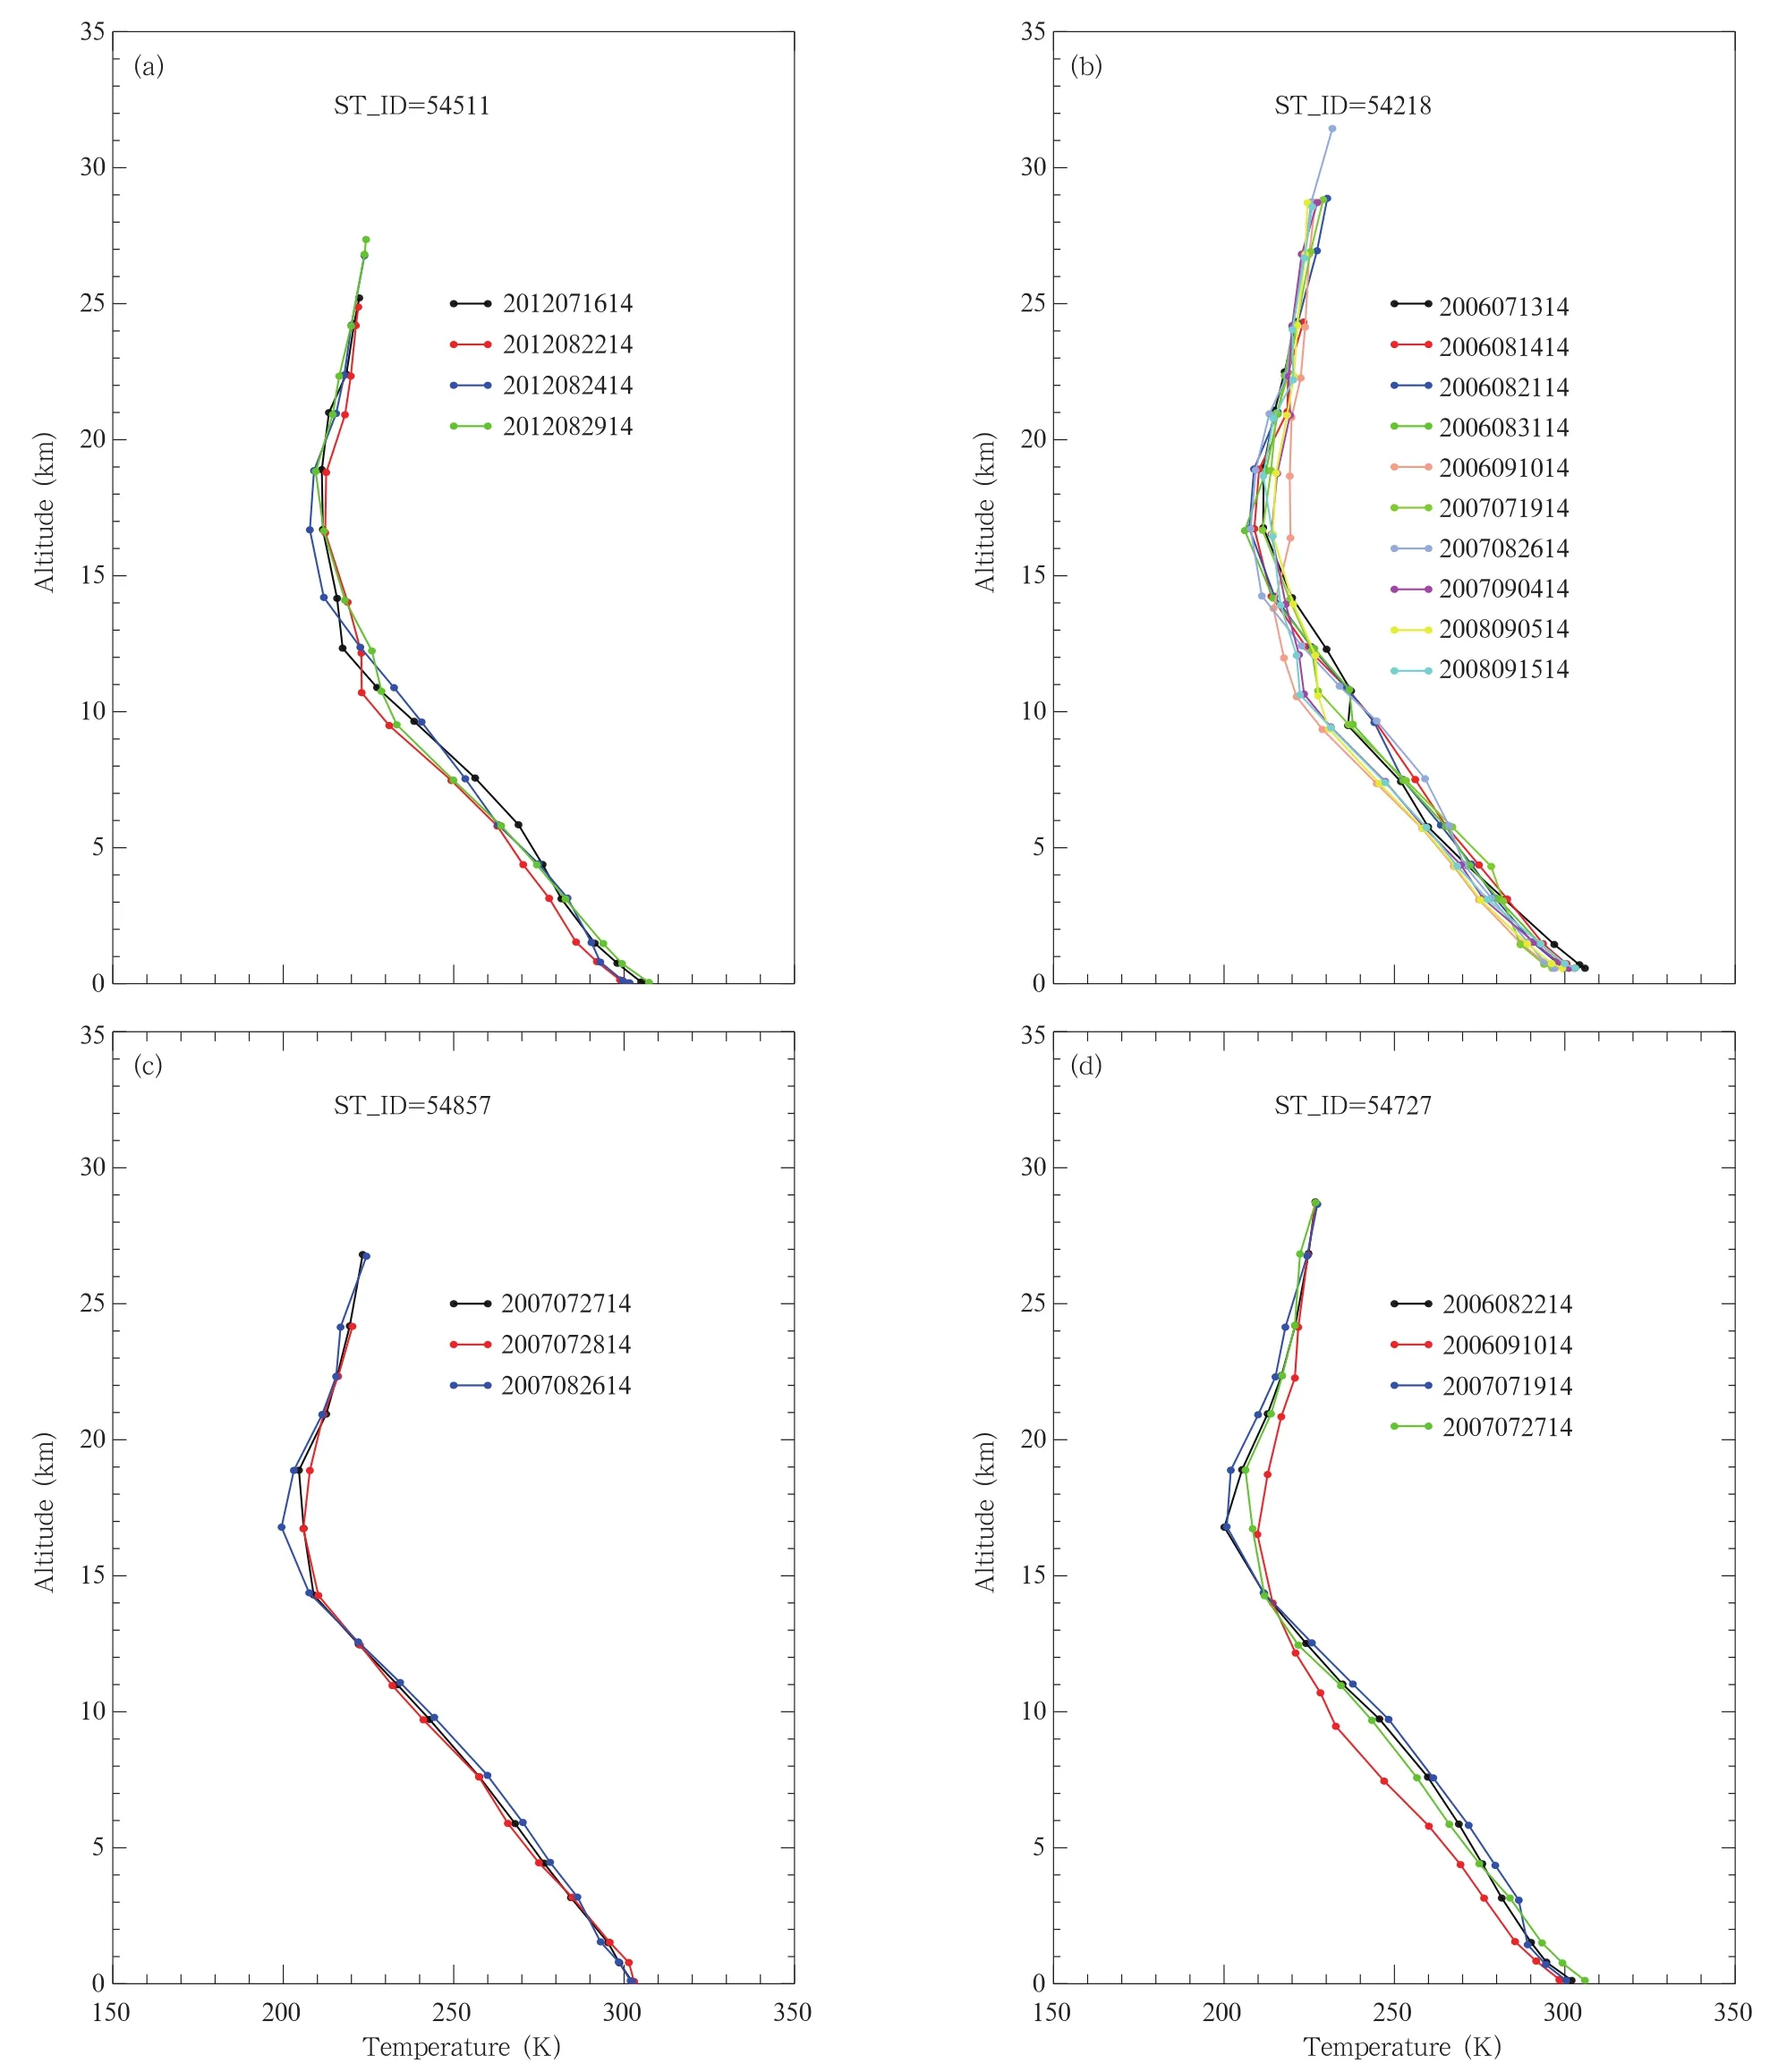
Fig.7.Atmospheric temperature profiles used in the R-based validation.(a)Beijing,(b)Chifeng,(c)Qingdao,and(d)Zhangqiu.ST-ID is the station ID,and the observing times for these profiles are also denoted,e.g.,2007072714 is 1400 BT 27 July 2007.
Figure 7 shows all atmospheric profiles that were obtained in the summer from 2006 to 2012.The maximum sounding altitudes in these cases are below 30 km except the one observed at Chifeng on 26 August 2007(Fig.7b),which was 31.4 km.Additionally,there were no clouds or temperature inversions occurring in these cases.

Table 2.Results of the R-based LST validations
3.3 Estimation of surface emissivity
Surface emissivity is another important input to the MODTRAN model.In this paper,the LSEs at the radiosonde stations are estimated by using the NBEM method with the NDVI values.For details,refer to Section 4.1 in Quan et al.(2012).
3.4 Results
The overall results of the R-based validation are listed in Table 2.It can be seen that the satellite overpassing times in all cases are close to the radiosonde time(1400 BT).The WV values range from 7.1 to 44.7 mm,i.e.,the atmosphere is relatively moist.Additionally,the atmospheric transmittance,which ranges from 0.486 to 0.928,generally decreases with the increase of WV.The brightness temperature in channel 4 of AVHRR at the validation sites is extracted from the AVHRR channel 4 images.The LSE in channel 4 of AVHRR,which is estimated from the NDVI value by using the NBEM method,is also listed.
Table 2 indicates that the retrieved LSTs from the AVHRR data by using the modified Becker's splitwindow approach are generally less than the inverted LSTs,especially in cases when the WV is greater than 15 mm.To further understand the water vapor impact on the retrieved LST,the average ΔT is calculated forhigh and low WV values.The result shows that the average ΔT is-1.3 K when the WV is less than 20 mm and up to-2.5 K when the WV is greater than 20 mm. Besides the WV,the LSEs and the view angles also influence the accuracy of retrieved LST.Therefore,the atmosphere-independent coefficients in the modified Becker's split-window algorithm are only suitable for the scenarios in which the atmosphere is not too wet(WV<20 mm).To make the split-window algorithm applicable to more general atmospheric conditions,the regression coefficients in the modified Becker's algorithm need to be considered as functions of WV,view zenith angle,etc.
4.Conclusions and discussion
Validation of the LST retrieved from the satellite observations is an important step towards improving the accuracy of the retrieval algorithm and implemeting better use of the LST product.However,it is a hard task due to many variables such as the true surface temperature,the accurate pixel matching,and the suitable atmospheric profiles.In this paper,we take advantage of two different methods,i.e.,the crossvalidation method and the R-based validation method,to verify the LST product retrieved from long-term AVHRR data by using the modified Becker's splitwindow algorithm(Quan et al.,2012).
The cross-validations are carried out via comparison between 3481 LST validation pairs. Using data from 548 weather stations in China from 2002 to 2008,these LST validation pairs are extracted from the AVHRR LST and the corresponding MYD11A1 products. The results show that there is a strong linear relationship between the AVHRR LST and the MYD11A1,with a bias of 0.03 K and a RMSD of 3.0 K.The cross-validation method takes advantage of the QC bit flag in the MYD11A1 to choose the high quality MYD11A1 LST as a reference.However,the MYD11A1 product is also retrieved surface temperature rather than a true value of the LST.Thus,this comparison can only be used to indicate the similarity between the AVHRR LST product and the reference MODIS LST product.
On the other hand,the R-based LST validation method does not need in-situ LST measurements,so it is suitable for the validation of both daytime and nighttime LSTs. To apply the R-based validation approach,accurate atmospheric temperature and water vapor profiles around the satellite overpass time are needed as input parameters into the MODTRAN model in order to simulate the satellite sensor's measurements. Fortunately,a few Chinese radiosonde stations provided additional observations at 1400 BT during summer,which made the accurate atmospheric profiles around the satellite overpass time available. In this paper,21 accurate atmospheric temperature and humidity profiles at 4 radiosonde stations are used along with the estimated LSE as the input parameters into the MODTRAN 4.1 model to fulfill the R-based validation.The result shows that the AVHRR LST retrieved from the modified Becker's split-window approach underestimates the LST in most of the cases and with an average LST difference of-1.3 K when the WV is less than 20 mm,and-2.5 K when the WV is larger than 20 mm.
In the future,considerable work needs to be conducted to improve the accuracy and consistency of the LST retrieval algorithm.For example,a split-window LST retrieval algorithm can be developed to derive the LST from long time series AVHRR data,taking into consideration the view zenith angle,LSE,WV,etc. Of course,the LST validation method and validation scheme are still necessary to guarantee that the LST retrieval algorithm is reliable.
Acknowledgments.We would like to thank the anonymous reviewers and editors for their valuable and stimulating comments that have greatly improved the paper.We also appreciate the Jet Propulsion Laboratory,California Institute of Technology of USA for providing the ASTER spectral library,which contains the John Hopkins University spectral emissivity data used in this paper.We are also very grateful to Mrs. Hu Tianjie and Mr.Ma Jingjin from the Beijing Meteorological Bureau for providing the radiosonde data.
Becker,F.,1987:The impact of spectral emissivity on the measurement of land surface temperature froma satellite.Int.J.Remote Sens.,8,1509-1522.
Becker,F.,and Li Zhaoliang,1990:Towards a local split window method over land surfaces.Int.J.Remote Sens.,11,369-393.
Berk,A.,G.P.Anderson,P.K.Acharya,et al.,2003:MODTRAN4 Version 3 Revision 1 User's Manual,Air Force Research Laborary,North Andover,MA,USA,10-35.
Coll,C.,V.Caselles,J.A.Sobrino,et al.,1994:On the atmospheric dependence of the split-window equation for land surface temperature.Int.J.Remote Sens.,15,105-122.
Coll,C.,V.Caselles,J.M.Galve,et al.,2005:Ground measurements for the validation of land surface temperatures derived from AATSR and MODIS data. Remote Sens.Environ.,97,288-300.
Coll,C.,E.Valor,J.M.Galve,et al.,2012:Long-term accuracy assessment of land surface temperatures derived from the Advanced Along-Track Scanning Radiometer.Remote Sens.Environ.,116,211-225.
Czajkowski,K.P.,S.N.Goward,and H.Ouaidrari,1998:Impact of AVHRR filter functions on surface temperature estimation from the split window approach. Int.J.Remote Sens.,19,2007-2012.
Diak,G.R.,and M.S.Whipple,1993:Improvements to models and methods for evaluating the land-surface energy balance and‘effective'roughness using radiosonde reports and satellite-measured‘skin'temperature data.Agric.Forest Meteor.,63,189-218.
Duan,S.B.,Z.L.Li,B.H.Tang,et al.,2014:Generation of a time-consistent land surface temperature product from MODIS data.Remote Sens.Environ.,140,339-349.
Frey,C.M.,C.Kuenzer,and S.Dech,2012:Quantitative comparison of the operational NOAA-AVHRR LST product of DLR and the MODIS LST product V005. Int.J.Remote Sens.,33,7165-7183.
Jim´enez-Mu˜noz,J.C.,and J.A.Sobrino,2003:A generalized single-channel method for retrieving land surface temperature from remote sensing data.J. Geophys.Res.,108,doi:10.1029/2003JD003480.
Jim´enez-Mu˜noz,J.C.,and J.A.Sobrino,2006:Error sources on the land surface temperature retrieved from thermal infrared single channel remote sensing data.Int.J.Remote Sens.,27,999-1014.
Jim´enez-Mu˜noz,J.C.,J.Cristobal,J.A.Sobrino,et al.,2009:Revision of the single-channel algorithm for land surface temperature retrieval from Landsat thermal-infrared data.IEEE Trans.Geosci.Remote Sens.,47,339-349.
Karnieli,A.,N.Agam,R.T.Pinker,et al.,2010:Use of NDVI and land surface temperature for drought assessment:Merits and limitations.J.Climate,23,618-633.
Kustas,W.,and M.Anderson,2009:Advances in thermal infrared remote sensing for land surface modeling. Agric.Forest Meteor.,149,2071-2081.
Li Zhaoliang,M.P.Stoll,Zhang Renhua,et al.,2001:On the separate retrieval of soil and vegetation temperatures from ATSR data.Sci.China(Ser.D),44,97-111.
Z.H.Li,B.H.Tang,H.Wu,et al.,2013a:Satellitederived land surface temperature:Current status and perspectives.Remote Sens.Environ.,131,14-37.
Li,Z.L.,H.Wu,N.Wang,et al.,2013b:Land surface emissivity retrieval from satellite data.Int.J.Remote Sens.,34,3084-3127.
Liu Yuanbo,T.Hiyama,Y.Yamaguchi,2006:Scaling of land surface temperature using satellite data:A case examination on ASTER and MODIS products over a heterogeneous terrain area. Remote Sens. Environ.,105,115-128.
Liu Yonghong,Niu Zheng,Xu Yongming,et al.,2006:Design of land cover classification system for China and its application research based on MODIS data. Trans.CSAE,22,99-104.(in Chinese)
Neteler,M.,2010:Estimating daily land surface temperatures in mountainous environments by reconstructed MODIS LST data.Remote Sens.,2,333-351.
Ottl´e,C.,and D.Vidal-Madjar,1992:Estimation of land surface temperature with NOAA9 data.Remote Sens.Environ.,40,27-41.
Pinker,R.T.,D.L.Sun,M.P.Hung,et al.,2009:Evaluation of satellite estimates of land surface temperature from GOES over the United States.J.Appl. Meteor.Climatol.,48,167-180.
Prata,A.J.,1993:Land surface temperatures derived from the advanced very high resolution radiometer and the along-track scanning radiometer.1:Theory. J.Geophys.Res.,98,16689-16702.
Prata,A.J.,1994:Land surface temperature determination from satellites.Adv.Spac.Res.,14,15-26.
Price,J.C.,1982:On the use of satellite data to infer surface fluxes at meteorological scales.J.Appl.Meteor.,21,1111-1122.
Qian,Y.G.,Z.L.Li,and F.Nerry,2013:Evaluation of land surface temperature and emissivities retrieved from MSG/SEVIRI data with MODISland surfacetemperatureand emissivity products.Int.J.Remote Sens.,34,3140-3152,doi:10.1080/01431161.2012.716538.
Qin,Z.,A.Karnieli,and P.Berliner,2001:A monowindow algorithm for retrieving land surface temperature from Landsat TM data and its application to the Israel-Egypt border region.Int.J.Remote Sens.,22,3719-3746.
Quan Weijun,Chen Hongbin,Han Xiuzhen,et al.,2012:A modified Becker's split-window approach for retrieving land surface temperature from AVHRR and VIRR.Acta Meteor.Sinica,26,229-240,doi:10.1007/s13351-012-0208-y.
Robel,J.,2007:AVHRR Level 1b data base.NOAA polar orbiter data user's guide,U.S.Department of Commerce,Asheville,USA,22-28.
Robel,J.,2009:Calibration of NOAA KLM instruments.NOAA KLM user's guide with NOAA-N,-N'Supplement,National Oceanic and Atmospheric Administration,Asheville,USA,1-11.
Snyder,W.C.,Z.Wan,Y.Zhang,et al.,1998:Classification-based emissivity for land surface temperature measurement from space.Int.J.Remote Sens.,19,2753-2774.
Sobrino,J.A.,Z.L.Li,M.P.Stoll,et al.,1994:Improvements in the split-window technique for land surface temperature determination.IEEE Trans.Geosci. Remote Sens.,32,243-253.
Sobrino,J.A.,Z.L.Li,M.P.Stoll,et al.,1996:Multichannel and multi-angle algorithms for estimating sea and land surface temperature with ATSR data. Int.J.Remote Sens.,17,2089-2114.
Sobrino,J.A.,and N.Raissouni,2000:Toward remote sensing methods for land cover dynamic monitoring:Application to Morocco.Int.J.Remote Sens.,21,353-366.
Sobrino,J.A.,J.A.Jim´enez-Mu˜noz,C.S`oria,et al.,2008:Land surface emissivity retrieval from different VNIR and TIR sensors.IEEE Trans.Geosci. Remote Sens.,46,316-327.
Tang Bohui,Bi Yuyun,Li Zhaoliang,et al.,2008:Generalized split-window algorithm for estimate of land surface temperature from Chinese geostationary FengYun meteorologicalsatellite(FY-2C)data. Sensors,8,933-951.
Valor,E.,and V.Caselles,1996:Mapping land surface emissivity from NDVI:Application to European,African and South American areas.Remote Sens. Environ.,57,167-184.
Van De Griend,A.A.,and M.Owe,1993:On the relationship between thermal emissivity and the normalized difference vegetation index for natural surfaces. Int.J.Remote Sens.,14,1119-1131.
Wan,Z.M.and J.Dozier,1996:A generalized splitwindow algorithm for retrieving land-surface temperature from space.IEEE Trans.Geosci.Remote Sens.,34,892-905.
Wan,Z.M.,Y.L.Zhang,Q.C.Zhang,et al.,2002:Validation of the land-surface temperature products retrieved from Terra Moderate Resolution Imaging Spectroradiometer data.Remote Sens.Environ.,83,163-180.
Wan,Z.M.,P.Wang,and X.Li,2004:Using MODIS land surface temperature and normalized difference vegetation index products for monitoring drought in the southern Great Plains,USA.Int.J.Remote Sens.,25,61-72.
Wan,Z.M.,and Z.L.Li,2008:Radiance-based validation of the V5 MODIS land-surface temperature product.Int.J.Remote Sens.,29,5373-5395.
Wang,K.C.,P.C.Wang,Z.Q.Li,et al.,2007:A simple method to estimate actual evapotranspiration from a combination of net radiation,vegetation index,and temperature.J.Geophys.Res.,112,D15107,doi:10.1029/2006JD008351.
Wang Minyan and L¨u Daren,2006:Diurnal and seasonal variation of clear-sky land surface temperature of several representative land surface types in China retrieved by GMS-5.Acta Meteor.Sinica.,20,475-488.
Weng Qihao,2009:Thermal infrared remote sensing for urban climate and environmental studies:Methods,applications,and trends.ISPRS J.Photogramm. Remote Sens.,64,335-344.
Weng,Q.H.,D.S.Lu,and J.Schubring,2004:Estimation of land surface temperature-vegetation abundance relationship for urban heat island studies. Remote Sens.Environ.,89,467-483.
Yang Jingmei and Qiu Jinhuan,2002:A method for estimating precipitable water and effective water vapor content from ground humidity parameters.Chinese J.Atmos.Sci.,26,9-22.(in Chinese)
Zhu Xiaochen,Qiu Xinfa,Zeng Yan,et al.,2015:A remote sensing model to estimate sunshine duration in the Ningxia Hui autonomous region,China.J. Meteor.Res.,29,144-154,doi:10.1007/s13351-015-4059-1.
Quan Weijun,Chen Hongbin,Han Xiuzhen,et al.,2015:Validation of the modified Becker's splitwindow approach for retrieving land surface temperature from AVHRR.J.Meteor.Res.,29(5),823-836,
10.1007/s13351-015-4110-2.
(Received November 6,2014;in final form July 18,2015)
In the cross-validation,3481 LST data pairs are extracted from the AVHRR LST product retrieved with the modified Becker's approach and compared with the Moderate Resolution Imaging Spectroradiometer(MODIS)LST product(MYD11A1)for the period 2002-2008,relative to the positions of 548 weather stations in China.The results show that in most cases,the AVHRR LST values are higher than the MYD11A1. When the AVHRR LSTs are adjusted with a linear regression,the values are close to the MYD11A1,showing a good linear relationship between the two datasets(R2=0.91).
In the R-based validation,comparison is made between AVHRR LST retrieved from the modified Becker's approach and the inversed LST from the Moderate Resolution Transmittance Model(MODTRAN)consolidated with observed temperature and humidity profiles at four radiosonde stations.The results show that the retrieved AVHRR LST deviates from the MODTRAN inversed LST by-1.3(-2.5)K when the total water vapor amount is less(larger)than 20 mm.This provides useful hints for further improvement of the LST retrieval algorithms'accuracy and consistency.
猜你喜欢
中国图书评论(2022年12期)2022-12-26 09:32:46
关东学刊(2022年5期)2022-10-21 02:28:42
小学生学习指导(中年级)(2021年11期)2021-11-30 02:17:50
延河(下半月)(2021年7期)2021-08-10 02:40:16
江苏安全生产(2020年3期)2020-04-21 05:44:12
海峡姐妹(2019年4期)2019-06-18 10:39:00
宝藏(2018年12期)2019-01-29 01:50:50
Acta Mathematica Scientia(English Series)(2018年3期)2018-07-23 08:41:42
Journal of Meteorological Research(2015年5期)2015-11-21 11:23:19
中华奇石(2014年12期)2014-07-09 18:30:22
 Journal of Meteorological Research2015年5期
- Journal of Meteorological Research的其它文章
- Characterization of Drought and Its Assessment over Sindh,Pakistan During 1951-2010
- Modification of Cumulus Convection and Planetary Boundary Layer Schemes in the GRAPES Global Model
- Dust Aerosol Effects on Cirrus and Altocumulus Clouds in Northwest China
- Cloud Radiative Forcing Induced by Layered Clouds and Associated Impact on the Atmospheric Heating Rate
- A New Evaporation Duct Climatology over the South China Sea
- Characteristics and Mechanisms of the Sudden Warming Events in the Nocturnal Atmospheric Boundary Layer:A Case Study Using WRF