
A Geospatial approach to determine Lake Depth and Configuration of Reingkhyongkine (Pukur Para) Lake, Rangamati Hill District, Bangladesh with Multi-Temporal Satellite data
2015-11-01 01:27:33BiswajitNathShuklaAcharjeeAtinKumarMitraDebabrataMajumderBeniaminoMurgante
Biswajit Nath, Shukla Acharjee, Atin Kumar Mitra, Debabrata Majumder, Beniamino Murgante
1Department of Geography and Environmental Studies, Faculty of Biological Sciences, University of Chittagong, Chittagong-4331, Bangladesh
2Department of Applied Geology, Dibrugarh University, Dibrugarh-786004, Assam, India
3Department of Earth Sciences, Indian Institute of Engineering, Sciences and Technology, Shibpur, Howrah, West Bengal-711103, India.
4Samit Spectrum EIT Pvt. Ltd., Gurgaon, Haryana-122002, India.
5University of Basilicata, 10, Viale dell'Ateneo Lucano, 85100 - Potenza - Italy
A Geospatial approach to determine Lake Depth and Configuration of Reingkhyongkine (Pukur Para) Lake, Rangamati Hill District, Bangladesh with Multi-Temporal Satellite data
Biswa5jit Nath1,†, Shukla Acharjee2, Atin Kumar Mitra3, Debabrata Majumder4, Beniamino Murgante
1Department of Geography and Environmental Studies, Faculty of Biological Sciences, University of Chittagong, Chittagong-4331, Bangladesh
2Department of Applied Geology, Dibrugarh University, Dibrugarh-786004, Assam, India
3Department of Earth Sciences, Indian Institute of Engineering, Sciences and Technology, Shibpur, Howrah, West Bengal-711103, India.
4Samit Spectrum EIT Pvt. Ltd., Gurgaon, Haryana-122002, India.
5University of Basilicata, 10, Viale dell'Ateneo Lucano, 85100 - Potenza - Italy
Submission Info
Communicated by Antonino Marvuglia
Reingkhyongkine Lake
Bathymetry
Geospatial
Multi-Temporal
Techtonism
Bangladesh
Reingkhyongkine (Pukur Para) Lake is the largest hilly natural lake under Belaichhari Upazila in the Hill district of Rangamati, Bangladesh. Due to remoteness and rugged terrain this lake is never being investigated and not documented in the literature. This research is done following standard method and state-of-art-technology. As natural resource management foster sustainable development the present research is of immense importance. Global Positioning System (GPS) is used for water depth point positioning along with sounding techniques was used for water depth measurement. The highest and lowest depths are observed 145 m and 0.50 m respectively. The worldwide available Landsat 8 OLI/TIRS imagery of 13 May 2015 was considered as the base imagery to know the lake area at present context compare with other different years. The Lake depth and 3D configuration maps are developed based on field depth and derived contour data. In addition to this, surface elevation profile in different direction of lake and bathymetric mapping based on longitudinal and horizontal transect bottom topographic profile, lake surface area and water volume are also calculated to understand the real scenario of this largest lake. All these studies are integrated with local as well as the regional geological structures. The study using geo-integrated technology on Reingkhyongkine lake reveals that the changes of lake area which is 35.02 hectare (May 2015 Landsat 8 OLI Imagery), 40.65 hectare and 34.91 hectare (2010 and 1989 Landsat TM imagery) respectively which indicate an decreasing-increasing-decreasing trend scenario and changing at the rate of 0.11 percent per year and this changing phenomenon is related with the active tectonism of the area as the study area has sufferedextensive thrusting, faulting and folding. Besides this the surface elevation of lake is not similar and it varies from 353 meter to 409 meters. Results shows that changes in the configuration and reduction of water volume of Reingkhyongkine Lake establish fragile conditions which indicate of its future drying status and needs continuous monitoring of water depth by considering environmental factors which are involved for the lake changes and finally researcher seeks urgent attention to international scientific community for protection and conservation of this hilly natural lake.
© 2015 L&H Scientific Publishing, LLC. All rights reserved.
1. Introduction
Bangladesh is a land of beauty and it is blessed with boundless natural objects. Reingkhyongkine Lake (popularly known as Pukurpara Lake) is a hilly natural lake is located in the Rangamati Hill District, which is the extended part of Himalayan syntaxial bent started from Arunachal Pradesh, India. This lake is situated in the 9 No. Farua union under Belaichhari Upazila, Rangamati, Bangladesh1The geographical extent of the Lake in between 22º01'11” N to 22º01' 54”N latitude and 92º32'45” E to 92º33'15” E longitude. The total extent of the study area (Lake and its adjoining areas) in between 22º0'0” N to 22º3'0” N latitude and 92º31'25” E to 92º 34'25”E longitude.
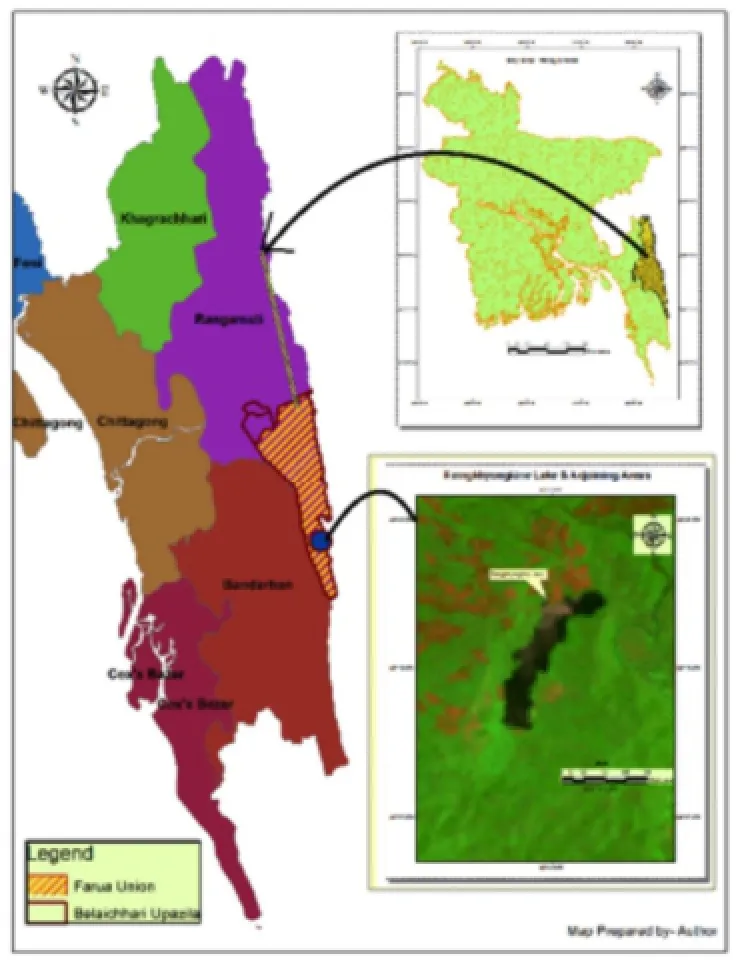
Fig.1. Location map of study area.
The lake is elongated in shape. It is bounded on all sides by mountain peaks covered with highly dense to moderate natural vegetation and thick bamboo bushes. It is a closed lake and just nearby in the north-eastern margin there is a high cascading waterfalls along with Jheeri falls into the Reingkhyongkine River or canal. Pukurpara waterfalls are the widest waterfall in Bangladesh. Both sides of the lake have two villages, called Tripura Village. The western and eastern side villages are named as Pukur Para and Pranjong Para respectively. Surrounded by massive mountain tops it is the largest natural lake of Bangladesh. There is an Army camp just beside the lake which is adjacent to Pukur Para village. This Belaichhari upazila is so backward that there is still no road available for communication.
The main source of water is the spring. However, there are also other sources such as rainfall, surface drainage and spring seepage. This lake has 2 inlets and 3 outlets with regular inflow of surface water into thelake (entering into the lower and middle section of lake) and outlet of water in three directions. The outlet part is located in the northern direction, south-eastern and southern direction (Fig. 2).
The water of the lake is moderately basic that's why large scale weeds and plants exist in all around of the lake. Tourists are attracted by the lakes to see its beauties but the lake holds a limited accessibility by transport means. According to geological literature rock formations in these areas are transacted by major strike-slip faults in the Himalaya-Tibet system (Mandal et al., 2009; Molnar et al., 1988) (Fig. 3) and the formation of strike-slip faults are associated with lateral extrusion tectonics in models (Avouac, 2007).
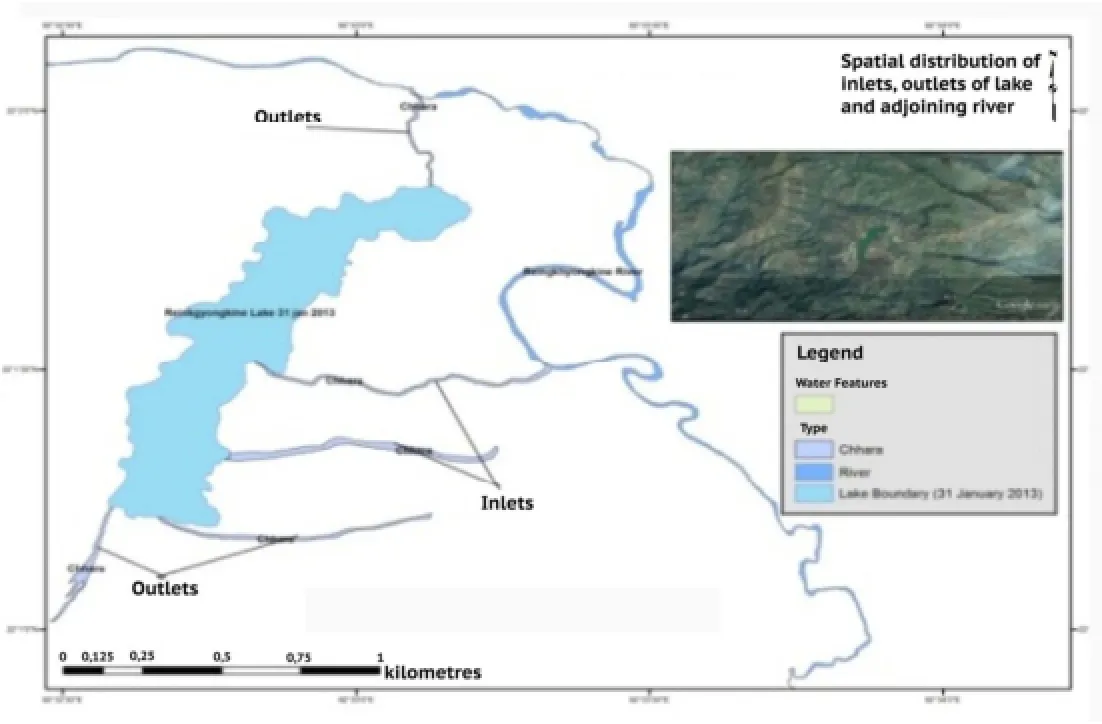
Fig.2. Spatial distribution of inlets, outlets of lake and adjoining river.

Fig.3. (a) Major strike-slip faults in the Himalaya-Tibet system (b) Formation of strike-slip faults associated with later extrusion tectonics in models. (c) A schematic sketch of strike-slip movement on the eastern flank of the Tibetan plateau (after Mandal et al., 2009).
The study area has suffered extensive thrusting, faulting and folding, with the help of thin skin tectonics different structures of the area are modelled (Jiménez-Munt and Platt, 2006).
The lithological components of the area clearly show that the area is a part of fore-arc basin. Naturally itwill be devoid of any considerable volcanism. Volcanic rocks are only located in the northwestern part of Bangladesh (Khan, 2000; Nath et al., 2012).
Due to remoteness and rugged terrain this lake is never being investigated and not documented in the literature, that's why the authors tried to explore this lake following standard methods and state-of-art technology. GIS can be considered to have three basic roles: as a data manipulator; as a data integrator; and as a data explorer. The role of GIS in more advanced forms of GIS-based spatial analysis that tend to involve data integration and data exploration (Fotheringham et al., 2000). One means of examining the spatial variation in the parameter estimates is to map them. For point data, one mapping technique is to interpolate a surface and then display the surface, either shaded as a grey scale in planimetric form, or in pseudo-3D from a variety of viewing positions.
Three-dimensional modelling is one of the most exciting developments in GIS technology as it allows the full specification of three-dimensional operations on the objects and phenomena within the constraints of the geometrical model used (Lo et al., 2002). It is conceptually complex and computationally intensive.
Geovisualization, the development of techniques and technologies that facilitate the visual exploration, analysis, synthesis, and presentation of geospatial data, is an emerging area of GIS research. For most geovisulalizations polygons need to be generalized before being transformed into 3D objects. (Heywood et al, 2010).
As natural resource management foster sustainable development the present research is of immense importance. The authors claim that present research work is the pioneer works in the history of Reingkhyongkine Lake.
2. Objectives
The purpose of the research work is to study and analyze the depth data and Lake Configuration of Reingkhyongkine Lake and to integrate the results with the available geological information, especially the cause of change of lake area.
However, the detail Objectives of this study include:
· Identification of Reingkhyongkine Lake and area delineation from different satellite imageries
· To develop DEM on the basis of NASA-SRTM 90 m resolution DEM data of the lake and its adjoining areas using ERDAS Imagine software
· To measure water depth of Reingkhyongkine Lake using sounding method with GPS survey
· To produce a contour map of Lake on the basis of water depth point data and calculate water volume from surface to bottom considering its varied depth
· To know the lake surface elevation along with its profile using Google Earth, lake bottom topography based on transect profile (horizontal and vertical) drawing in different direction of the lake, Its Three Dimensional (3D) Configuration and
· To perform change detection in the lake configuration using multi-temporal satellite data with the help of ArcGIS software.
3. Database and Methodology
Landsat satellite images are taken as the secondary data source for this study due to its good spectral characteristics, historical archive and for its complete cloud free nature. The orthorectified imageries are downloaded from GLCF website of University of Maryland. In order to determine the lake configuration, Shuttle Radar Topographic Mission (SRTM) DEM (90 m resolution), Geo-Tiff NASA-GLCF Landsat TM satellite imagery(1989, 2001, 2003, 2009 and 2010) of 30 meter resolution, Google earth imagery of January, 2013 (based on 1 km Eye Altitude) and USGS freely available Landsat 8 OLI/TIRS satellite data (13 May 2015) of 30 meter resolution were considered (Fig. 4). The characteristics of satellite image data are shown in Table-1.
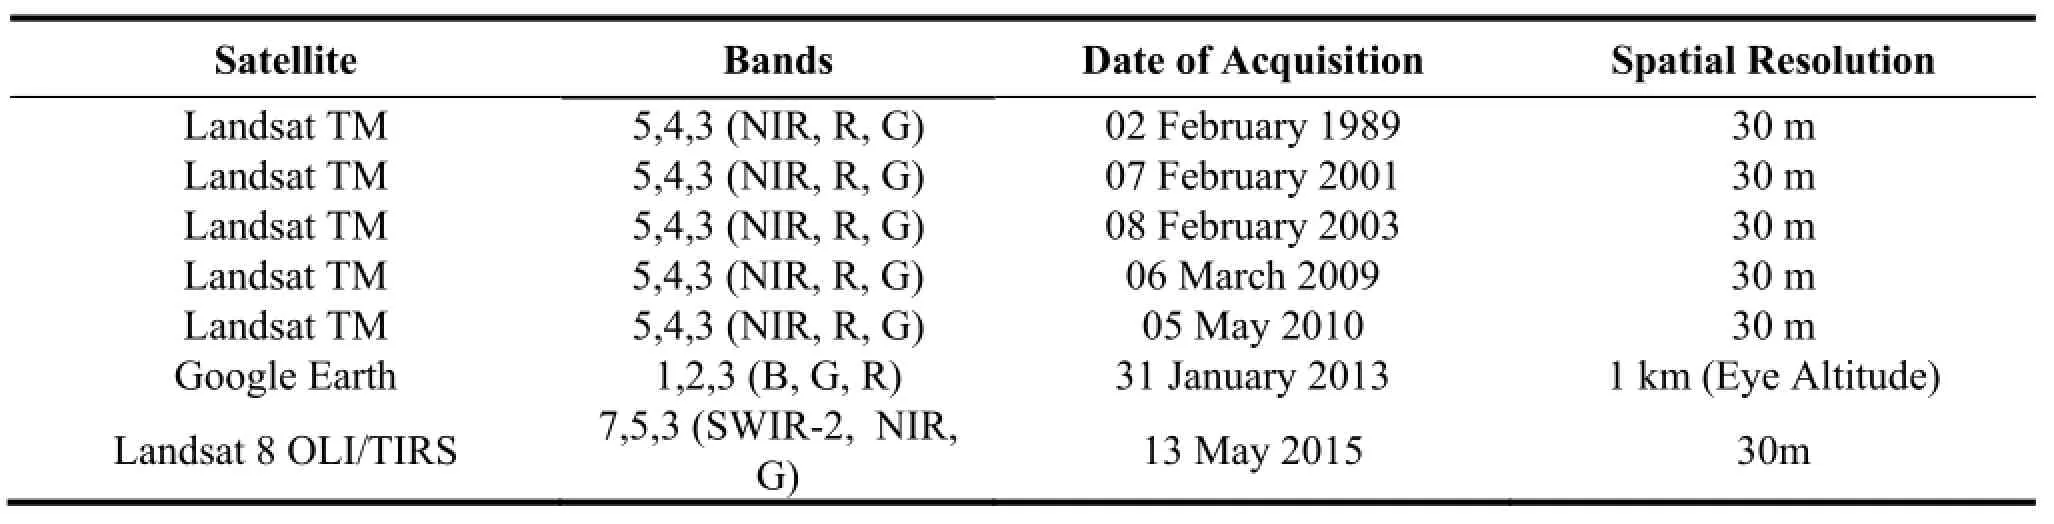
Table 1 Data characteristics of satellite imageries (Source: NASA-GLCF, Google Earth 7.0, USGS archive)
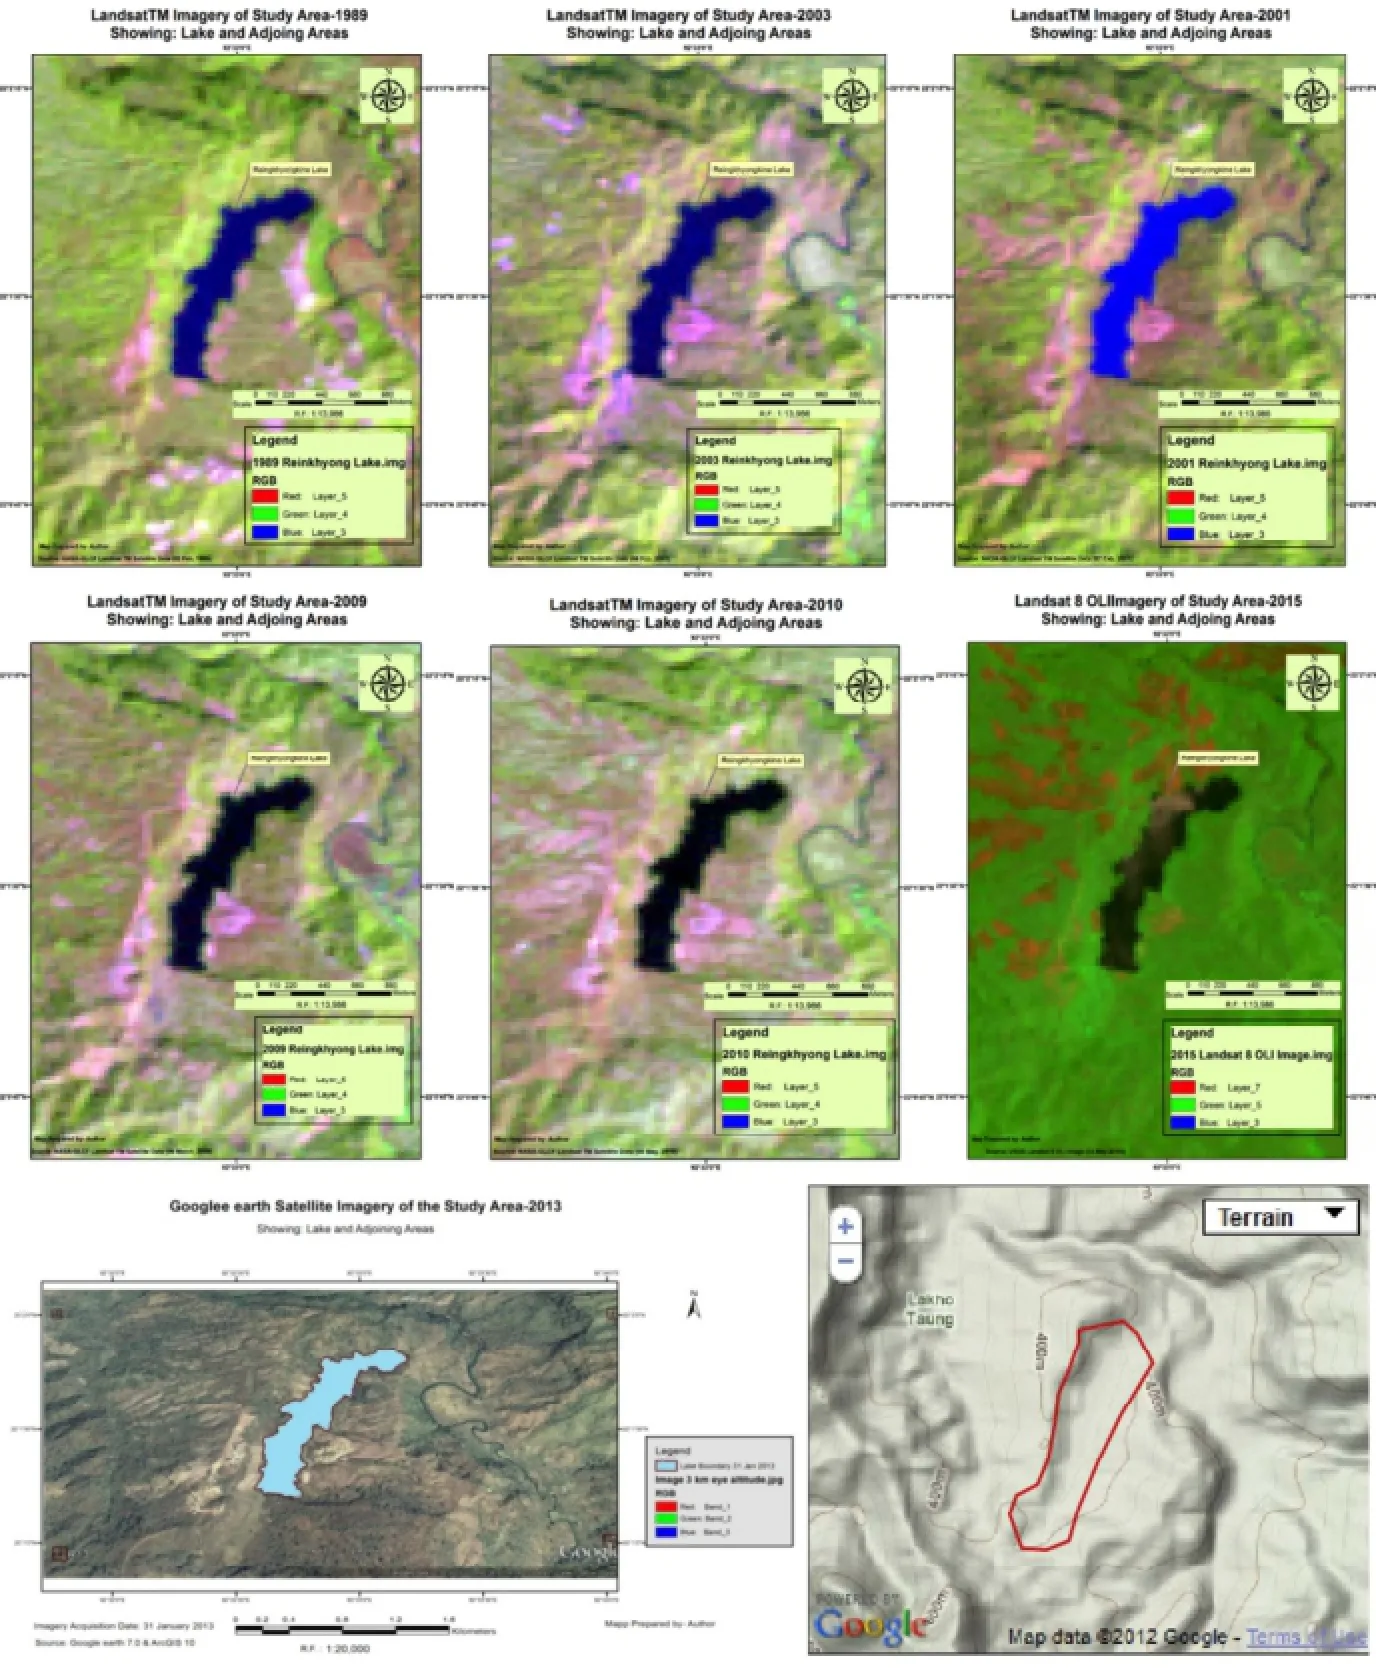
Fig. 4 Landsat TM imageries of 1989, 2001, 2003, 2009 and 2010 (band combination used: 5,4,3), Google earth satellite image of January 2013 (band combination used: 1,2,3), Landsat 8 OLI/TIRS image of 2015 (band combination used: 7, 5, 3) and terrain map of map data-2012:Google map where red bounding box is the lake area
During field survey (23-25 November, 2012) water depth data was collected by boating and applying sounding techniques along with hand-held Garmin GPS device e-Trex. The data was finally used for waterdepth point positioning on Google earth Satellite Image-January 2013.
Kriging is a geostatistical tool and supposed to be always better where the data is not regularly sampled. Minimum-Curvature algorithm is particularly good for surface elevations and reservoir thickness (Falivene et al., 2009). The method to use will depend on the data set, the desired result and personal preference. In some cases the choice of algorithm is purely subjective and has little bearing on the accuracy of the computed surface. It gives a better result with respect to most of the known algorithm. Present distribution of depth data is fair enough to prepare a good map by minimum curvature algorithm and uncertainty will always be there where there is no data.
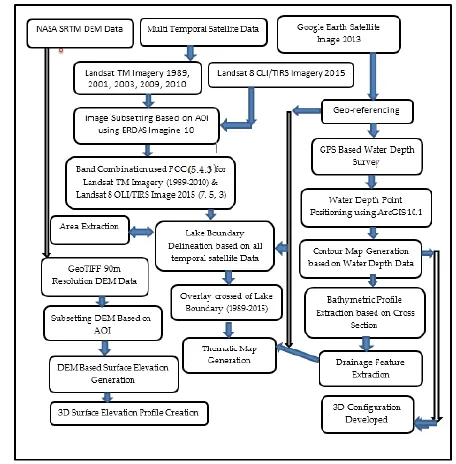
Fig. 5 Flow chart model.
A contour map was generated based on minimum-curvature algorithm by using water depth data.
A longitudinal and horizontal transect profile was drawn to get the bathymetric profile of this lake and water volume was also calculated using this varied depth data (surface to bottom). To know the present status of the lake, its recent boundary delineation and surface elevation profile was extracted (considering longitudinal and horizontal transects) using 31 January 2013 satellite imagery.
Satellite data processing and digital image processing software (ERDAS Imagine 10) and vector data manipulation software ArcGIS 10.1 were used for the processing, analysis and integration of spatial data to reach the objectives of the study. Then the images were layer stacked, mosaicked and a subset was taken using a geo-referenced shapefile of the selected area of interest (AOI) of lake and its adjoining areas.
Besides this SRTM 90m resolution DEM data was used to know the elevation status of lake and its adjoining areas and using elevation data 3D surface elevation was generated using ERDAS Imagine 10.
An overview of the inter-linked methods used in the study is presented in the above flow chart model (Fig 5).
4. Results and discussion
Map products derived from remote sensing are usually critical components of a GIS. Remote sensing image is an important technique to study both spatial and temporal phenomena.
The integration of the two technologies creates a synergy in which the GIS improves the ability to extract information from remotely sensed data and Remote sensing in turn keeps the GIS up-to-date with actual environmental information. Like in all models, however, both maps and thematic data are abstractions or simplifications of the real world.
The lake is assessed using geospatial techniques. The lake boundary map, water depth map and SRTM DEM data are used as spatial layers. The SRTM DEM is used for the elevation related analysis(http://srtm.csi.cgiar.org). The satellite imageries of the study area were downloaded from Google earth(http://www.earth.google.com) and were used to depict water depth sample collection sites.
Generally, water bodies tend to absorb most of the incident infrared radio magnetic tradition and a slightly higher reflectance of the visible wavelengths (0.4-0.8 micrometer), on the contrary of surrounding features such as land and/or vegetation. Therefore, water bodies standout in contrast to the surrounding soil and vegetation. Hence, remote sensing can be very efficient in monitoring and assess the ongoing dynamic changes of Reingkhyongkine Lake.
4.1 Developing Digital Elevation Model (DEM) of Lake and Adjoining Areas Based on NASA SRTM DEM Data
DEM can be defined as any digital representation of variation in relief over space (Burrrough and Mc Donnell, 1998). 3D Surface profile generation of selected AOI (Lake and near adjacent area) is based on NASASRTM DEM data (90 m Resloution) using ERDAS Imagine-2010 software (Fig. 6).
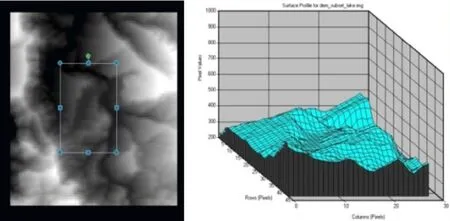
Fig.6 3D surface profile generation of selected AOI (Lake and near adjacent area) based on NASA-SRTM DEM data (90m resolution) Using ERDAS Imagine-2010.
The analysis of DEM revealed that lake surface stands on different elevation levels, where lake surface elevation range falls within 352-424 meter from a.s.l. The surrrounding surface elevation of lake adjoining areas NNW range strat from 208-280 meter (lowest range of elevation identified) and small patches of range which falls in the most highest elevation category from 856-928 meter from a.s.l. Surrounding elevation range differ significantly from one elevation range to another range which start from 280-352 meter range to 712-784 meter from a.s.l. respectively (Fig. 7).
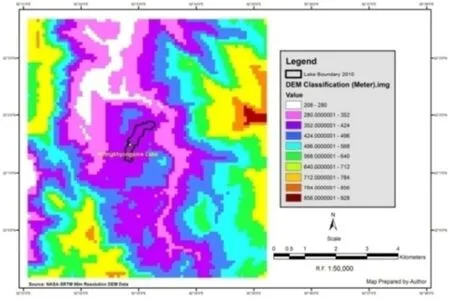
Fig.7 Digital Elevation Model (DEM) of the study area (lake) and its surrounds.
4.2 Measuring Water Depth of Reingkhyongkine Lake
During field survey, total 163 water depth sample points were measured for this lake. All these water depth point samples are plotted in the lake boundary of 31 January, 2013 imagery using ArcGIS 10.1 version software.
The data set is projected in standard UTM zone 46N coordinate projection system. Grid spacing of 2m × 2m using minimum curvature gridding algorithm which honours sparse spaced dataset giving minimum bending with smooth surface. Minimum-Curvature fits a minimum curvature spline through the data points either side of the input node. It preserves C2 continuity or in other words, rate of change of slope (Briggs, 1974). Surfaces may have large oscillations and extraneous inflection points (Smith and Wessel, 1990).
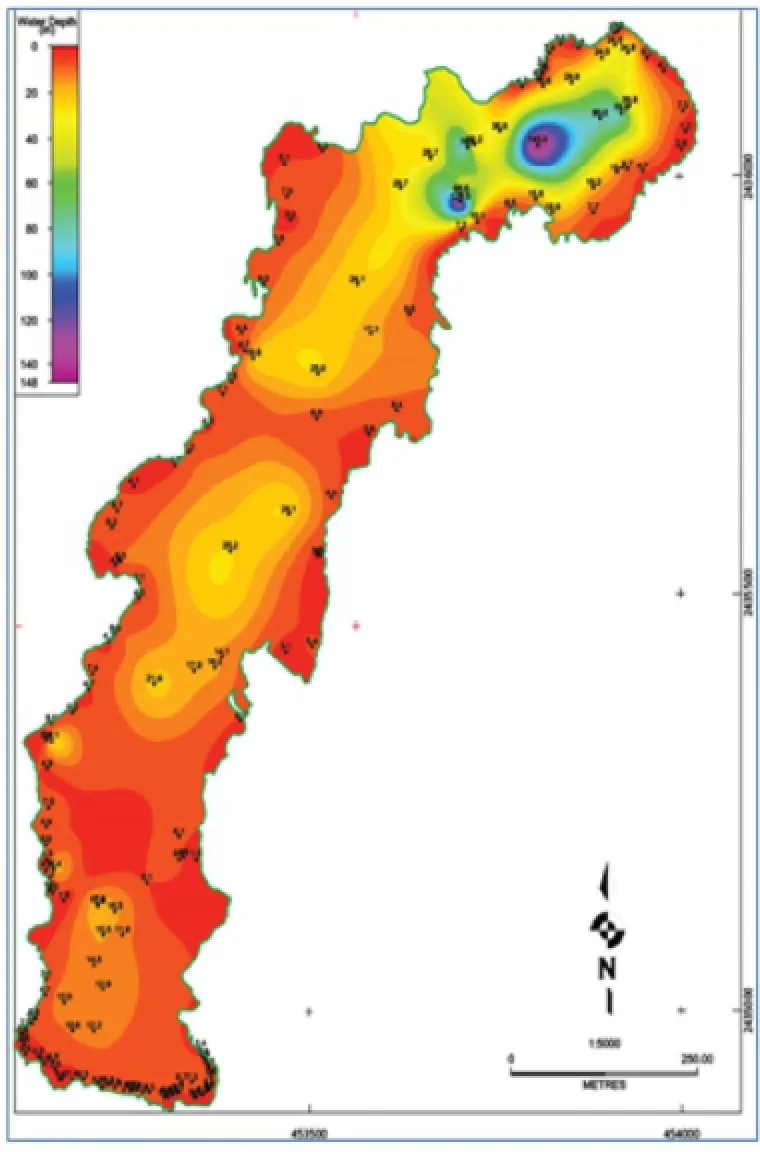
Fig. 8 Contour map generation (5 meter interval) based on water depth sample point data and Lake Bathymetry
The water depth ranges from 0 to 148 m, where the lowest value is recorded 0.50 m and highest value is 145 m and second highest value is 129.5 m.
Lake bathymetry map, which is referenced to lake water level at 0m, with contour spacing at every 5m interval, is shown in Fig. 8.
The color bar showing depth contour for water depth variation of Reingkhyongkine Lake at 5 meter interval. The color bar used in the bathymetry map prepared with shallow depth represented by red colour continuing though yellow, green, blue and the deepest resepresented by violet color.
To estimate the effect of water depth describing different sampling sites the relative depth (Dr) was found by applying following formula: Dr= √D×Dmax/Daverage×3, Where Dris the relative depth at the sampling site(m) and Daverageis the average depth of the lake (m). The quotient of the maximum depth to the average depth multiplied by 3 is according to Håkanson & Jansson (1983) the so-called form factor Vd-1.
At this highest point (145 m), the relative depth calculated using the above formula was 24.12 meter where the average depth of lake (Daverage) calculated by summation of all water depth points value was 12.04 m and Dmaxwas measured 145 meter respectively.
4.3 Water Volume Estimation
The volume calculations are based on the geometric grid based slicing method of volume estimation, which is the product of the grid base multiplied of the grid area by its depth thickness slice volume calculation. Grid geometry Rows-134 Cols- 99 Cell size X: 10.0 Cell size Y: 10.0, Cell refinement: 1, Effective X: 10.00 Y:10.00, -141.7 to 0.0 and user defined volume scale factor 1.000000 and for volume calculation the unit considered is in meter. By considering 1 meter grid slice interval from surface to bottom part maximum of 353100.0 square meter slice area has been identified based on 31 January 2013, whereas it was 40,6500.0 square meter slice area when 2010 Landsat TM image boundary was considered.

Table 2 Area Vs Water volume distribution of Reingkhyongkine Lake from 2010-2015.
The total water volume estimated of Reingkhyongkine lake is 5,759,963.05 cubic meter in 2013 but was 6,126,889.74 cubic meter in 2010. Based on the 2013 and 2010 water volume data (cubic meter), 2015 water volume is estimated by trend analysis considering corresponding lake area statistics in sq meter (Table 2).
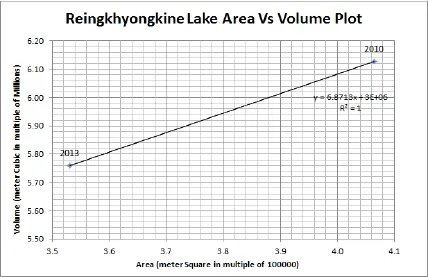
Fig. 9 Trend line of water volume distribution vs lake area
Table 2 shows that lake water volume is decreasing and it decreased 5.99% in volume. As current year 2015 is considered for only lake area determination and water volume is not measured, so the researcher tried to calculate and predict it.
By using 2010 and 2013 data, a regression curve is plotted to analyze the probable decrease in volume for the year 2015 and found a decrease of 6.15% from 2013. The accuracy shall increase with addition of more data. The volume is calculate using the regression equation of water volume (y) = 6.8713*x + 3E+06 which means (6.8713 * Area) + 3000000 and R2=1 (Fig. 9).
The predicted water volume calculated is 5405686.04 meter cubic and volume decrease as 6.15% which indicates a sharp decline in lake water; where, the total loss of water volume is recorded as 366926.69 cubic meters in between 2010 to 31 January 2013 and the reasons behind that, this lake has been affected by natural(i.e., basin fill up by sediments which came from erosional activities of the adjacent hills and finally deposited in the lake, Surface water runoff at regular interval through drain out points) and anthropogenic factors (i.e., Shifting Cultivation (jhum) near lake shore and adjoining hills, bush clearance, tree cutting etc.) (Table 2).
4.4 Lake Surface Elevation Profile Drawing (Horizontal And Vertical) With Slope Measurement
As we have seen that lake surface elevation point values varies over the lake therefore an attempt has been made to check the elevation profile diagram in different direction (horizontal and longitudinal) with transect drawing. With the recently added facility provided by Google Earth, surface elevation profile can be automatically created maintaing user defined drawing distance and slope could be also marked within this profile curve.
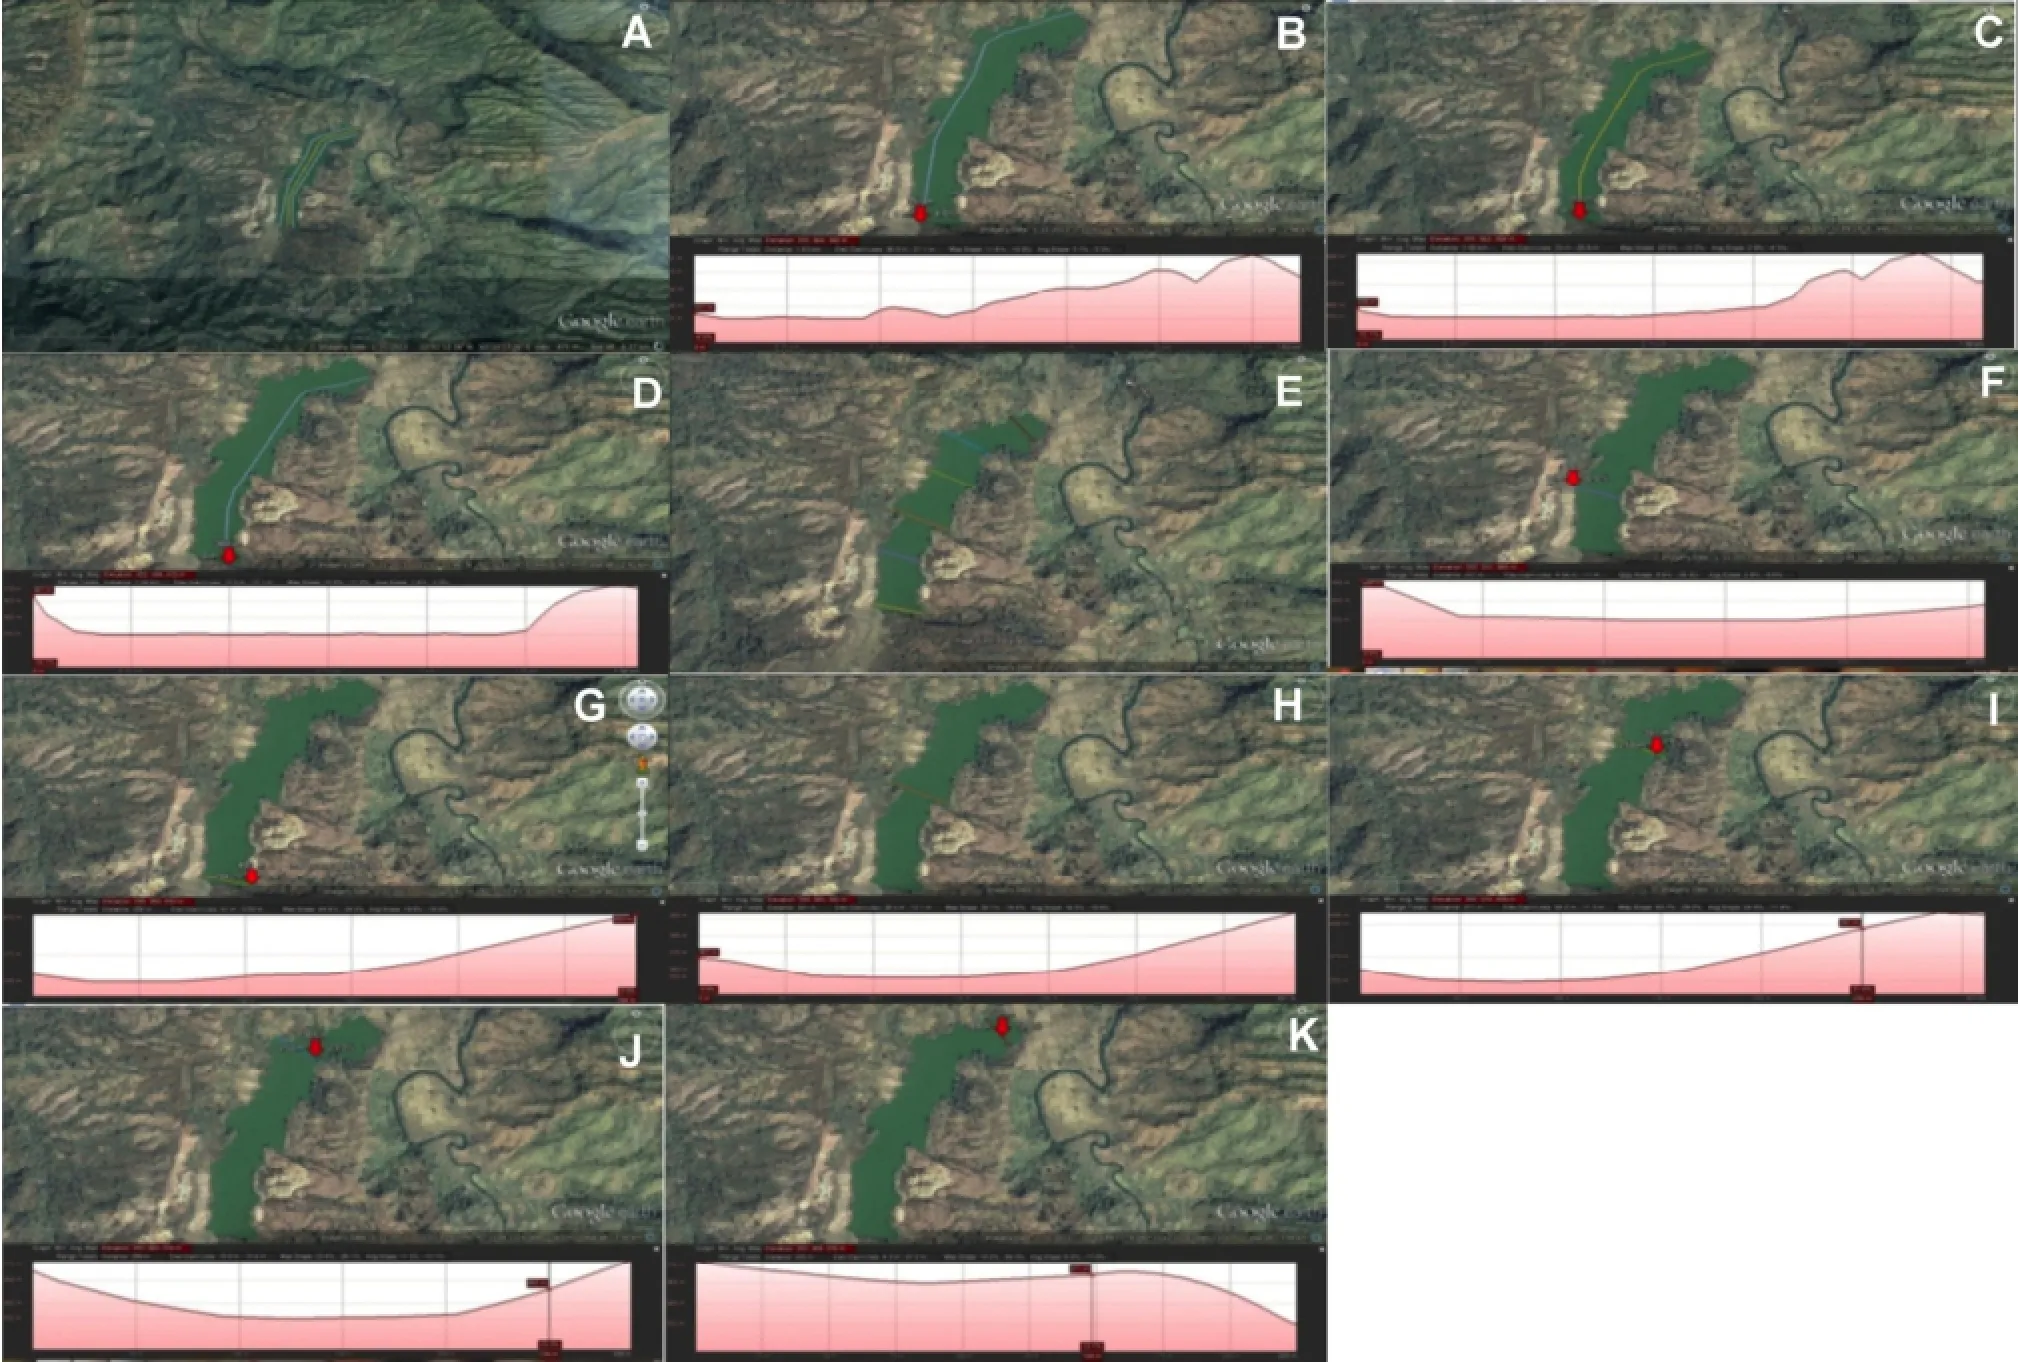
Fig. 10 (A-K) Automatic surface elevation profile drawing with slope measurement based on user defined transect drawing (horizontal and longitudinal) on Google earth satellite imagery (31 January 2013)
In Fig. 10, A and E shows the total 3 logitudinal sections and 6 Horizontal Sections respectively which are drawn on recent available image (2013) of Google earth. In Fig. 10, B is the first logitudinal (left side)elevation profile. In this section transect line drawing, the longitudinal distance is 1.63 km, maximum and minimum elevation is 382 m and 355 m respectively and maximum slope is 11.6% which indicate that this part falls under modeate slope area (based on standard slope percentage equation) and average slope is 3.7% which falls under flat terrain category (Table-3).
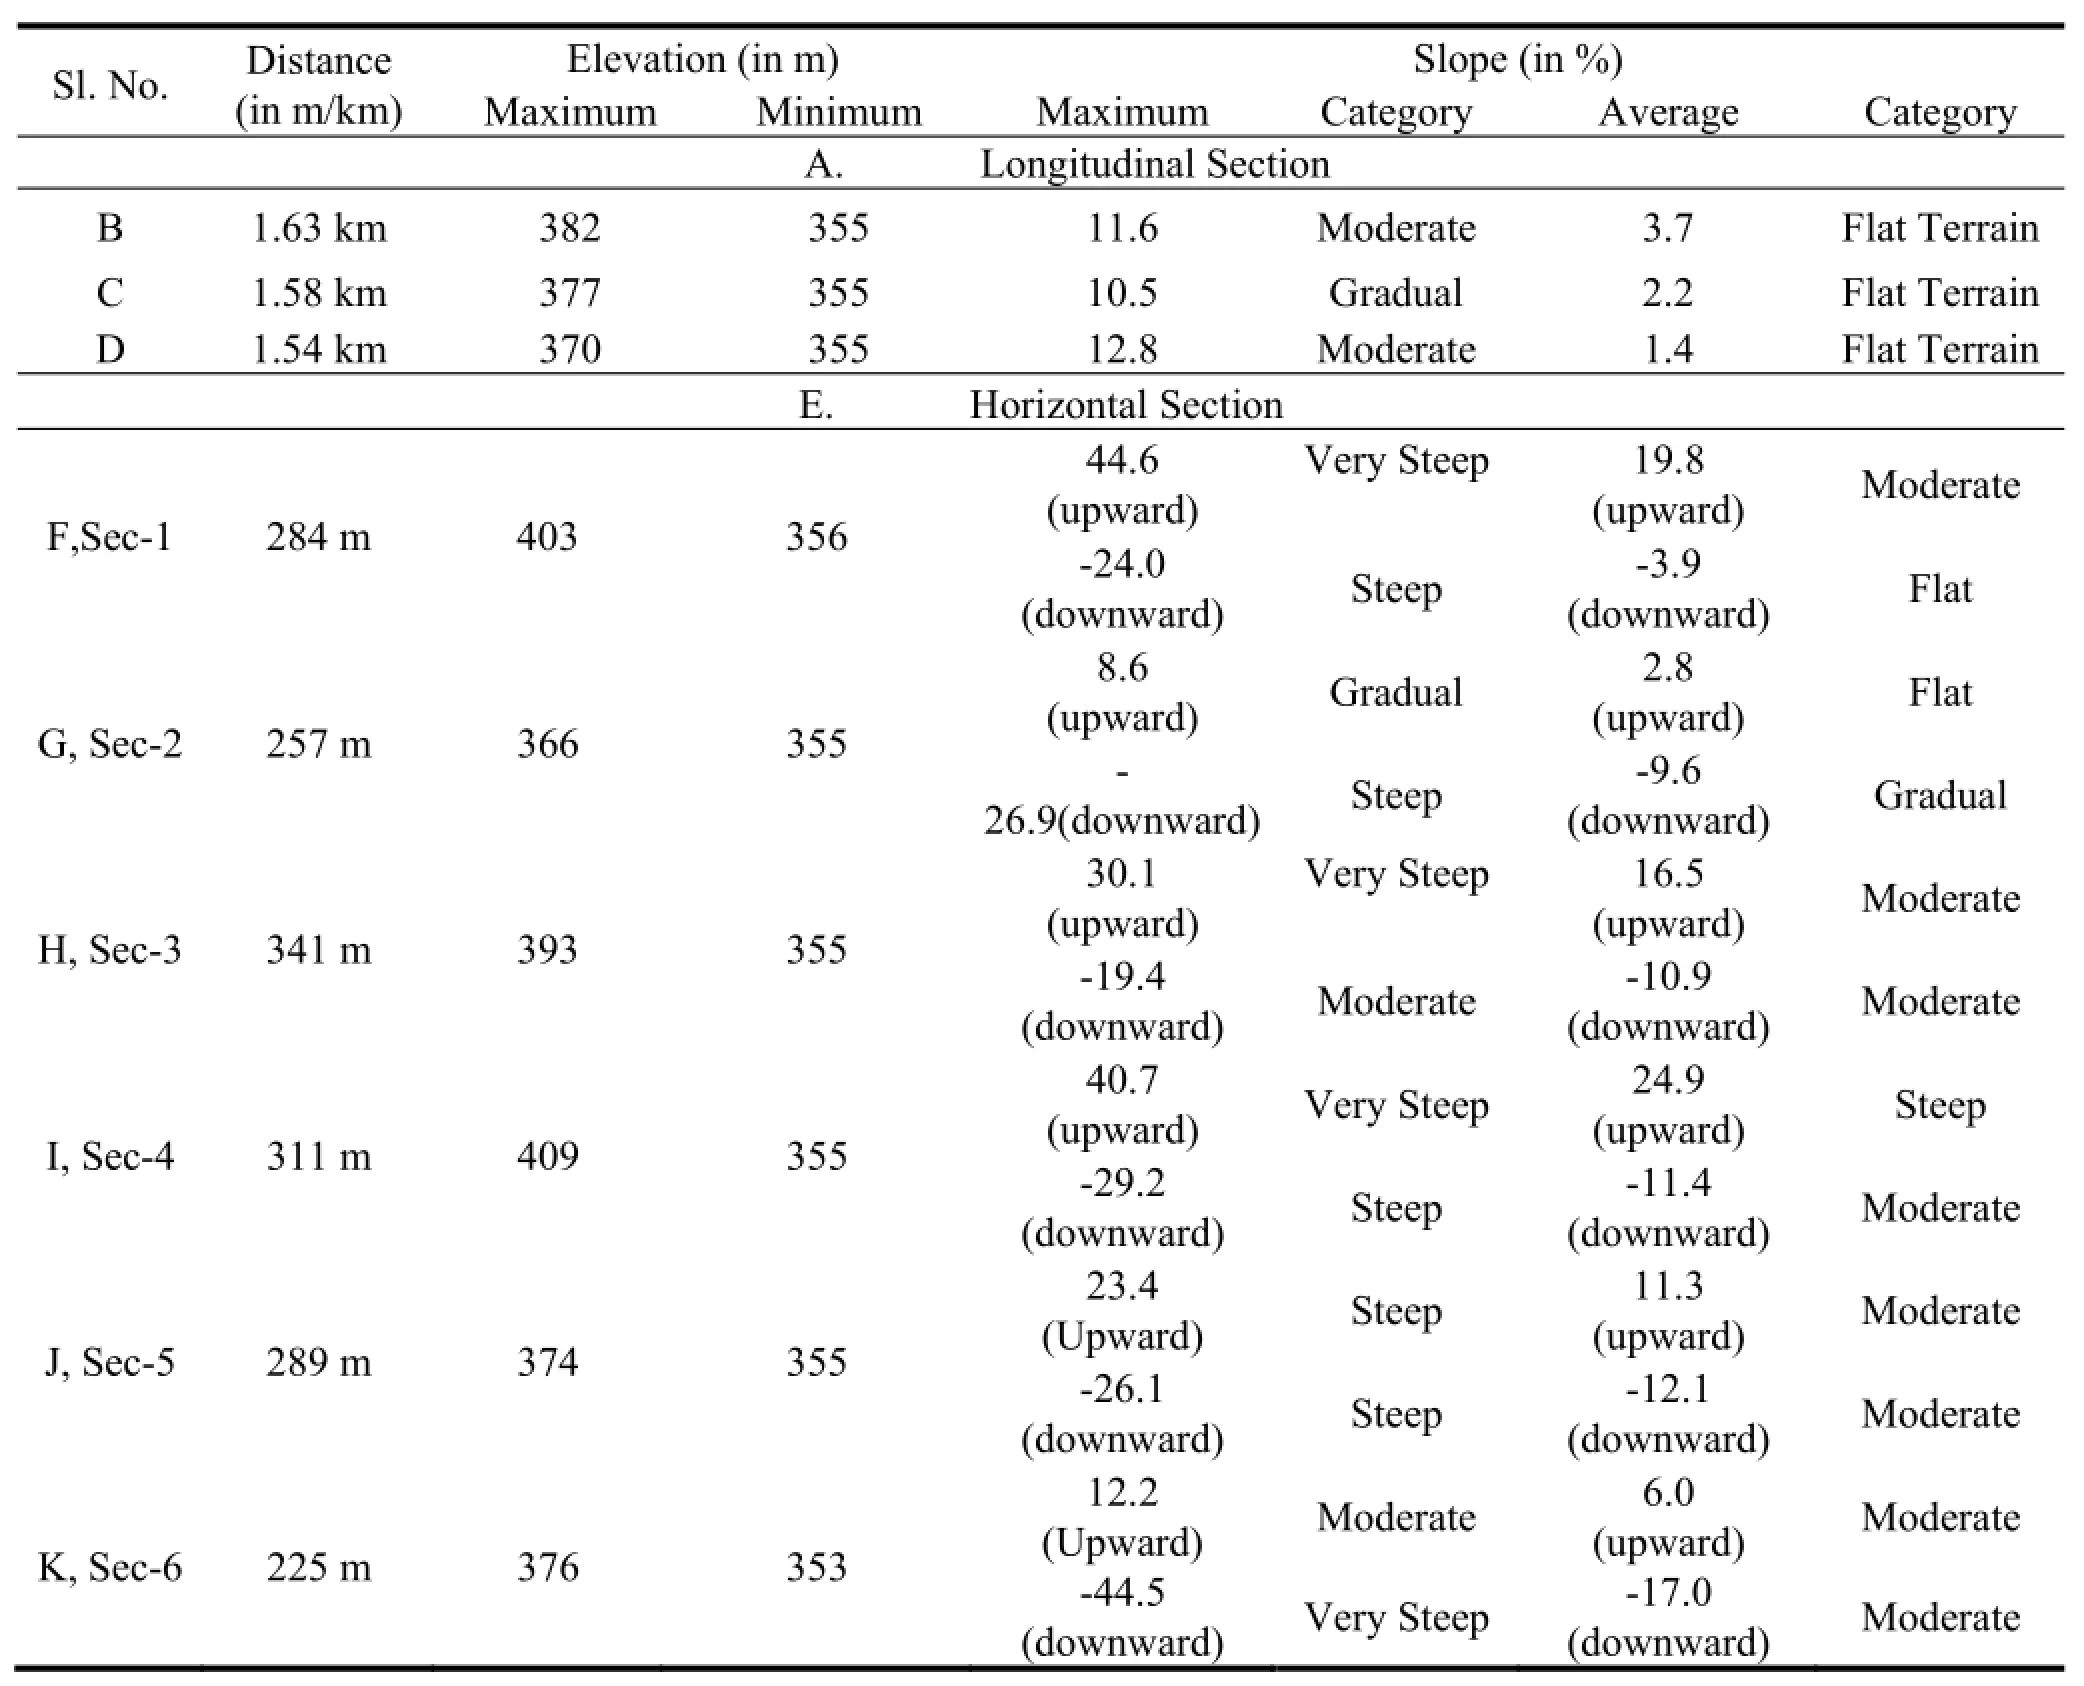
Table 3 Lake surface elevation information according to section profile (longitudinal and horizontal) along with its slope information
Fig.10, C is the middle part longitudinal section transect line indicates that the distance is 1.58 km, maximum and minimum elevation is 377m and 355 m respectively and maximum and average slope is 10.5% and 2.2% which falls under the moderate slope and flat terrain respectively, which indicate a same slope pattern as found in Fig. 10 B.
In Fig. 10, D the Right part longitudinal section transect line indicate the distance is 1.54 km, maximum and minimum elevation is 370 m and 355 m respectively and maximum and average slope is 12.8% and 1.4% which falls under the moderate slope and flat terrain respectively.
In Fig. 10, F the lower down part of Lake horizontal section-1 is drawn, the horizontal distance is 284 m, maximum and minimum elevation is 403 m and 356 m respectively and maximum slope is 44.6 % in upward direction (falls under very steep slope), -24.0 % (falls under steep slope category) in downward direction andaverage slope is 19.8 % (falls under moderate slope) and -10.0 % (gradual slope category) is in upward and downward direction respectively.
In Horizon section 2 Fig. 10, G profile total distance is 257 m where maximum and minimum elevation recorded 366 m and 355 m respectively, maximum and average slope identified 8.6 % in upward direction(falls under gradual slope), -26.9 % in downward direction (falls under steep slope category) and 2.8 % in upward (falls in flat terrain), -9.6 % in downward direction (falls in gradual slope category) respectively.
On the other hand, horizontal section profile-3, Fig. 10 H the total distance calculated is 341 m, where maximum and minimum elevation is 393 m and 355 m respectively, maximum slope is 30.1 % in upward direction (falls under very steep slope category), -19.4 % in downward direction (falls in steep slope category)and average slope is 16.5 % in upward direction (falls in steep slopes category), -10.9 % in downward direction indicate as moderate slope category) respectively. The overall discussion and its statistical information is shown under the Lake surface elevation information according to section profile (longitudinal and horizontal) along with its slope information heading (Table-3).
In horizontal section profile-4, Fig. 10 I the total distance calculated is 311 m where the maximum and minimum elevation is 409 m and 355 m respectively, maximum slope is 40.7 % in upward direction (falls in very steep category), -29.2 % in downward direction (falls in steep slope) and average slope is 24.9 % in upward direction (indicate as steep slope), -11.4 % in downward direction (indicate as moderate slopes cattegory) respectively.
In the horizontal section profile-5 Fig. 10 J shows the total distance is recorded 289 m, where maximum and minimum elevation counts as 374 m and 355 m respectively, mamimum slope is 23.4 % in upward direction (indicate as steep slope), -26.1 % in downward direction (indicate as moderate slopes) and average slope is 11.3 % in upward direction (indicate as moderate slope), -12.1 % in downward direction (considered as gradual slope category) respectively (Table-3).
In the final Fig. 10 K horizontal section profile-6 shows the total distance is 225 m, where maximum and minimum elevation found 376 m and 353 m respectively, maximum slope is 12.2% in upward direction(indicate as moderate slope), -44.5% in downward direction (indicate as steep slopes) and average slope is 6.0% in upward direction (gradual slope category), -17.0% in downward direction (moderate slope category)respectively.
4.5 Lake Bottom Topography Drawing Based On Transect Profile (Vertical and Horizontal)
Transect as in Fig. 11 displaying the vertical and horizontal cross section which are further illustrated in Fig. 12 (B1 and B2, B3, B4, B5, B6 respectively) drawn by recalculating the surface depth point from depth grid. B1 profile represents the vertical cross section which indicates the North-South transect, passing through two deepest data point 129.5m and 148m respectively.
East west transects represents the horizontal cross sections in different parts of this lake (from north to south ward direction) i.e. B2, B3, B4, B5 and B6 in figure 11 crossing B1 transect in which all the transects are drawn intersecting all the depressions which could be seen in map of Fig. 11.
The vertical section B1 might look unusual but the fact remains that the scale is different from the rest of the vertical section. So it is harder to visualize the sudden spiky depression like feature.
The overall data quality is very good except the northern part where there are sudden spiky jump in depth. The lake looks more elongated depression in three different patches. Although the depression in the north looks more pronounced. The extreme deep depth point of 145m in the north of the lake is giving a pronounced indication that this is not a sedimentary process which took its way but a tectonic activity leading such geologic feature.
4.6 Lake 3D Configuration Developed based on Water Depth and Contour Data
An important point to consider from a GIS perspectives is how different available spatial models can be connected to available geospatial data. The models used in GIS for geographic data types are different from those used in spatial modelling. Most significantly, data in GIS are generally static, whereas in spatial models they are dynamic. If a spatial model were implemented in standard GIS, then a new layer (or layers) would be cre-ated every time anything happened in the model (Sullivan and Unwin, 2010).
Based on water depth and contour data, 2D figure was transformed into Three Dimensional (3D) figure by using Petrosys software, where Lake has been clearly visualized by its different rotation angle. The Fig. 13(13A, 13B and 13C) shows 3D configuration of Reingkhyonkine Lake in three different perspectives, i.e., Top View (Z is close to North), Partial view (Z is far from North), and Vertical View (Z is too far from North)respectively. The Vertical view gives us a clear picturesque of abrupt change and bottom topographic variation of the Reingkhyongkine Lake.
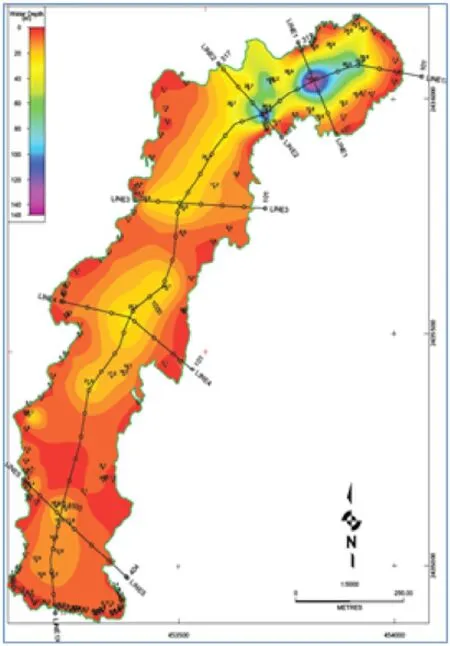
Fig. 11 Bathymetry map showing transect lines
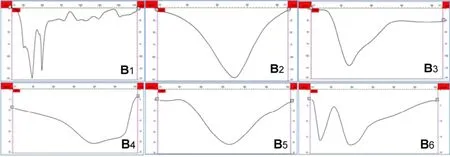
Fig. 12 Transect profile showing (vertical and horizontal) bottom topography according to varied depth of Reingkhyongkine Lake
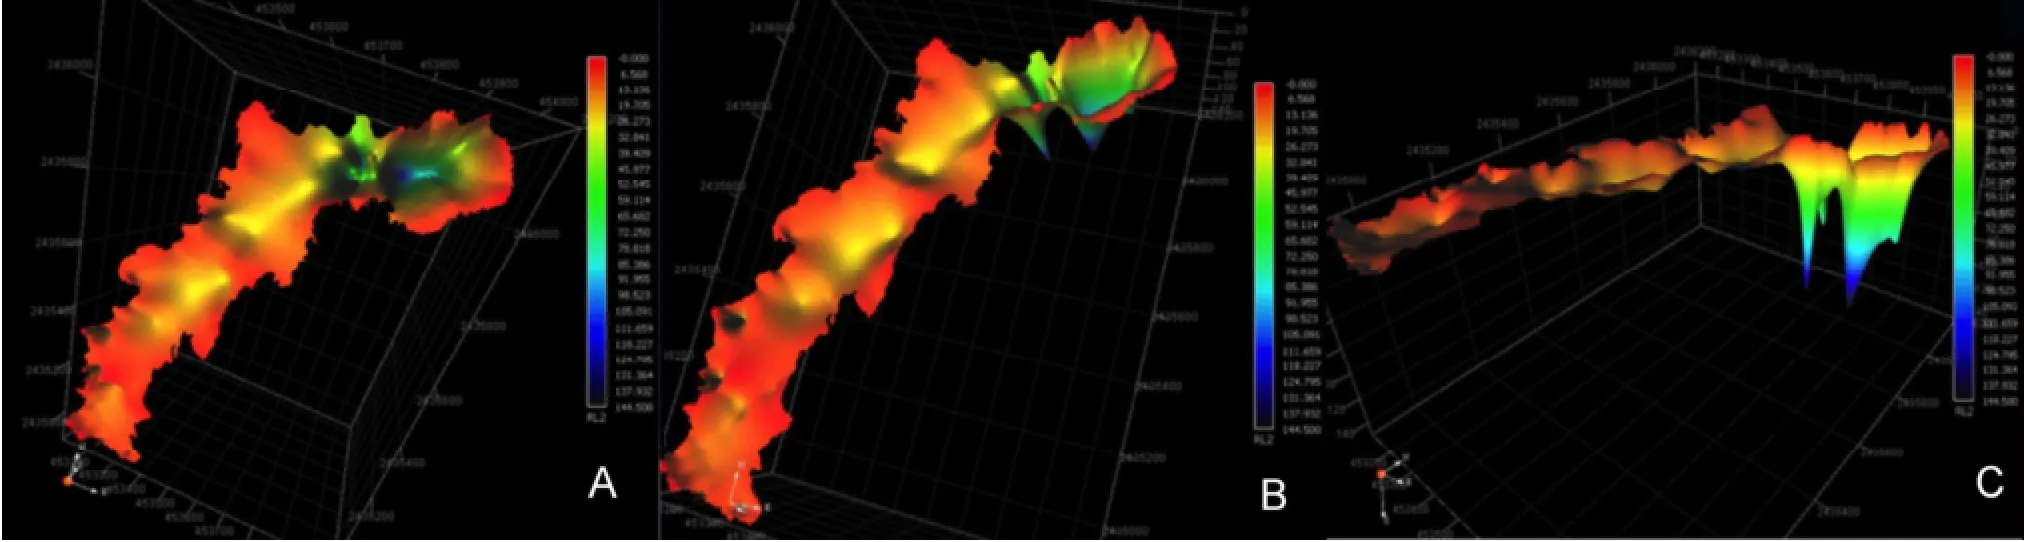
Fig. 13 top view (Z is close to north), partial view(Z is far from north),vertical view(Z is too far from north)
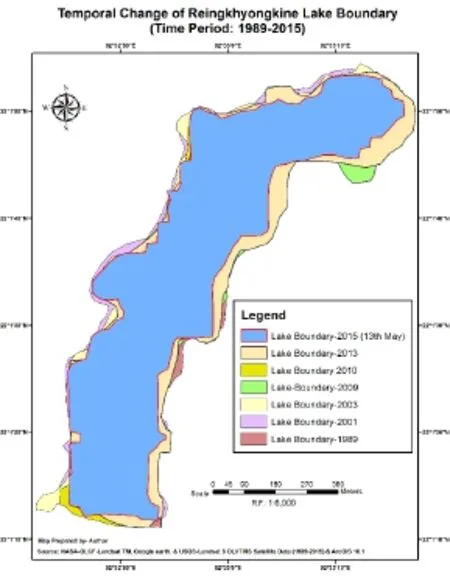
Fig. 14 Temporal change detection of Reingkhyongkine Lake configuration (1989-2015)
4.7 Temporal Change Detection of Lake Configuration (From 1989-2015)
In this final section researchers tried to perform change detection in the lake configuration and measure the area of the lake using multi-temporal Landsat TM from 1989-2010, Google earth satellite data of January
2013 and USGS Landsat 8 OLI data of 13 May, 2015 respectively with the help of ArcGIS 10.1 along with these rate of change (hectare/year) of Reingkhyongkine Lake is also calculated. Fig. 14 shows the temporal change detection of Reingkhyongkine Lake configuration from 1989-2015.
According to generated data of this lake, it can be said that, the rate of change is recorded as (+) 0.40, (-)0.98, (-) 0.17 hectare/year in between 1989-2001, 2001-2003 and 2003-2009 indicate as positive-negativenegative scenarios respectively (Table 4).
After that in between the year 2009-2010, it has been observed that there is a sudden change of its configuration due to natural (i.e. high intensity rainfall and massive hill erosion) and anthropogenic activities (jhum cultivation, bush clearance, tree cutting etc.) which is estimated as 3.94 hectare/year.
The available satellite data in between year 2010- 2013 shows that, the lake area is changing at the rate of 1.78 hectare/year showing negative value which indicate as decreasing status of lake.
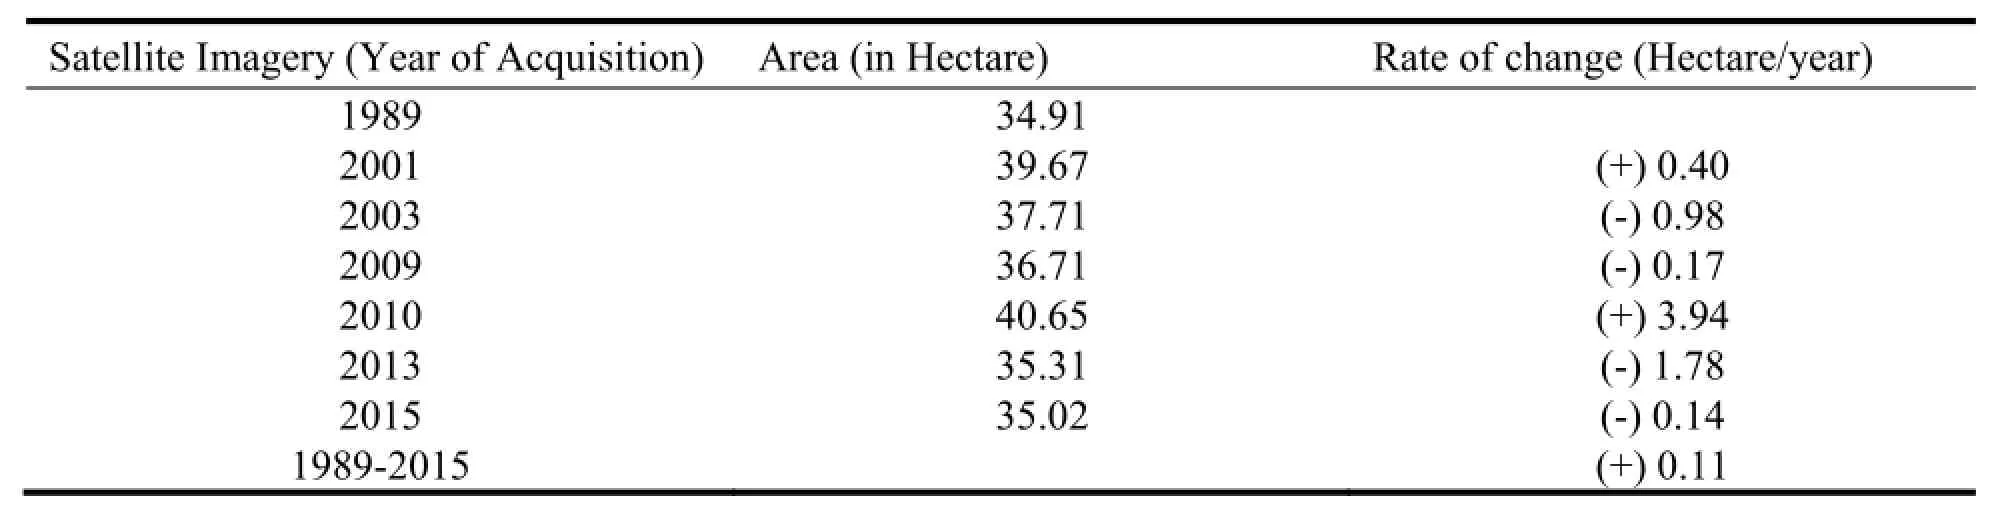
Table 4 Temporal change detection of lake area in between 1989-2015 (Source: Data Computed by Author using ArcGIS 10.1 Software)
After that according to Landsat 8 OLI data of 13 May 2015 compared with 2013, and where changed value also indicate a decreasing scenario and it is changing at the rate of 0.14 hectare per year. It can be said that in between 1989-2001 lake area has increased but in 2001-2009 a gradual loss of area is witnessed and in 2009-2010 again the lake area increased but afterwards its again shows a loss of area at the rate of 0.14 hectare per year and finally the overall assessment result of the 26 years from 1989-2015, shows an increasing scenario(marked as positive sign) and lake area has been changed at the rate of 0.11 hectare/year.
5. Conclusions
The observations from the present study are listed below:
· The analysis of DEM revealed that lake surface stands on different elevation levels, where lake surface elevation range falls within 352-424 meter from a.s.l.
· The water depth ranges from 0 to 148m. During field survey, total 163 water depth sample points were measured where the lowest value is recorded 0.50 m and highest value is 145 m.
· Water volume is calculated from the produced Map and the data shows a sharp declining tendency of total lake water volume and the total loss of water volume is recorded as 366926.69 cubic meters in between 2010 to 31 January 2013.
· Lake surface elevation profile shows a varied surface geometry due to topographic variation.
· Lake Bottom Topography Drawing Based on Transect Profile (Vertical and Horizontal) is made along some user defined directions. The data shows a more elongated depression in three different patches. Although the depression in the north looks more pronounced. The extreme deep depth point of 145m in the north of the lake is giving a pronounced indication that this is not a sedimentary process which took its way but a tectonic activity, the same geometry is also reflected from the 3D configuration of the Lake and contour data.
· Change detection study performed for the lake configuration shows the temporal change of area from 1989-2015. It was finally observed that the lake is changing at the rate of 0.11 hectare/year.
5. Final remarks
Reingkhyongkine Lake is located in the Rangamati hill Tracts, which is the extended part of Himalayan syntaxial bent started from Arunachal Pradesh, India. According to geological literature rock formations in these areas are transacted by major strike-slip faults in the Himalaya-Tibet system and the formation of strike-slip faults are associated with lateral extrusion tectonics in models. The study area has suffered extensive thrusting, faulting and folding, with the help of thin skin tectonics different structures of the area are modelled.
The lithological components of the area clearly show that the area is a part of fore-arc basin. Naturally it will be devoid of any considerable volcanism. Volcanic rocks are only located in the northwestern part of Bangladesh. Linear shape of the said lake is matching with the fault geometry of the study area. Bathymetry of the lake as revealed from Lake Bottom topography drawing based on Transect Profile (Vertical and Hori-zontal) shows a strong lineament trending along NE-SW and the profile section suggests a fault like geometry. Occurrence of this type of faults in this area is common, lineaments occur in conjugate set in this region(Nandy, 2001; Nath et al., 2012). Orientation of the lineament in the lake is matching with the fault system as well as the lineament pattern of the area. Existing seismic map of this area shows it has post-collisional intracratonic characteristics (Nandy, 2001). Reactivation and adjustment along the numerous faults results the seismicity and also maybe a prime cause of the change of lake area with time. Considering all the points discussed above we may conclude that the origin of the lake is associated with fault and the major lineament is the actual fault line.
Acknowledgement
The authors greatly acknowledge the local tribal people during field investigation and NASA-GLCF of University of Maryland, USA for Landsat TM and USGS for Landsat 8 OLI-TIRS satellite imageries respectively for their free global land cover facility data archive to the world audience for academic research purposes and finally special thanks to the anonymous reviewers and editor of this journal for considering this paper in the special edition of JEAM.
Avouac, J.P. (2007), Dynamic processes in extensional and compressional settings-mountain building: From earthquakes to geological deformation, Treaties on Geophysics 6, 378-439.
Briggs, I.C. (1974), Machine contouring using minimum-curvature, Geophysics 39, 39-48.
Google earth Satellite Imageries version-7.0-user defined downloadable available at http://www.earth.google.com.
Falivene, O., Cabrera, L., Tolosana-Delgado, R., and Saéz, A. (2009), Interpolation algorithm ranking using cross-validation and the role of smoothing effect. A coal zone example, Computers & Geosciences 36(4), 512-519.
Fotheringham, A.S., Brunsdon, C. and Charlton, M. (2000), Quantitative Geography: Perspectives on Spatial Data Analysis, Sage Publications. Available at https://books.google.com.bd/books?isbn=0761959475, accessed on 09 June, 2015.
Håkanson, L. and Jansson, M. (1983), Principle of Lake Sedimentology, Springer, Heidelberg, p. 316. Available at http://www.geo.uu.se/digitalAssets/198/198054_1spm-lakes.pdf, accessed on 12 June, 2015.
Heywood, I., Cornelius, S., and Carver, S. (2010), An Introduction To Geographical Information Systems, 3rdEdition, Pearson Education Limited, UK. p. 262.
Jiménez-Munt, I. and Platt, J.P. (2006), Influence of mantle dynamics on the topographic evolution of the Tibetan Plateau: Results from numerical modelling, TECTONICS 25, TC6002.
Khan, F.H. (2000), Geology of Bangladesh, the University Press Limited Co., Dhaka.
Lo, C.P. and Yeung, A.K.W. (2002), Concepts and Techniques of Graphic Information Systems, Prentiece Hall of India Pvt. Ltd., New Delhi, India.
Mandal, N., Mitra, A. K. and Bose, S. (2009), Orogenic Processes in Collisional Tectonics with Special Reference to the Himalayan Mountain Chain: A Review of Theoretical and Experimental Models. Physics and Chemistry of the Earth's Interior Crust, Mantle and Core, Indian National Science Academy A Platinum Jubilee Special Issue, (Ed) Alok K. Gupta and Somnath Dasgupta. Springer. pp. 41-65.
Molnar, P. (1988), A review of Geophysical constraints on the deep structure of the tibetan Plateau, the Himalaya and the Karakoram, and their tectonic implications, Philosophical Transactions of the Royal Society A 326, 33-88.
Nandy, D. R. 2001. “Geodynamics of Northeastern India and the adjoining region”. acb publication, Kolkata, India.
Nath, B., Acharjee, S., and Mitra, A.K. (2012), Lake configuration and change detection studies using remote sensing and GIS techniques: A study on Bogakine Lake, Bandarban, Bangladesh, International Journal of Lakes and Rivers, 5(2): 75-89.
O'Sullivan, D. and Unwin, J.D. (2010), Geographic Information Analysis, 2ndEdition, John Wiley & Sons, Inc., New Jersy.
Smith, W.H.F. and Wessel, P. (1990), Gridding with continuous splines in tension, Geophysics 55(3), 293-305.
SRTM DEM Data 90m Resolution, available at http://srtm.csi.cgiar.org.
30 November 2014
.
Email address: nath.gis79@gmail.com
ISSN 2325-6192, eISSN 2325-6206/$- see front materials © 2012 L&H Scientific Publishing, LLC. All rights reserved.
10.5890/JEAM.2015.03.003
Accepted 18 August 2015
Available online 1 September 2015
 Journal of Environmental Accounting and Management2015年3期
- Journal of Environmental Accounting and Management的其它文章
- Industrial Ecology Opportunities between CHP and Arable Farming in Alloa, Scotland
- Evaluation Method for Science and Technology Performance on Energy Conservation and Emission Reduction
- Soil Remediation Environmental Decision Support System Based on AHPPROMETHEE II Approach
- Emergy and Form: Accounting Principles for Recycle Pathways
- Random Forest for Toxicity of Chemical Emissions: Features Selection and Uncertainty Quantification
- Coupling Multi-objective Constrained Optimization, Life Cycle Assessment, and Detailed Process Simulation for Potable Water Treatment Chains