5G High Frequency Band Channel Modeling and Insights on System Design
2015-10-20 05:31QianClaraLiIntelCorporationSeniorResearchScientistGengWuIntelCorporationChiefTechnologistIntelFellow
信息通信技术与政策 2015年5期
Qian(Clara)Li Intel Corporation Senior Research ScientistGeng Wu Intel Corporation Chief Technologist,Intel Fellow
5G High Frequency Band Channel Modeling and Insights on System Design
Qian(Clara)Li Intel Corporation Senior Research Scientist
Geng Wu Intel Corporation Chief Technologist,Intel Fellow
There are two main opposing views in the wireless industry on the feasibility of developing 5th generation(5G)cellular networks in mm-Wave bands.The optimistic view is based on the fact that the path loss in mmWave bands is not significantly worse than that in cellular bands when beamforming gain is also considered.The cautious view points out the significant blockage issues due to the lack of diffraction and adequate penetration in mmWave bands.The implementation of 5G mmWave cellular networks also faces major challenges due to the high link budget needed for long-range communication and the strong dependency on beamforming technology.This paper addresses some of these fundamental technology issues,from mmWave channel characters and channel modeling to the implications on system and network architecture design. Although we believe that mmWave can be used for 5G networks,we show that the air interface,device and network design will be very different from existing cellular design.
5G,high frequency band communication,high frequency band channel model,high frequency band system design
1 Introduction
Next-generation wireless communications systems (5G)areexpectedtoexplorethevastfrequencyresourcesin frequency bands above 6 GHz(for brevity,we term the bands from 6 GHz to 300 GHz as millimeter-wave, mmWave,bands).Unlikeinthelowfrequencybandwhere the wave propagation behavior is dominant,for higher frequenciesthebehaviorofparticlesisprominent.Asaconsequence,the existing channel models designed for bands below6GHzarenotalwaysdirectlyapplicable.
To some extent,5G channel modeling and air-interfacedesignareintertwined:Asweimproveourunderstandingofthepropagationcharacteristics,wecanbetteridentify the key technologies required for 5G communications.As weidentifytherequiredkeytechnologies,wecanmodelthe propagationchanneltothelevelofdetailwhichissufficient to support evaluation of those technologies.Observations fromextensivemmWavechannelmeasurementcampaigns [1]-[3]suggest the following key characteristics of mmWavepropagation:(1)Highpathloss,(2)quasi-optical propagation,(3)prominent diffused scattering effect.As canbeseeninFigure1,thepathlossat28GHzismorethan 20dBhigherthanthatofat2GHz.Thehighpathlosslimits coverage,which requires antenna gain to compensate.The quasi-opticalpropagationeffectismanifestedintheaspects of high diffraction and penetration losses,high blockage probability,and reflections from small objects.The diffusedscatteringeffectstakestheenergyofthereflection pathandresultinanumberofsub-pathsformingpathclusters.Effects of reflection,diffraction,diffused scattering, andpenetrationareshowninFigure2.
Based on the mmWave channel characteristics,weexpect the key technologies for mmWave 5G communications to be:beamformed transmission and reception for boosting link budget,beam tracking for maintaining connection,anchor-boosterarchitecturewithopportunistic communicationinthefaceofblockage,andedgecomputation for maintaining high layer traffic flow stability.To enablethedesignandevaluationoftheenvisionedkeytechnologies,a channel model which models spatial/temporal correlation down to the cluster level is needed:with highly directionalbeamforming,onlyasmallnumberofpathscan be captured,which requires cluster tracking and proper scheduling of multi-user transmission.Current channel modeling approaches either have not focused on modeling cluster-level spatial/temporal correlation,e.g.,the statistical models used in WINNER[4]and 3GPP[5]model the spatial/temporal correlation at the large-scale parameter level)or of high complexity for implementation(e.g.,the COST259/273/2100 models[6]-[9]or the map-based rayopticalmodels[2]enableaccuratecluster-leveldetailmodelingbutarecomplicatedforimplementationinsystem-levelsimulators).
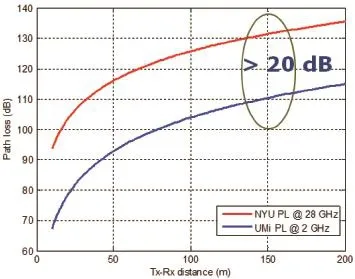
Figure1 Pathlossat2GHzand28GHz
In this paper,we discuss our proposed statistical mmWave channel model considering cluster-level spatial/ temporalcorrelation.Geometrystatisticsareusedtomodel clusterevolution.Asonlystatisticalinformationisused,the model achieves a good balance between accuracy and complexity.System-level simulation results based on the proposed channel model provide insights into the system performance of mmWave cellular communications for 5G undertheproposeddesignprinciples.
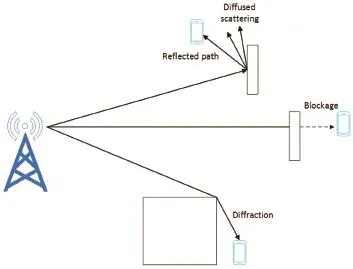
Figure2 Effects of reflection,diffaction,diffused scattering,andpenetration
2 Channel model framework
Wireless channel model can be generally expressed usingthedouble-directionalmodel:

Theparametersthatdefinethechannelarethenumber of path clusters N of the link,the number of rays within the n-th cluster Mn,the path gain of each ray Hn,m,the phase of each ray Φn,m,the time-of-arrival(ToA)of each ray τn,m,the azimuth angle-of-arrival(AoA)φAoA,n,mand azimuth angleof-departure(AoD)φAoD,n,mofeachray,andthezenithangleof-arrival(ZoA)θZoA,n,mand zenith angle-of-departure (ZoD)θZoD,n,mof each ray.Based on the double directional modeling approach,channel modeling activities at the link level have focused on finding ways to generate the channel parameters for various deployment and communication scenarios.
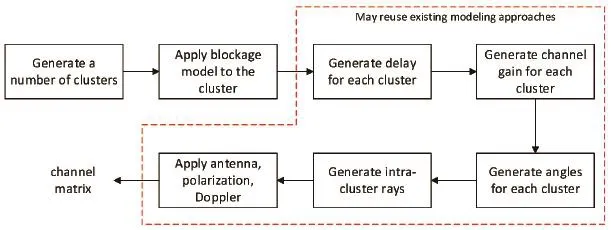
Figure3 Channelgenerationframework
Figure1illustratesageneralframeworkingenerating the channel.The modeling approach used in WINNER/ 3GPP is effective in generating the path delays,the path gains,the arrival/departure angles and the polarization and Doppler.Intra-cluster model has been developed in IEEE 802.11ad[11]and MiWEBA[3].The missing parts are in cluster generation considering cluster-level spatial/temporal and adding blockage effect.In developing 5G channel model,we need to add the missing part while at the same timetrytomaximumthereuseofexistingmodels.However,asthechannelparametersshouldbemodeledinintegration rather than as isolated components,modeling clusterlevel spatial/temporal correlation and blockage could requirechangesinmodelingtheothercomponents.
3 ProposedmmWavechannelmodel with cluster- level spatial/temporal correlation
Modeling spatial/temporal correlations at the clusterlevel could increase the model implementationcomplexity.Thelevelofcomplexity depends on how much geometry information is involved.In this section, we describe our proposed statistical channelmodelwithcluster-levelspatial/ temporal correlation which allows lowcomplexity implementation by using only geometry statistics of the cluster distribution.
Signal propagation in the network area depends only on the location of the transmitter and the propagation interactions with the environment regardless of the presence of receivers.As illustrated in Figure 2,each propagation path cluster can be defined in the spatial and temporal domains by its coverage area,the departure/arrival angles,and the propagation time.The coverage area specifies the network areatheclusterreaches,whilethepropagationtimedefines the transmission time from the transmitter to the network areaalongthepropagationpath.
Based on this understanding,in the proposed model we first generate the clusters in the network area and then, based on the receiver location,we associate the specific receiver with the clusters that cover its location.Nearby receiverswhichfallinthecoverageareaofthesamecluster will be correlated naturally.Channel evolution due to mobility can also be naturally modeled as the associated clustersevolveovertime.
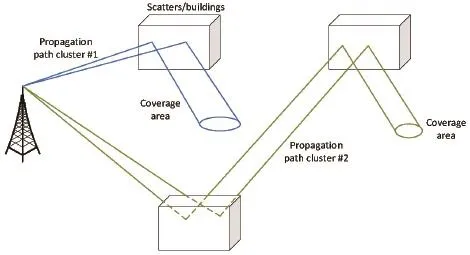
Figure4 llustrationof propagation
To generate the clusters,we first deploy the clusters across the network area,and then generate the channel parameters,i.e.,arrival time,path gain,departure/arrival angles,for each of the deployed clusters.For each of the base stations(BS)in the network area,we have one set of clustersbedeployed.Theclusterdeploymentforeachofthe BSs can be independent or cross-correlated.Figure 5 illustrates the cluster deployment associated with one BS in the x-yplaneofthenetworkarea.Geometrically,eachclusteris specified by its cluster center,its coverage range and the transitionregion.Thetransitionregionisusedtomodelthe ramping up and ramping down of the cluster.In deploying the clusters,we first generate the cluster center and then generate the coverage range.The cluster center dropping and the cluster range values should be generated following certain distributions obtained from measurement and/or ray-tracing simulation.Clusters can be overlapping,i.e., multipleclusterscanbeobservedateachlocation.Different distributions for non-line-of-sight(NLOS)clusters and line-of-sight(LOS)clustersarealsoexpected.
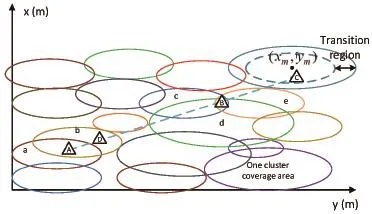
Figure5 llustrationof clusterdeployment
In[14]and[15],weprovideddetaileddescriptionson how to deploy the clusters and generate the small scale parameters.For NLOS clusters,we deploy the clusters in thenetworkareafollowingcertaindistribution.Thecluster distribution and density vary for different deployment scenarios.AnexampledistributionisthePoissonpointprocess as discussed in[14].For LOS cluster,to better reflect the practical scenario,we define LOS spots as continuous regionasshowninFigure6.Whenadevicemovesfromone location to another,it could experience multiple LOS regions.DetaileddescriptiononLOSregiongenerationcan befoundin[14].
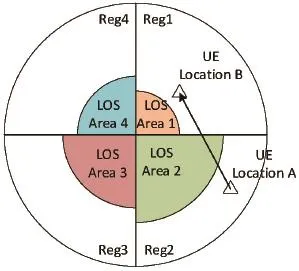
Figure6 lllustrationof LOSarea
Foreachofthedeployedclusters,wethengeneratethe channel parameters as defined in the double directional channel model.In[15],we proposed a geometry-based statistical channel model for generating the parameters.In the proposed approach,we take the statistical geometrical distributions of the communication environment and the timeofarrival(ToA)distributionasinputs.GiventhegeneratedToAof a given path,we can calculate the length of the path.Togetherwiththegeometricaldistributionofthescatterswithintheenvironment,andthestatisticsonthereflection/diffraction losses,we can calculate the shadow fading foreachpath.Thepathgaincaninturnbecalculatedbyaddingtheshadowfadingwithfree-spacepathgain.
More specifically,given the ToA of n-th path tn,the lengthofthepathcanbecalculatedas

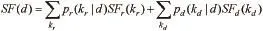
Where pr(krǀd)and pd(kdǀd)are the probabilities ofencounteringkrreflectionsandkddiffractionsatdistanced, respectively.In[16],we obtained the distributions of pr(krǀd)andpd(kdǀd)usingray-tracingsimulation.
With the generated clusters in the network area,the channel observed by each user equipment(UE)in the networkareaistheaggregationofclustersrelatedtotheUE location.The number of clusters can be accounted for accordingly.FortheexampleshowninFigure5,locationA isassociatedwithclustersaandb,andlocationBisassociated with clusters c,d,e.LocationAand location D can both observe cluster b.Cluster-level correlation between locationsAandDisthereforenaturallyintroduced.
Further extensions of the model include the association of each cluster with a coherence time to model the dynamicappearanceoftheclusterduetochangesinthesurrounding environment,and modeling the arrival time of eachclusterastime-varyingtoaccountfordoublemobility atthetransmitterandreceiver.
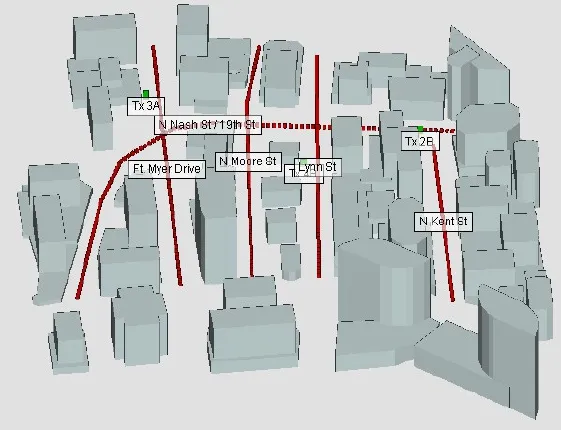
Figure7 Rosslyncitymap-3D
4 Channel model calibration
We calibrate the proposed channel model using raytrackingsimulation.CitymapofRosslyncity,Virginia,US, wasusedasshowninFigure7andFigure8.
Weusethepathlossandroot-mean-square(RMS)delayspread(DS)asthemetricforcalibration.At28GHzcarrier frequency,the path loss exponent of the considered Rosslyncityscenariois3.22,i.e.

Figure 9 shows the path gain generated using the path lossmodelobtainedfromraytracingandthepathgaingenerated from the proposed model.For clear comparison,we did not show shadow fading in the ray-tracking path loss. Figure10showsRMSDSgeneratedfromray-tracingsimulationandfromourproposedmodel.ComparisoninFigure 9 and Figure 10 shows a good match between the proposed modelandray-tracingsimulation.FromFigure9,wecanalso observe that as transmitter-receiver distance increases, theprobabilityofdeepfadingincreases.
5 Insights on system design
BasedontheunderstandingonmmWavechannelcharacteristics,we believe that the following aspects would need to be carefully considered when we design 5G mmWavecommunicationsystems.
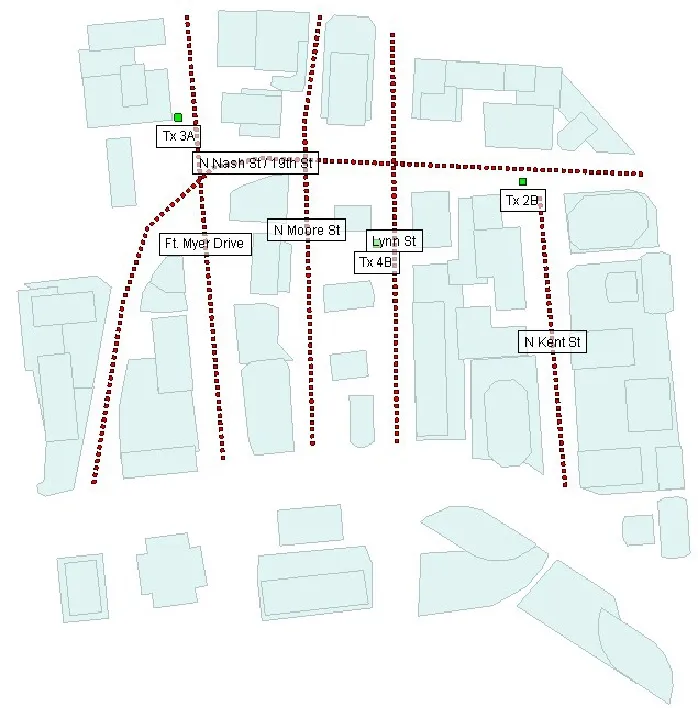
Figure8 Rosslyncitymap-2D
Beamforming,beam tracking and multiple access schemesneedtobecarefullydesigned.Highantennagainis needed to compensate for the pathloss and achieve sufficient link budget for sufficient cellular coverage.A viable solutiontoachievehighantennagainincommercialdevices is by using array antennas.With proper beamforming, aK-elementcriticallysampleduniformlineararray(ULA) canachieveanantennagainof10log10KdB.Figure11compares the single-to-interference-noise-ratio(SINR)distribution under different array transmission combinations at the BS and UE.The simulation setup is summarized in Table 1.As can be seen,beamformed transmission and reception at both BS and UE gives 20 dB gain in SINR as compared to omni transmission and reception at both ends.High antenna gain comes with high directivity and narrow beamwidth.The half-power beamwidth of a beamformed K-element critically sampled ULA is 2π/K.Considering thelargearraysizeneededforsufficientantennagain(e.g., K=64 for antenna gain of 18 dBi),the beamwidth can be verynarrow.Thenarrowbeamwidthimposeschallengesin multiple access,i.e.,the BS and the UE can appear blind to each other if they are not beam aligned.Beam scanning or beamforming schemes with wider beamwidth(which wouldleadtoreducedantennagain)couldbeneededduring themultipleaccessphase.Beamscanningrequirestimeand wide beamwidth beamforming reduces link budget.Moreover,with large beamwidth,the observed delay spread and interference would be higher,which would lead to overhead in the used guard interval and increased device complexityandpowerconsumptionforinter-symbolandinteruser interference cancellation.There is,therefore,a tradeoff between latency,link budget,overhead,complexity, power consumption,and multi-user capability.In case of mobility,beamtrackingisneededtokeeptheconnectionin thefaceofdynamicclusterevolution.
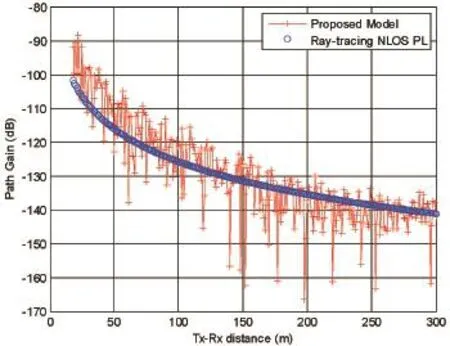
Figure9Pathgainsof theproposedmodel andray-tracingmodel
Anchor-boosterarchitecturewouldbeneededforcopingwithblockage.AsitcanbeobservedinFigure12,which shows the temporal evolution of the beamformed channel gainofthelink,themmWavelinkcouldbeinterrupteddue to blockage.To maintain connectivity,an anchor-booster architecturecanbeappliedwhereBSsoperatingatlowcarrier requencies serve as anchors to keep the connection between the UE and the network,while the mmWave BSs serve as boosters for boosting the data rate when the mmWavelinkisavailable.Withsuchanchor-boosterarchitecture,thetargetofthemmWaveBSisrathertoprovideopportunisticaccessandinstantaneousdatarateboostingthan to provide connectivity.To enhance mmWave cell coverage,dense cell deployment and cooperative multi-point (CoMP)transmission and reception can be applied.To enableanchor-boosterarchitecture,newlayer1/2/3designapproachesaresoughtatmmWavebandswhichisexpectedto bedifferentfromthatinlowcarrierfrequencies.
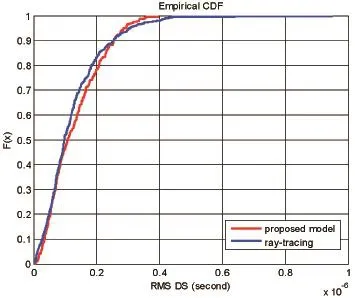
Figure10 RMS DS generated by the proposed modelandbyray-tracing
6 Conclusion
In this paper,we discussed mmWave channel modelingandkeycomponentsofmmWavesystemdesignfor5G communications.A statistical channel modeling approach consideringcluster-levelspatialandtemporalcorrelationis proposed.The adopted modeling approach captures channelevolutiondowntotheclusterlevelwhichisessentialfor designing mmWave systems with highly directional transmission/reception.Thechannelmodelisthencalibratedus-ing ray-tracing simulation.Based on the observed channel characteristics and system performance,we discussed that beamforming,beam tracking,and multiple-access techniques taking into account the tradeoffs between link-budget,latency,overhead,power consumption,and anchorboosterarchitecturewithopportunisticaccesswouldbekey inenabling5GmmWavecommunicationsystems.
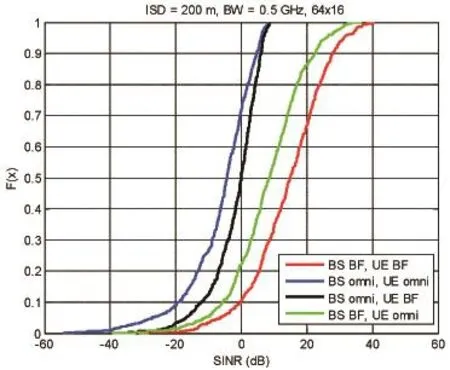
Figure11 SINRCDFintheDLunderdifferentTx/Rx transmissionconfigurations
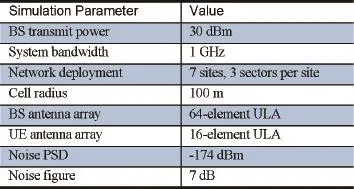
Table1 Simulationsetup
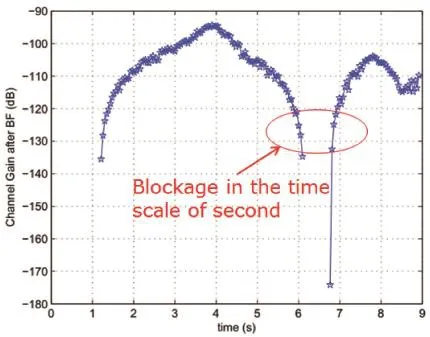
Figure12 Channeltimeevolutioninthepresenceof blockage
[1]T.S.Rappaport,S.Sun,R.Mayzus,H.Zhao,Y.Azar,K.Wang, G.N.Wong,J.K.Schulz,M.Shamimi,andF.Gutierrez.Milli meter Wave Mobile Communications for 5G Cellular:It Will Work.IEEEAccess.5,2013
[2]METIS.InitialChannelMdelsBasedonMeasurements.ICT-317669-METIS/D1.2.4,2014
[3]MiWEBA.D5.1:Channel Modeling and Characterization. FP7-ICT368721/D5.1.6,2014
[4]WINNERII.D1.1.2V1.2:WINNERIIChannelModels,PartI ChannelModels.IST-4-027756/D1.1.2v1.2.9,2007
[5]3GPPTR36.873.Studyon3DChannelModelforLTE.9,2014
[6]A.F.Molisch,H.Asplund,R.Heddergott,M.Steinbauer,and T.Zwick.TheCOST259DirectionalChannelModel-PartI:OverviewandMethodology.IEEETrans.WirelessCommun.12,2006
[7]H.Asplund,A.A.Glazunov,A.F.Molisch,K.I.Pedersen,andM.Steinbauer.The COST 259 Directional Channel Model-Part II:Macrocells.IEEETrans.WirelessCommun.12,2006
[8]L.Liu,C.Oestges,J.Poutanen,K.Haneda,P.Vainikainen,F. Quitin,F.Tufvesson,P.D.Doncker.The COST 2100 MIMO ChannelModel.IEEEWirelessCommun.Mag.12,2012
[9]M.Zhu,G.Eriksson,andF.Tufvesson.TheCOST2100ChannelModel:ParameterizationandValidationBasedonOutdoorMIMO Measurements at 300 MHz.IEEETrans.Wireless Commun. 2,2013
[10]M.Steinbauer,A.F.Molisch,E.Bonek.The Double-directional Radio Channel,”IEEE Antennas and Propagation Magazine.8,2001
[11]A.Maltsev,et.al.Channel Models for 60 GHz WLAN Systems.IEEEDocument802.11–09/0334r8.5,2010
[12]G.Durgin,N.Patwari,andT.S.Rappaport.AnAdvanced3D Ray Launching Method for Wireless Propagation Prediction. IEEEVechicularTechnologyConf.(VTC).5,1997
[13]S.Jaeckel,L.Raschkowski,K.Börner,andL.Thiele.QuaDRiGa:A3-D Multi-cell Channel Model with Time Evolution for EnablingVirtualFieldTrials.IEEETrans.AntennasandPropagation.6,2014
[14]Q.Li,H.Shirani-Mehr,T.Balercia,H.Niu,A.Papathanassiou,G.Wu.MillimeterWaveChannelModelandSystemDesign Considerations.Proc.IEEEICC2015.6,2015
[15]Q.Li,G.Wu,andT.S.Rappaport.Channel Model for Millimeter-wave Communications Based on Geometry Statistics. IEEEGLOBECOM 2014Workshop on MobileCommunications inHigherFrequencyBands.12,2014
[16]Q.Li,H.Shirani-Mehr,T.Balercia,A.Papathanassiou,G. Wu,S.Sun,M.K.Samimi,andT.S.Rappaport.ValidationofaGeometry-based Statistical mmWave Channel Model Using RaytracingSimulation.EEEVTCSpring2015.5,2015
[17]3GPPTR36.814.FurtherAdvancementsforE-UTRAPhysicalLayerAspects.5,2010
2015-04-28)