黄土高原纬度梯度下草本植物生物量的变化及其氮、磷化学计量学特征
李 婷, 邓 强, 袁志友,3 , 焦 峰,3*
(1西北农林科技大学资源环境学院,陕西杨凌 712100; 2 中国科学院水利部水土保持研究所,陕西杨凌 712100;3 西北农林科技大学水土保持研究所,陕西杨凌 712100)
黄土高原纬度梯度下草本植物生物量的变化及其氮、磷化学计量学特征
李 婷1, 邓 强2, 袁志友1,3, 焦 峰1,3*
(1西北农林科技大学资源环境学院,陕西杨凌 712100; 2 中国科学院水利部水土保持研究所,陕西杨凌 712100;3 西北农林科技大学水土保持研究所,陕西杨凌 712100)

黄土高原; 草本生物量; 纬度梯度; 叶片氮 、磷化学计量学
植物生物量是生态系统获取能量的集中体现,能够表征植物的生长状态和当地自然环境的变化动向[1],对生态系统结构和功能的维持起着至关重要的作用[2]。化学计量学是研究生态系统多种元素间平衡的学科,集中探讨了有机体碳(C)、氮(N)、磷(P)三种主要组成元素的计量关系[2-4]。氮和磷作为组成生物体的化学基础,是植物生长的必需营养元素[5],两者在生态系统中存在紧密的相互作用[6-7]。与此同时,氮、磷的临界值也是判断土壤对植物生长的养分供应状况的指标[8-11]。就目前研究进展来看,氮、磷化学计量学研究已经成为揭示植物养分限制状况及其适应策略的重要手段。
利用化学计量学的方法探讨区域尺度上环境因子对植物的响应是当前的研究热点之一,不同尺度上植物叶片氮、磷化学计量学特征与温度、水分、土壤等因子的关系及其变化规律已被广泛研究[12-16],但其结果不尽相同。Reich等[17]分析总结了全球452个样点1280种植物叶片的氮、磷分布格局,结果表明随着纬度的升高,植物叶片氮、磷含量升高,而氮/磷下降,且植物叶片氮、磷及其氮/磷与土壤养分有效性密切相关。Wright等[18-19]在分析了全球175个样点的2548种植物的养分组成后表示,气候因子对植物养分空间分布的影响很弱。He等[12]对中国草地213种植物的化学计量学研究结果与Wright等[18-19]相一致。Han等[20]首次在较大尺度上阐述了中国127个样点753种植物的氮、磷以及氮/磷与气候因子的相关关系,发现中国植物与全球尺度上植物的氮、磷分布存在差异,填补了国际相关研究中中国植物数据的空白。任书杰[21]也分析了中国东部南北样带654种植物叶片氮、磷化学计量学特征与气候因子的关系,结果表明,植物叶片氮、磷含量随纬度的升高显著升高,而氮/磷变化不明显。基于化学计量学组成对植物结构与功能的影响,大多学者认为,化学计量学特征稳定的植物有较高和稳定的生物量[5]。化学计量学组成和生物量的变化受多种环境因子的影响和制约,其中水、热因子可以通过直接引起土壤养分的变化来间接影响植物生物量和化学计量学特征的大小,而光照也可以通过植物的光合作用来影响植物生物量和化学计量学特征的大小。我们通常认为纬度梯度的差异是导致温度、湿度、光照和土壤等环境因子发生变化的主要因素,那么在黄土高原地区,纬度的变化究竟会如何影响草本植物的生物量及其叶片的化学计量学特征?本文对黄土高原部分地区的15个样地进行采样调查,探讨黄土高原草本植物生物量及其叶片氮、磷化学计量学特征沿纬度梯度的变化规律,为进一步研究黄土高原生态系统的土壤养分状况、植物营养元素的限制情况、物质和能量的分布格局提供参考依据。
1 材料与方法
1.1 研究区自然概况和样地分布

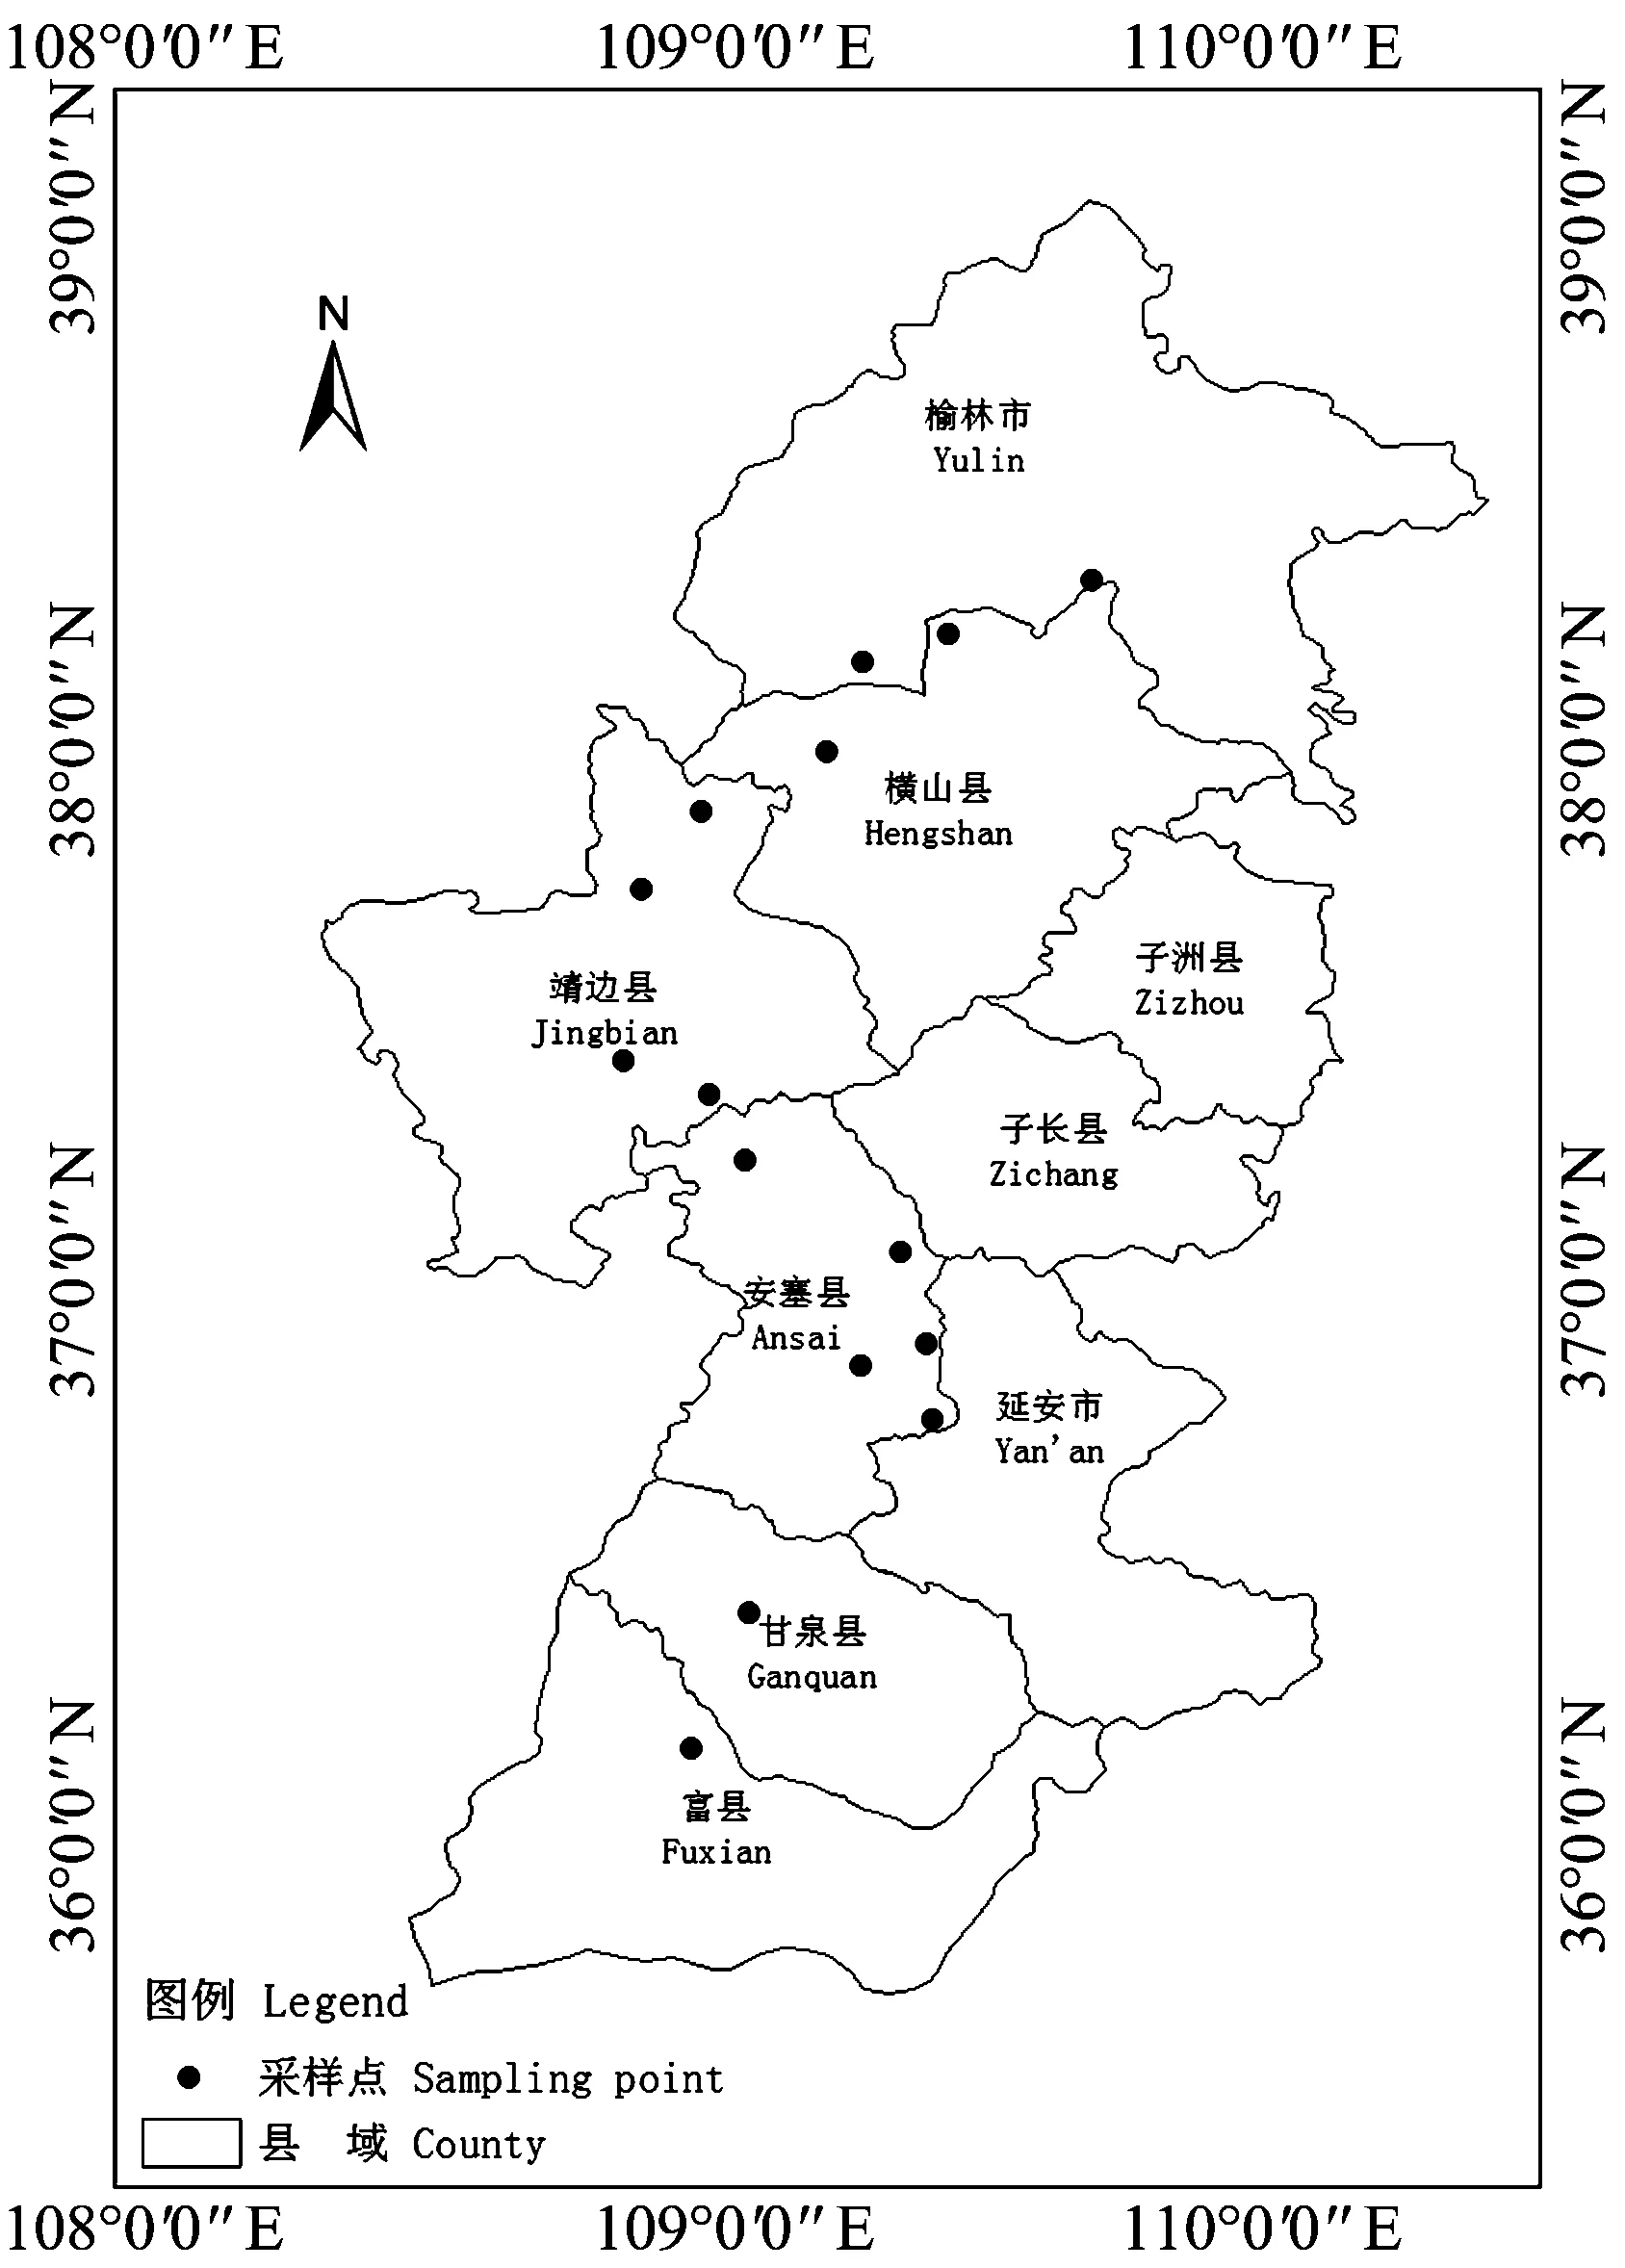
图1 研究区样点分布Fig.1 Sample locations of the study region
1.2 研究方法
1.2.1 样品采集和处理 植物调查和采样时间为2012年8月中上旬植物生长旺盛期,在研究区内选取15个样地。用全球定位系统(GPS)确定采样点的经纬度。在每个样地设置6个1 m×1 m大小的样方,收获样方内所有草本植物,用于测定草本生物量,调查植物群落结构,主要包括物种组成、盖度、高度、株数等。同时采集样地中的地带性植物用于草本植物氮、磷化学计量学的测定。
1.2.2 草本植物生物量的测定 将植物样品于105℃下杀青约10分钟,在70℃下烘48小时至恒重,用电子天平称干重。将6个样方的生物量求平均值作为每个样地的草本植物生物量,并在此基础上计算出不同植被带的草本植物生物量平均值。
1.2.3 草本植物叶片氮、磷含量的测定 将每个样地分种类采集的植物样品经研磨后过100目筛(孔径为0.15 mm),经H2SO4-H2O2消煮后,用全自动凯氏定氮仪(ATN-300)测定草本植物全氮;用钼蓝比色法测定草本植物全磷。单位以植物单位质量的养分含量表示。草本植物叶片氮、磷含量的测定方法参照《土壤农化分析》[22]。
1.3 数据处理
采用SPSS 18.0 对不同纬度梯度下的草本植物生物量及其叶片氮、磷含量及氮/磷进行相关分析和回归分析,并对不同植被带的草本植物生物量及其叶片氮、磷含量及氮/磷进行单因素方差分析。在进行数据分析之前,对各类数据进行正态分布检验,正态分布检验采用单个样本K-S检验。分析得出,黄土高原草本植物生物量及其叶片氮、磷含量及氮/磷均符合正态分布。
2 结果与分析
2.1 黄土高原草本植物生物量沿纬度梯度的变化
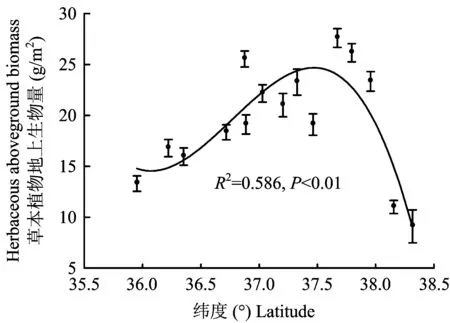
图2 草本植物生物量随纬度的变化规律Fig.2 Variation of the herbaceous biomass along the latitudinal gradient
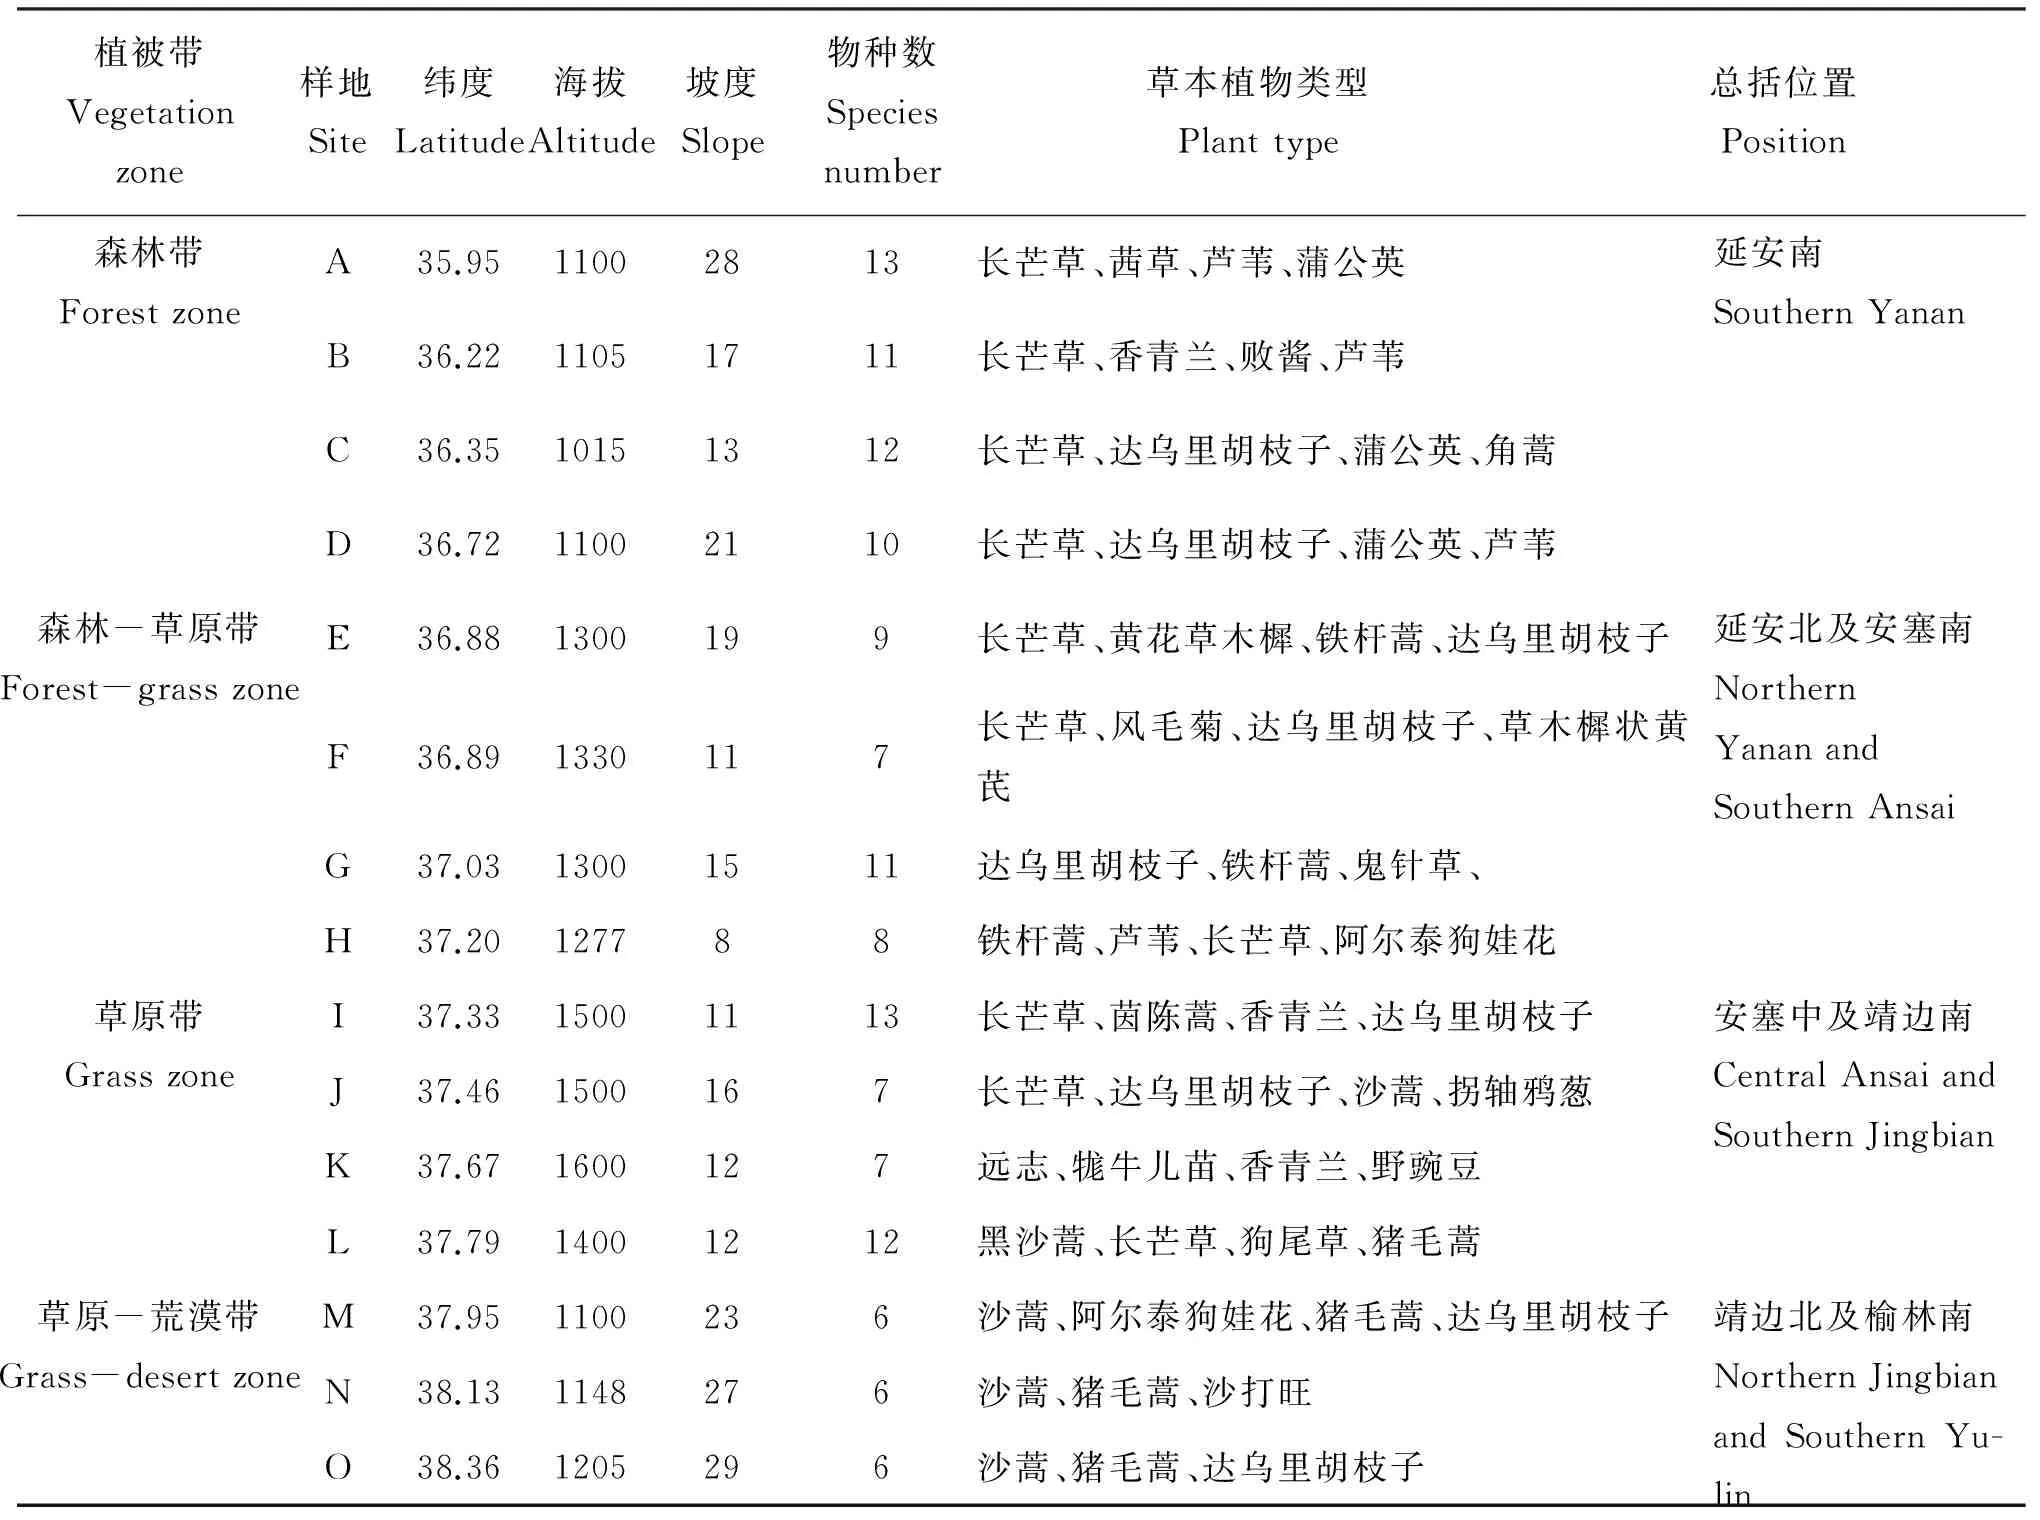
表1 采样点草本植物种类沿纬度梯度的分布状况
注(Note): 长芒草Stipabungeana, 茜草Rubiacordifolia, 芦苇Phragmitesaustralis, 蒲公英Taraxacummongolicum,香青兰Dracocephalummoldavica, 败酱Patriniascabiosaefolia, 达乌里胡枝子Lespedezadavurica, 角蒿Incarvilleasinensis, 黄花草木樨Melilotusofficinalis, 铁杆蒿Artemisiagmelinii, 风毛菊Saussureaamurensis, 草木樨状黄芪Astragalusmelilotoides, 鬼针草Bidenspilosa, 阿尔泰狗娃花Heteropappusaltaicus, 茵陈蒿Artemisiacapillary, 沙蒿Artemisiadesertorum, 拐轴鸦葱Scorzoneradivaricata, 远志Polygalatenuifolia, 牻牛儿苗Erodiumstephanianum, 野豌豆Viciasepium, 黑沙蒿Artemisiaordosica, 狗尾草Setariaviridis, 猪毛蒿Artemisiascoparia, 沙打旺Astragalusadsurgens.
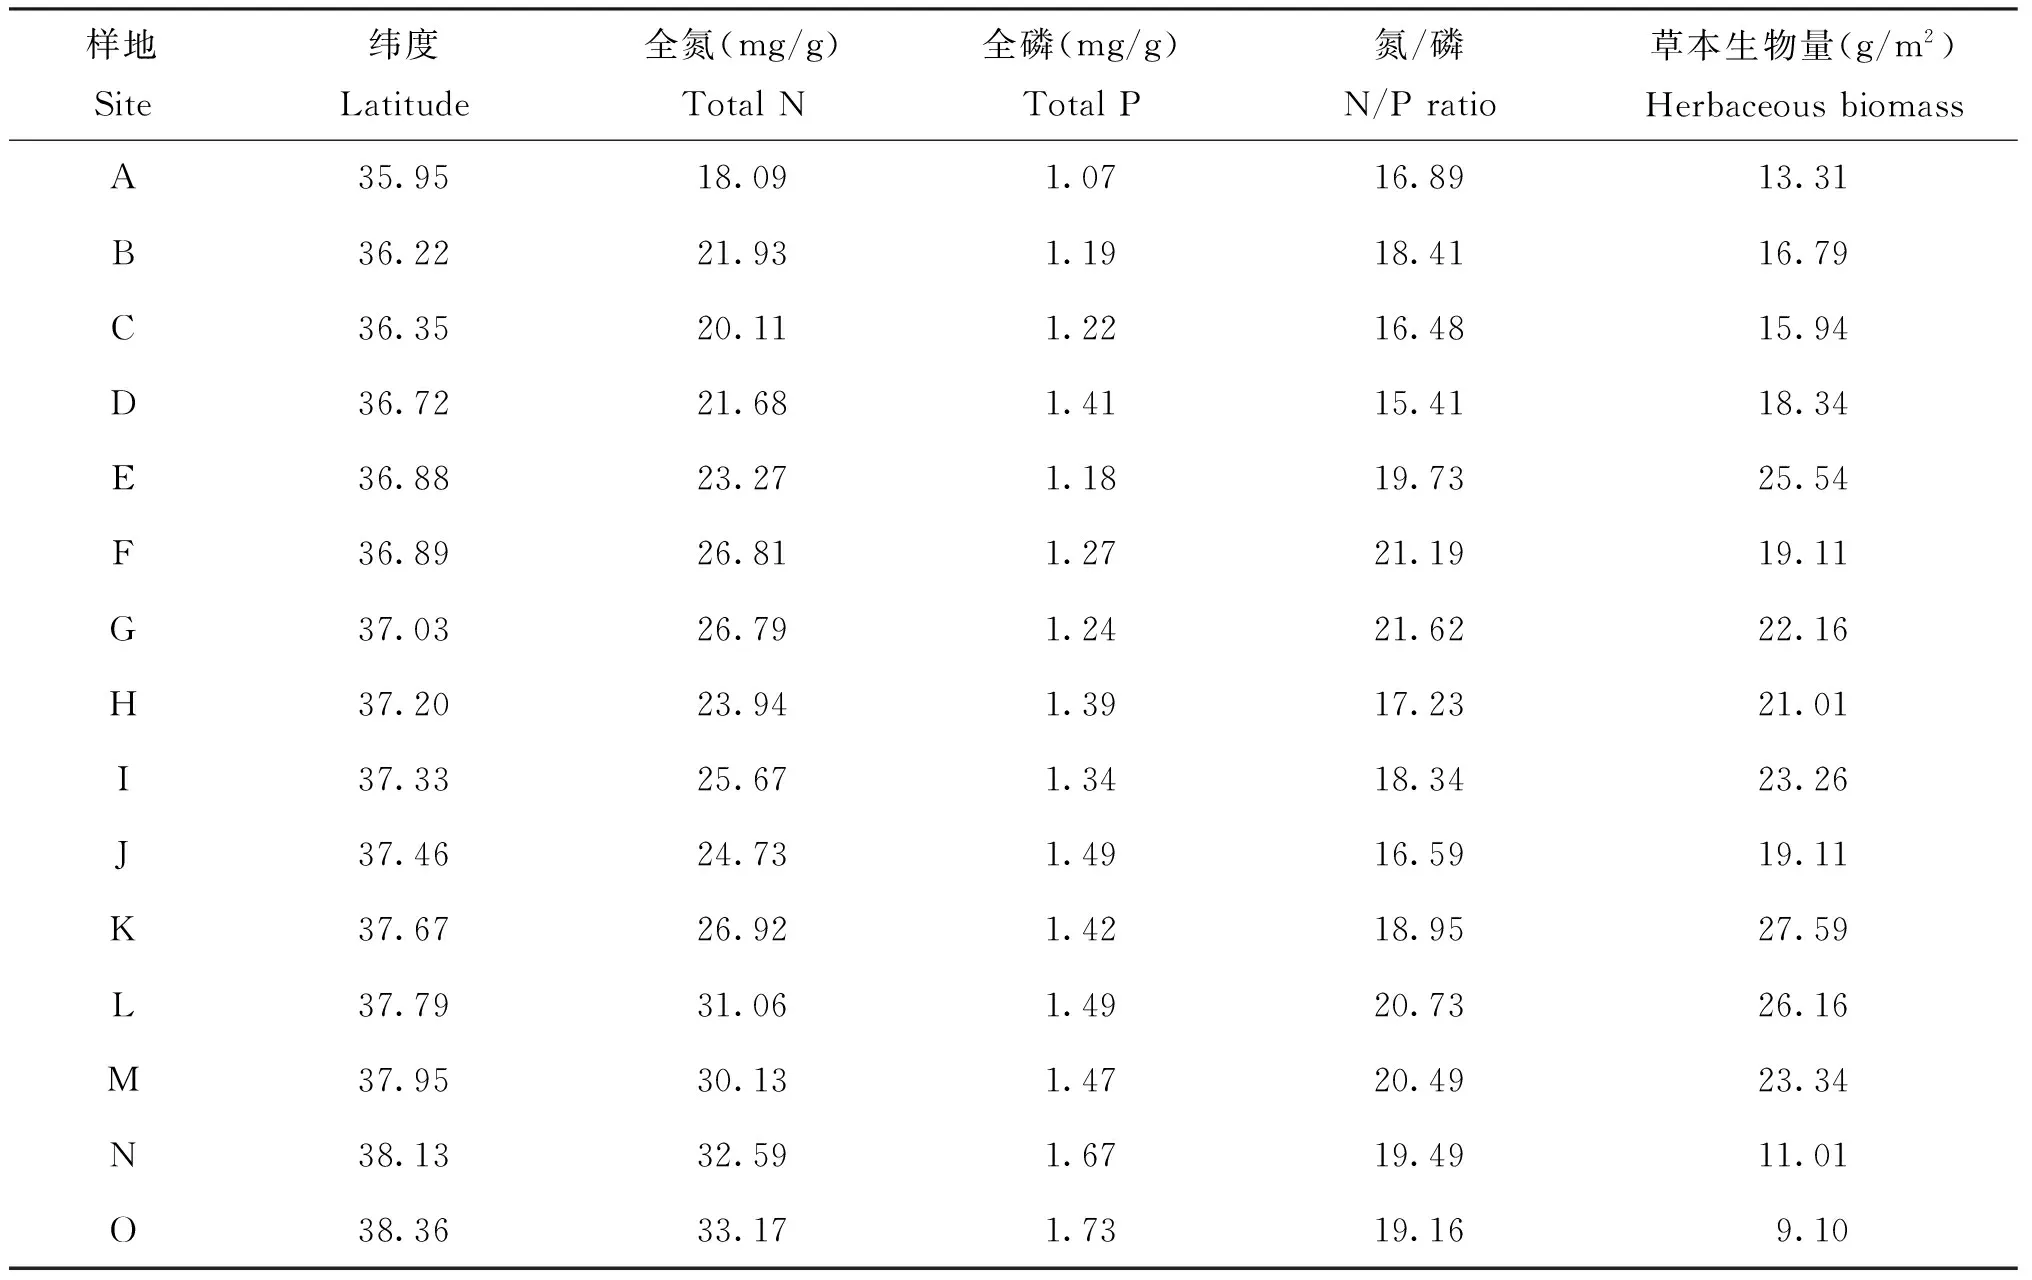
表2 草本植物生物量、叶片氮、磷含量及其氮/磷

表3 不同植被带草本植物生物量、叶片氮、磷及其氮/磷的方差分析
注(Note): 同列数据后不同字母表示不同植被带间差异达5%显著水平 Values followed by different letters in a column are significant among vegetation zones at the 5% level.
2.2 黄土高原草本植物叶片氮(N)、磷(P)化学计量学特征沿纬度梯度的变化
黄土高原不同纬度梯度下草本植物叶片氮、磷含量以及氮/磷存在很大的变异性。草本植物叶片氮含量从森林带的20.45 mg/g到草原-荒漠带的31.96 mg/g,变异系数为17.1%;叶片磷含量从森林带的1.22 mg/g到草原-荒漠带的1.62 mg/g,变异系数为13.9%;氮/磷的变化范围则是从森林带的16.90到森林-草原带的19.94,变异系数为9.94%;三者的平均值分别为氮含量25.79 mg/g、磷含量1.37 mg/g、 氮/磷 18.71。图3表明, 草本植物叶片氮、 磷含量与纬度之间存在显著的相关关系,且随着纬度的升高,叶片氮、磷含量也随之升高(R2=0.850、P<0.001,R2=0.845、P<0.001)。草本植物叶片氮/磷与纬度的关系并不显著(R2=0.085、P=0.723)。
2.3 黄土高原草本植物叶片氮(N)、磷(P)化学计量学特征
本文将黄土高原草本植物叶片氮、磷的化学计量学特征与其他研究结果进行了比较(表4),发现黄土高原草本植物叶片氮含量显著高于Reich等[17]在全球尺度上和Han等[20]在中国尺度上的平均水平,同时也高于郑淑霞等[23]在黄土高原上的研究结果(算术平均数为24.1 mg/g);而黄土高原草本植物叶片磷含量明显低于Reich等[17]在全球尺度上的研究结果,与Han等[20]在中国尺度上的研究结果差异不显著;黄土高原草本植物叶片氮/磷与Reich等[17]在全球尺度和Han等[20]在中国尺度上的研究结果均存在显著差异。
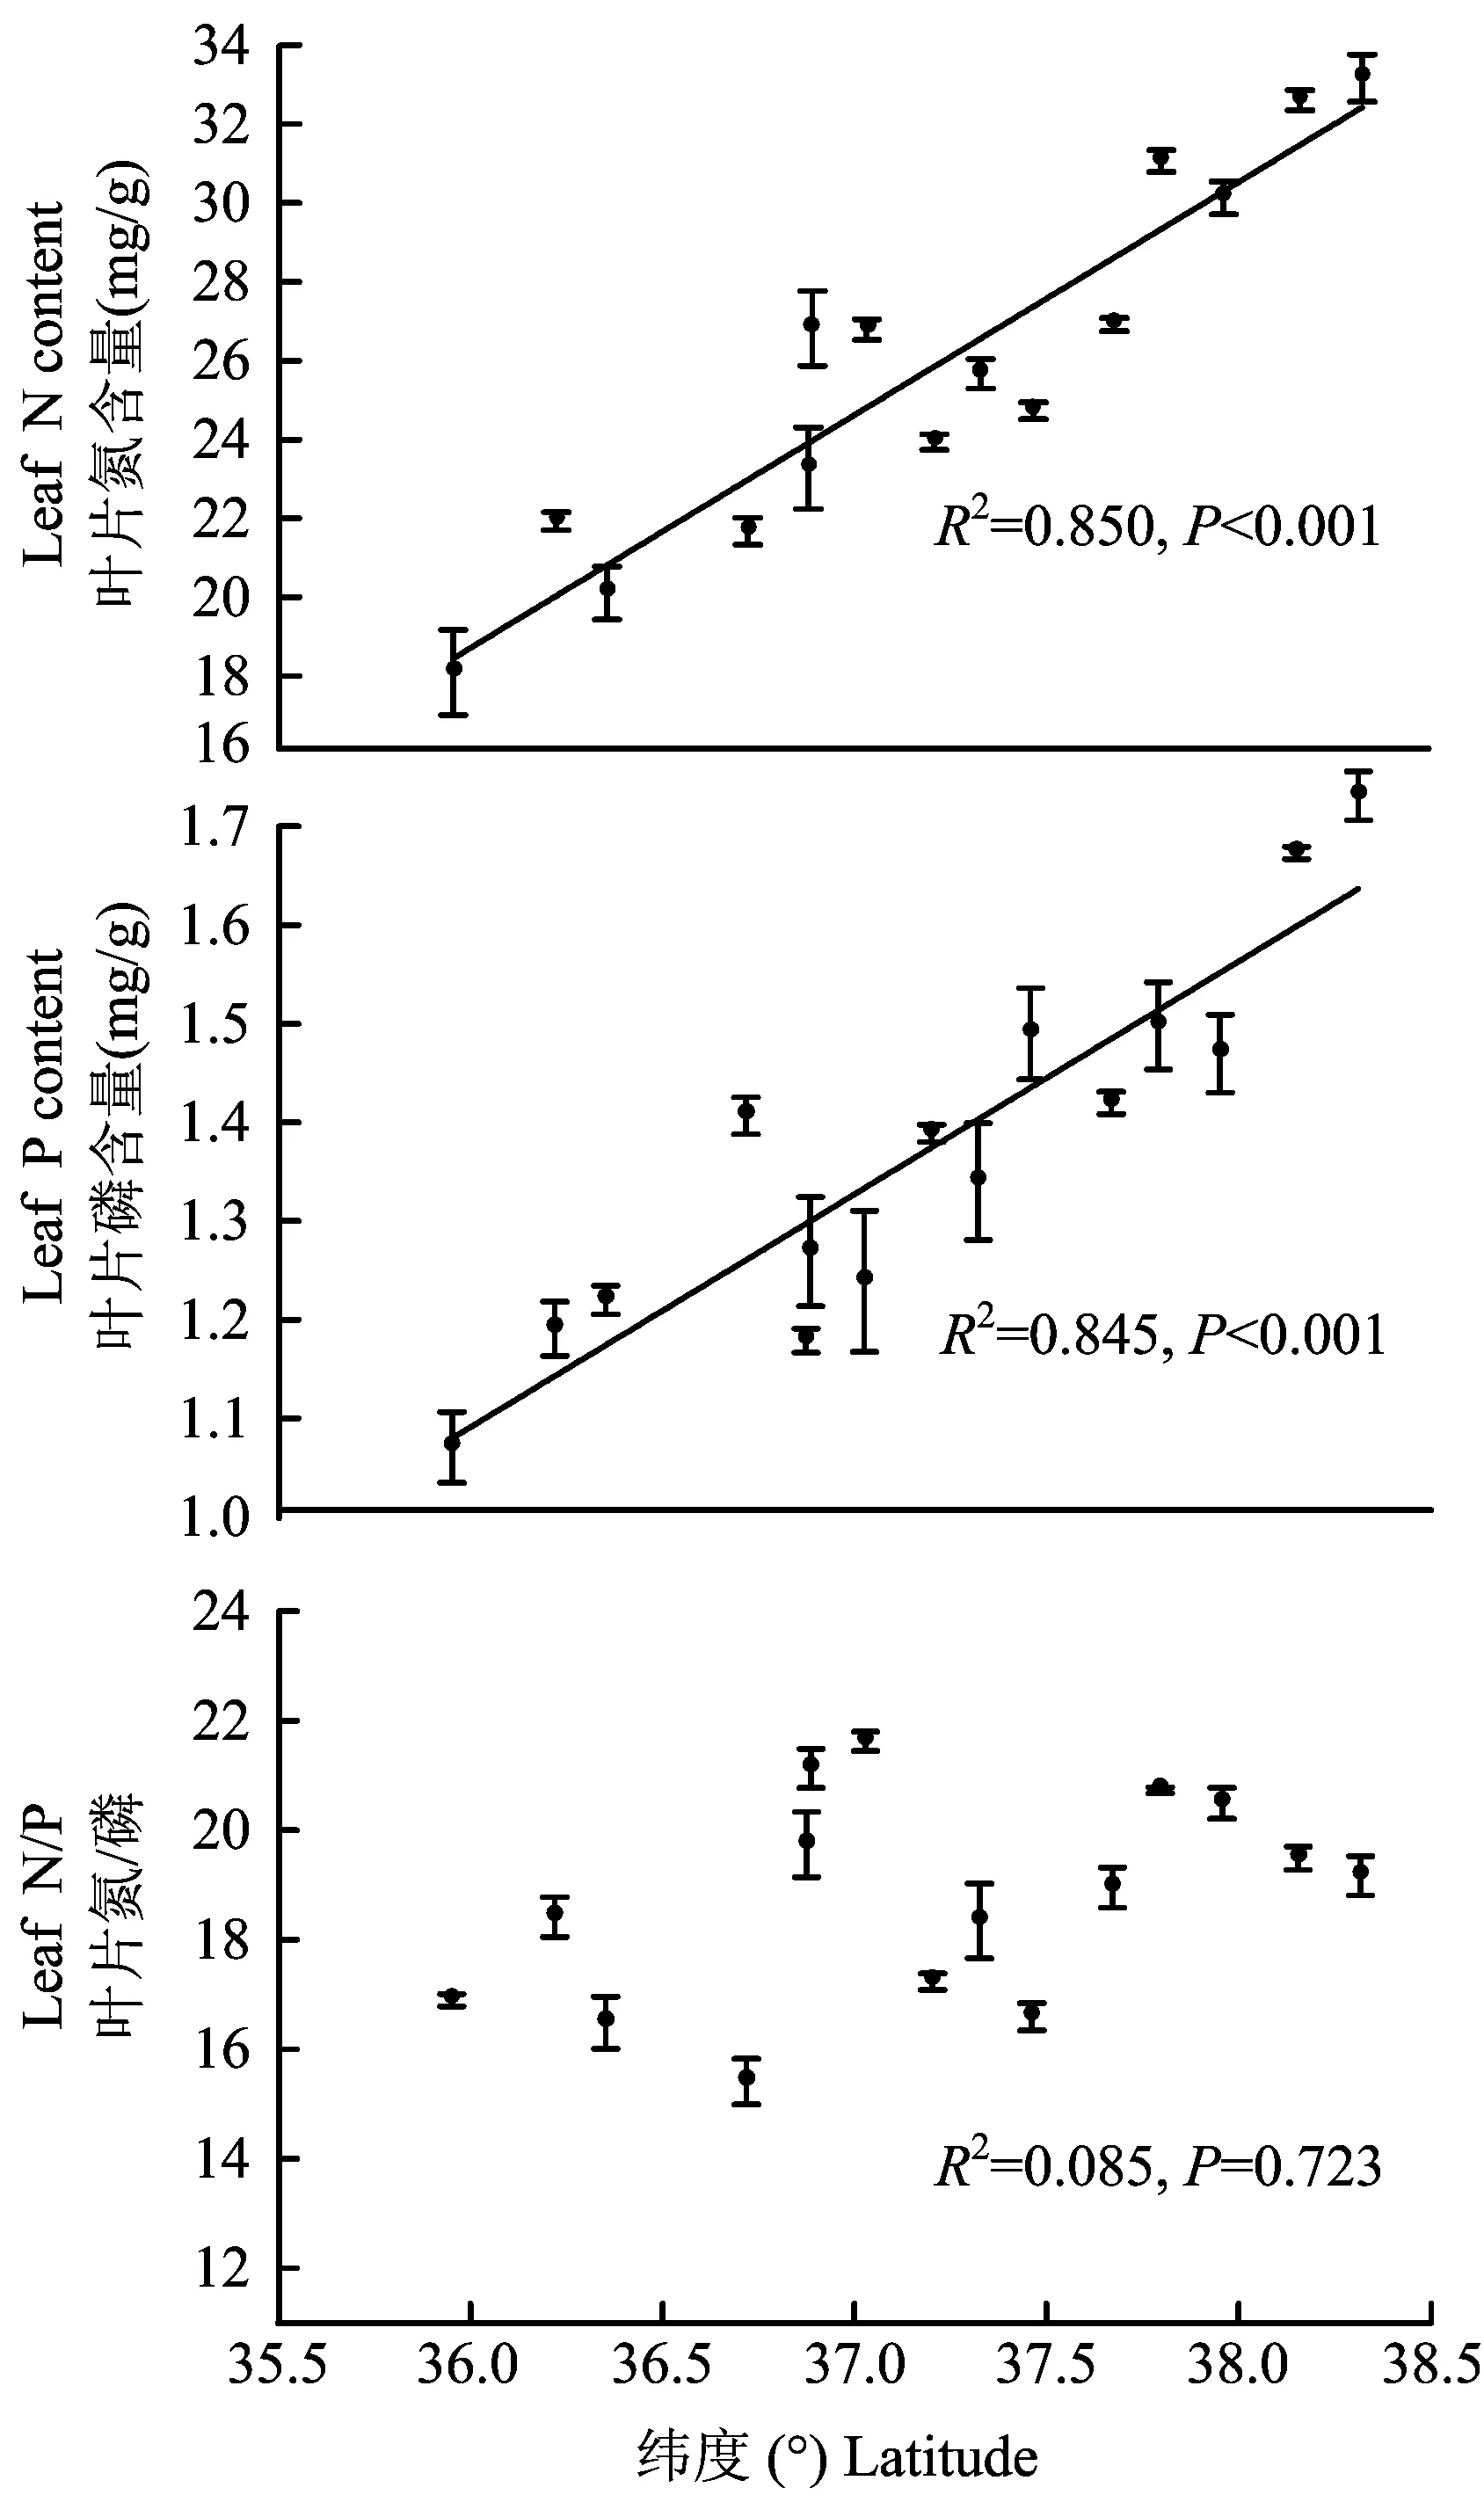
图3 草本植物叶片氮、磷含量及其氮/磷随纬度的变化规律Fig.3 Variations of the leaf N and P contents of herbaceous along the latitudinal gradient
3 讨论
3.1 黄土高原纬度梯度草本植物生物量变化规律

通常认为,环境因子的变化会直接或间接影响植物生物量的大小,且其对生物量的影响并不是由单一因素决定的,而是由更为复杂的多种因子共同作用的结果,例如太阳辐射、风、能量平衡等[28]。但通过本研究结果可以推测,纬度梯度上的水热因子是制约黄土高原生态系统中草本植物生物量的重要因素。

表4 不同研究区域草本植物叶片氮、磷及其氮/磷的比较
注(Note): 同列数据后不同字母表示不同研究区域间差异达5%显著水平 Values followed by different letters in a column are significant among different study areas at the 5% level.
3.2 黄土高原草本植物叶片氮(N)、磷(P)化学计量学特征
黄土高原草本植物叶片氮含量显著高于Reich等[17]的全球尺度和Han等[20]的中国尺度的平均水平,首先是与该地区的土壤养分和水热因子有关,植物一般吸收的都是可以直接利用的移动性很强的矿物氮(如硝态氮和铵态氮)[29],位于我国西北部的黄土高原是典型的温带气候,受土壤水热因子的影响氮的矿化率提高,从而提高了草本植物的氮含量[30];其次近年来大气氮沉降的不断增加,导致生态系统中有效氮增加[31-32],以至于一些原本受氮营养限制的植物,出现了“氮饱和现象”[28];其三是不同研究中选取的植物种类、样本数量及研究方法的差异可能会导致不同的研究结果。
黄土高原草本植物叶片磷含量明显低于Reich等[17]在全球尺度上的研究结果,与Han等[20]在中国尺度上的研究结果差异不显著。这说明与全球尺度的研究结果相比,黄土高原乃至中国植物叶片的磷含量都相对偏低。以往的研究证实[33-35],中国土壤磷含量低于全球平均水平(除南海诸岛以外),是导致中国植物叶片磷含量低于全球平均水平的主要原因。陈磊等[36]和胡宏祥等[37]在其研究中发现,土壤氮、磷等养分流失的形式是以流失土壤携带为主,不难看出黄土高原地区强烈的水土流失也是导致土壤中磷损失的主要原因。
生态系统中植物叶片氮含量显著高于磷含量,产生这种生理意义上的差异,一是植物的氮吸收率高于磷;二是植物组织中磷主要是以磷酸根离子或化合物的形式存在,极易流动、淋溶和损失[38-39]。氮/磷的临界值通常被作为描述氮和磷相对限制的一个指标[16,40-41],一般情况下,当氮/磷<14时,群落水平上的植物生长主要受氮的限制;当氮/磷>16时,植物生长主要受磷的限制;当氮/磷<16和>14时,则植物生长同时受氮、磷两者的限制或者均不缺少[42]。与全球尺度的研究结果相比,黄土高原以及中国区域植物相对较高的氮/磷和较低的磷含量均进一步说明了中国区域的草本植物生长受磷的限制较大。
3.3 纬度梯度下草本植物叶片氮(N)、磷(P)和氮/磷的变化规律

4 结论
黄土高原草本植物叶片氮含量相对较高,一是由于土壤水热因子的影响提高了氮的矿化率,二是大气氮沉降的增加,导致草本植物叶片氮含量的增加;叶片磷含量较低的主要原因是黄土高原土壤磷含量较低。黄土高原草本植物叶片氮、磷含量与纬度呈显著的正相关关系,即随着纬度的升高而增加。上述结果均体现了植物群落在长期的进化过程中对黄土高原生态系统的一种适应策略。
[1] 郝文芳, 陈存根, 梁宗锁, 马丽. 植被生物量的研究进展[J]. 西北农林科技大学学报(自然科学版), 2008, 36(2): 175-182. Hao W F, Chen C G, Liang Z S, Ma L. Research advances in vegetation biomass[J]. Journal of Northwest A&F University(Natural Science Edition), 2008, 36(2): 175-182.
[2] 郭娜, 刘剑秋. 植物生物量研究概述(综述)[J]. 亚热带植物科学, 2011, 40(2): 83-88. Guo N, Liu J Q. A review of research on plant biomass[J]. Subtropical Plant Science, 2011,40(2): 83-88.
[3] Elser J J, Dobberfuhl D R. Organism size, life history, and N:P stoichiometry[J]. Bioscience,1996, 46(9): 674-684.
[4] 曾德慧, 陈广生. 生态化学计量学: 复杂生命系统奥秘的探索[J]. 植物生态学报, 2005, 29(6): 1007-1019. Zeng D H, Chen,G S. Ecological stoichiometry: a science to explore the complexity of living systems[J]. Acta Phytoecological Sinica, 2005, 29(6): 1007-1019.
[5] Güsewell S. N/P ratios in terrestrial plants: variation and functional significance[J]. New Phytologist, 2005, 164(2): 243-266.
[6] Chapin F S, Matson P A, Mooney H A. Principles of terrestrial ecosystem ecology[M]. New York: Springer-Verlag New York, 2004.
[7] Vitousek P. Nutrient cycling and nutrient use efficiency[J]. The American Naturalist, 1982, 110(4): 553-572.
[8] 刘雯霞, 朱柯嘉. 青藏高原东缘高寒草甸不同功能群植物氮磷化学计量特征研究[J]. 中国草地学报, 2013, 35(2): 52-58. Liu W X, Zhu K J. Characteristics of nitrogen and phosphorus stoichiometry of plants in different functional groups on Alpine Meadow in the eastern edge of Tibetan Plateau[J]. Acta Agrectir Sinica, 2013, 35(2): 52-58.
[9] 刘兴诏, 周国逸, 张德强, 等. 南亚热带森林不同演替阶段植物与土壤中N、P的化学计量特征[J]. 植物生态学报, 2010,34(1): 64-71. Liu X Z, Zhou G Y, Zhang D Qetal. N and P stoichiometry of plant and soil in lower subtropical forest successional series in southern China[J]. Acta Phytoecological Sinica, 2010, 34(1): 64-71.
[10] Aerts R, Chapin F. The mineral nutrition of wild plants revisited: a re-evaluation of processes and patterns[J]. Advances in Ecological Researh, 1999, 30(2): 1-67.
[11] Wassen M J, Venterink H G M O, Swart E O A M. Nutrient concentrations in mire vegetation as a measure of nutrient limitation in mire ecosystems[J]. Journal of Vegetation Science,1995, 6(1): 5-16.
[12] He J, Fang J, Wang Zetal. Stoichiometry and large-scale patterns of leaf carbon and nitrogen in the grassland biomes of China[J]. Oecologia, 2006, 149(1): 115-122.
[13] Elser J, Fagan W, Denno Retal. Nutritional constraints in terrestrial and freshwater food webs[J]. Nature, 2000, 408(11): 578-580.
[14] Braakhekke W G, Hooftman D A P. The resource balance hypothesis of plant species diversity in grassland[J]. Journal of Vegetation Science, 1999, 10(2): 187-200.
[15] Reich P B, Ellsworth D S, Walters M B, Vose J M. Generality of leaf trait relationships: a test across six biomes[J]. Ecology, 1999, 80(6): 1955-1969.
[16] Thompson K, Parkinson J, Band S, Spencer R. A comparative study of leaf nutrient concentrations in a regional herbaceous flora[J]. New Phytologist, 1997, 136(4): 679-698.
[17] Reich P B, Oleksyn J. Global patterns of plant leaf N and P in relation to temperature and latitude[J]. Proceedings of the National Academy of Sciences, 2004, 101(30): 11001-11006.
[18] Wright I J, Reich P B, Cornelissen J H Cetal. Assessing the generality of global leaf trait relationships[J]. New Phytologist, 2005, 166(2): 485-496.
[19] Wright I J, Reich P B, Westoby Metal. The worldwide leaf economics spectrum[J]. Nature, 2004, 428(6985): 821-827.
[20] Han W, Fang J, Guo D, Zhang Y. Leaf nitrogen and phosphorus stoichiometry across 753 terrestrial plant species in China[J]. New Phytologist, 2005, 168(2): 377-385.
[21] 任书杰, 于贵瑞, 陶波, 王绍强. 中国东部南北样带654种植物叶片氮和磷的化学计量学特征研究[J]. 环境科学,2007, 28(12): 2665-2673. Ren S J, Yu G R, Tao B,Wang S Q. Leaf nitrogen and phosphorus stoichiometry across 654 terrestrial plant species in NSTEC[J]. Environmental Science. 2007, 28(12): 2665-2673.
[22] 鲍士旦. 土壤农化分析[M]. 北京: 中国农业出版社, 2000. Bao S D. Soil agrochemistry analysis[M].Beijing: China Agriculture Press, 2000.
[23] 郑淑霞, 上官周平. 黄土高原地区植物叶片养分组成的空间分布格局[J]. 自然科学进展, 2006, 16(8): 965-973. Zheng S X, Shangguan Z P. Spatial patterns for variations in leaf nutrient contents in Loess Plateau[J]. Progress in Natural Science, 2006, 16(8): 965-973.
[24] 白永飞, 李凌浩. 锡林河流域草原群落植物多样性和初级生产力沿水热梯度变化的样带研究[J]. 植物生态学报, 2000, 24(6): 667-673. Bai Y F, Li L H. Changes in plant species diversity and productivity along gradients of precipitation and elevation in the Xilin river basin Inner Mongolia[J]. Acta Phytoecological Sinica, 2000, 6(24): 667-673.
[25] 白永飞, 张丽霞, 张焱, 陈佐忠. 内蒙古锡林河流域草原植物群落功能群植物组成沿水热梯度变化的样带研究[J]. 植物生态学报, 2002, 26(3): 308-316. Bai Y F, Zhang L X, Zhang Y, Chen Z Z. Changes in plant functional composition along gradients of precipitation and temperature in the Xilin river basin Inner Mongolia[J]. Acta Phytoecological Sinica, 2002, 26(3): 308-316.
[26] 邓蕾, 上官周平. 陕西省天然草地生物量空间分布格局及其影响因素[J]. 草地学报, 2012,20(5): 825-835. Deng L, Shangguan Z P. Distribution of natural grassland biomass and its relationship with influencing factors in Shaanxi[J]. Acta Agrectir Sinica, 2012, 20(5): 825-835.
[27] 韩彬, 樊江文, 钟华平. 内蒙古草地样带植物群落生物量的梯度研究[J]. 植物生态学报, 2006, 30(4): 553-562. Han B, Fan J W, Zhong H P. Grassland biomass of communities along gradients of the Inner Mongolia grassland transect[J]. Acta Phytoecological Sinica, 2006, 30(4): 553-562.
[28] 罗天祥, 石培礼, 罗辑, 欧阳华. 青藏高原植被样带地上部分生物量的分布格局[J]. 植物生态学报, 2002, 26(6): 668-676. Luo T X, Shi P L, Lu J,OUY H. Distribution patterns of aboveground biomass in Tibetan Alpine vegetation transects[J]. Acta Phytoecologica Sinica,2002, 26(6): 668-676.
[29] 王辉, 王全九, 邵明安. 降水条件下黄土坡地氮素淋溶特征的研究[J]. 水土保持学报, 2005,19(5): 61-64, 93. Wang H, Wang Q J, Shao M A. Characteristics of nitrogen leaching from sloping land on Loess Plateau under rainfall conditions[J]. Journal of Soil and Water Conservation, 2005,19(5): 61-64, 93.
[30] Van Heerwaarden L, Toet S, Aerts R. Nitrogen and phosphorus resorption efficiency and proficiency in six sub-arctic bog species after 4 years of nitrogen fertilization[J]. Journal of Ecology, 2003, 91(6): 1060-1070.
[31] Kaiser J. The other global pollutant: Nitrogen proves tough to curb[J]. Science, 2001, 294(5545): 1268.
[32] Galloway J N, Townsend A R, Erisman J W. Transformation of the nitrogen cycle: recent trends, questions, and potential solutions[J]. Science. 2008, 320(5878): 889-892.
[33] Hedin L O. Global organization of terrestrial plant-nutrient interactions[J]. Proceedings of the National Academy of Sciences, 2004, 101(30): 10849-10850.
[34] 全国土壤普查办公室编. 中国土种志[M]. 北京: 中国农业出版社, 1993. 924. National Soil Survey Office. China soil species[M].Beijing: China Agriculture Press, 1993. 924.
[35] Zhang C, Tian H, Liu J Y, Wang S. Pools and distributions of soil phosphorus in China[J]. Global Biogeochemical Cycles, 2005, 19(1): 1029-1035.
[36] 陈磊, 李鹏, 李占斌, 等. 黄土高原人为加速侵蚀下水土与养分流失耦合研究[J]. 水土保持学报, 2011, 25(3): 7-11. Chen L, Li P, Li Z Betal. Study on the coupling effect of erosion and nutrient lost under manmade accelerated erosion on Loess Plateau[J]. Journal of Soil and Water Conservation, 2011, 25(3): 7-11.
[37] 胡宏祥, 洪天求, 刘路. 水土流失量和养分流失量的预测[J]. 环境科学研究, 2009, 22(3): 356-361. Hu H X, Hong T Q, Liu L. Prediction of soil erosion and nutrient loss quantity[J]. Research of Environmental Sciences, 2009, 22(3): 356-361.
[38] 杨继松, 刘景双, 于君宝. 三江平原沼泽湿地枯落物分解及其营养动态[J]. 生态学报, 2006, 26(5): 1298-1301. Yang J S, Liu J S, Yu J B. Decomposition and nutrient dynamics of marsh litter in the Sanjiang Plain,China[J]. Acta Ecologica Sinica, 2006, 26(5): 1298-1301.
[39] 温达志, 魏平, 张佑昌. 鼎湖山南亚热带森林细根分解干物质损失和元素动态[J]. 生态学杂志, 1998, 17(2): 1-6. Wen D Z, Wei P, Zhang Y C. Dry mass loss and chemical changes of the decomposed fine roots in three China south subtropical forests at Dinghushan[J]. Chinese Journal of Ecology,1998, 17(2): 1-6.
[40] Niklas K J, Owens T, Reich P B, Cobb E D. Nitrogen/phosphorus leaf stoichiometry and the scaling of plant growth[J]. Ecology Letters, 2005, 8(6): 636-642.
[41] Koerselman W, Meuleman A F M. The vegetation N/P ratio: a new tool to detect the nature of nutrient limitation[J]. The Journal of Applied Ecology, 1996,33(6): 1441-1450.
[42] Tessier J T, Raynal D J. Use of nitrogen to phosphorus ratios in plant tissue as an indicator of nutrient limitation and nitrogen saturation[J]. Journal of Applied Ecology, 2003, 40(3): 523-534.
Latitude gradient changes on herbaceous biomass and leaf N and P stoichiometry characteristics in Loess Plateau
LI Ting1, DENG Qiang2, YUAN Zhi-you1,3, JIAO Feng1,3*
(1CollegeofNaturalResourcesandEnvironment,NorthwestA&FUniversity,Yangling,Shaanxi712100,China;2InstituteofSoilandWaterConservation,ChineseAcademyofSciences,Yangling,Shaanxi712100,China;3InstituteofSoilandWaterConservation,NorthwestA&FUniversity,Yangling,Shaanxi712100,China)
【Objectives】 Plant biomass can give an index to the trends of plant growth conditions and the change of natural environment, stoichiometry can reflect the plant nutrient content and using strategy. Our objective was to examine changes of herbaceous biomass and leaf N and P stoichiometry characteristics along latitudinal gradient in Loess Plateau, and to provide references for the prediction of plant growth and development prospect in Loess Plateau, soil nutrient status of the ecosystem and constraints of plant nutrition elements. 【Methods】 We investigated the herbaceous biomass and leaf N and P contents, and compared the herbaceous biomass amounts of different vegetation zones along the latitudinal gradient in Loess Plateau in Shanxi Province, including Fu County, Ganquan County, Ansai County, Jingbian County and Hengshan County and Yuyang District. One-way analysis and regression analysis were conducted to find main constraints of plant nutrition elements and to examine overall patterns of response of the herbaceous biomass, leaf N and P stoichiometry to latitude. 【Results】 Across the 35.95°-38.36°N latitude gradient, the range of herbaceous biomass amounts of different vegetation zones in Loess Plateau is from 9.10 to 27.59 g/m2, and the arithmetic mean is 19.45 g/m2and the coefficient of variation is 30.3%. The herbaceous biomass amounts in the four different vegetation zones are in order of grass zone >forest-grass zone >forest zone >grass-desert zone, and with the increase of latitude, the herbaceous biomass amounts are first increased and then decreased. The leaf N and P stoichiometry characteristics are primarily from 18.08 to 33.17 mg/g for N, from 1.07 to 1.7 mg/g for P and from 15.4-21.6 for the N/P ratio, the arithmetic means are 25.79 mg/g, 1.37 mg/g and 18.71, separately, and the variation coefficients are 17.1%, 13.9% and 9.94% in which the leaf N content is the greatest and the N/P ratio is the lowest. The leaf N and P are closely correlated, and leaf N and P significantly increases with latitude increasing, but the N/P ratios is not. The leaf N content in Loess Plateau is higher than the global average level and the leaf P content in Loess Plateau is lower than the global average level, consequently leading to a higher N/P ratio in Loess Plateau. 【Conclusions】 There is a certain correlation between the herbaceous biomass and latitude, however, that is not a simple linear correlation, and the change of herbaceous biomass is also related with species composition of the vegetation zones. There are obvious correlations between leaf N and P and latitude, while the relationship between the N/P ratio and latitude is not significant. These results demonstrate that the plants are under P limitation in Loess Plateau.
Loess Plateau;herbaceous biomass;latitude gradient;leaf N and P stoichiometry characteristics
2014-07-22 接受日期: 2014-10-30 网络出版日期: 2015-02-12
国家自然科学基金(41271043,31370455);中国科学院知识创新工程“百人计划”项目;中国科学院知识创新重要方向项目(KZCX2-EW-406)资助。
李婷(1988—), 女,山东烟台人,硕士研究生,主要从事植物生态学研究。E-mail: lovelyday0320@163.com * 通信作者 E-mail: Jiaof@ms.iswc.ac.cn
Q948.1
A
1008-505X(2015)03-0743-09

