Insect community structures along elevation gradients on Mt.Seongak-san,South Korea
•••••••••
ORIGINAL PAPER
Insect community structures along elevation gradients on Mt.Seongak-san,South Korea
Young-Min Shin1•Il-Kwon Kim1•Jong-Woo Nam1•Da-Som Kim2•Seung Jin Roh2•Jun Hyoung Jeon2•Jong Kyun Park3•Dong-Pyeo Lyu4•Bong-Woo Lee1•Bong-Kyu Byun2
©Northeast Forestry University and Springer-Verlag Berlin Heidelberg 2015
Insect communities along three elevation gradients on Mt.Seongak-san,South Korea,were investigated from May to September 2013 using traps in order to collect basic data for distributional monitoring of species in a forest ecosystem.A total of 2698 individuals of 309 moth species of 18 families were collected in bucket-light traps, along with 196 individuals of 26 ground-beetle species and 11,276 individuals of 14 ant species in pit-fall traps.The insect community at each site was analyzed using analysis of variance and non-metric multidimensional scaling (NMS).The ground-beetle and ant abundances varied with elevation.The NMS showed distinct clusters of moths between the ground-beetle and ant distributions with elevation and month.The community-level responses of these insect groups to those gradients were analyzed.
Insect community⋅Elevation⋅ANOVA⋅Bucket-light trap⋅Pit-fall trap⋅South Korea
Introduction
Many insect species are broadly distributed along elevation gradients.The populations living at the upper and lower elevation extremes experience different environmental conditions,especially with respect to local climate(Hodkinson 2005).Comparative studies of species ecology along elevation or latitude transects or gradients might provide clues to the likely responses both of populations and communities to climate change(Colwell et al.2004). Insect responses to elevation gradients have been quite thoroughly investigated(Hodkinson 2005).Many of those studies show that elevation affects species richness, diversity and community structure(Huston 1994;Escobar et al.2005).Research in Peru showed that the number of carabid species decreased with each 100 m increase in elevation(Maveety et al.2011).Also,on Mt.Kinabalu, Borneo,the average elevation of the community of the montane Geometridae increased by a mean of 67 m over the course of 42 years(Chen et al.2008).
The present study undertook to enumerate and evaluate certain insect communities along elevation gradients as part of a long-term research project on the impacts of climate change on climate-sensitive forest species.Once long-termdata sets have been accumulated,the results of this and subsequent studies will be used to analyze how insect communities respond to climate change in South Korea.
Materials and methods
Survey sites
The study sites are located on Mt.Seongak-san(35°39′N, 127°27′N,1142 m),Jeollabuk-do province,South Korea. Three sampling sites were chosen at 300 m(N35°40′3.90′′, E127°26′4.53′′),600 m(N35°39′4.56′′,E127°26′1.44′′) and 900 m(N35°41′1.51′′,E127°24′5.14′′)on the mountain(Fig.1).The sites’main vegetation was Quercus spp., with understory vegetation consisting mainly of Sasa and Acer spp.
Collection of major insect groups
Insects were collected three times,once each in May,July, and September of 2013,and each collection period lasted 3 days.Two types of traps were used:bucket-light traps for moths and pit-fall traps for ground-beetles and ants.The bucket-light traps,one of which was installed at each site, were set to operate from 8:00 h PM to 2:00 h AM for quantitative collecting.Three sets of pit-fall traps were positioned at each site;each set consisted of nine traps distributed in a 4 m×4 m square grid.In total,three bucket-light traps and 81 pit-fall traps were installed (Fig.2).Additionally,at each sampling site,a data logger (HOBO Pro V2)was installed to record temperature and relative humidity during the collection periods.
Classif i cation and identif i cation
All of the specimens were classif i ed and identif i ed according to their external morphological characteristics for each taxon.Where external morphology was not def i nitive, specimens were dissected and examined under a stereoscopic microscopy(Nikon SMZ800).All the examined material in this study was deposited at the Systematic Entomology Laboratory,Hannam University(SELHNU).

Fig.1 Locations of study sites at 300,600,and 900 m elevations on Mt.Seongak-san,South Korea

Fig.2 Installations of traps at study sites on Mt.Seongak-san,South Korea,in 2013(red squares pit-fall trap sets;yellow squares bucketlight traps)
Statistical analyses
We evaluated the responses of individual taxa and groups to elevation using analysis of variance(ANOVA)with a split plot approach.The ANOVA was employed to test for differences in mean abundance and mean species richness; meanwhile,the Duncan procedure was utilized to compare treatment means.In all of the analyses,the level of signif i cance was P<0.05(SAS 1982).Ordination analyses of pooled data were performed using PC-ORD version 5.17 (McCune and Mefford 1999;McCune and Grace 2002). Non-metric multidimensional scaling(NMS)(Kruskal 1964;Clarke 1993)was applied to determine the number of factors structuring the ground-beetle,ant and moth communities and to qualitatively summarize the overall species distributions across the elevation gradients.
Results
Moths
The result of the bucket-light trap collecting was as follows: 2698 individuals of 309 species of moths(Appendix S1,see Supplemental Data with online version of this article).
According to the elevation increase,857 individuals of 141 species of 12 families were collected at the 300-m elevation,among which Noctuidae was dominant:Noctuidae accounted for55 species,Geometridae 43 species,Pyralidae 18 species,and so on.Atthe 600-m elevation,a totalof1120 individuals of 186 species of 13 families were collected, among which Noctuidae,numbering 58 species,and Geometridae,55 species,were once again dominant.At the 900-m elevation,a total of 721 individuals of 138 species of 16 families were collected,among which Geometridae numbered 47 species and 40 species for Noctuidae.
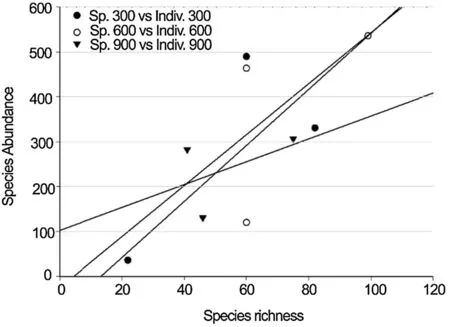
With respect to species richness,the 600 m elevation, where 60 species were collected in May and 99 in July, ranked highest.In September,60 species were collected at both 300 and 600 m.Overall,the 600 m elevation,in addition to species richness,also showed the highest species diversity and largest number of individuals,1120.This elevation,therefore,is expected to be the most meaningful for monitoring(Fig.3).
Ground-beetles
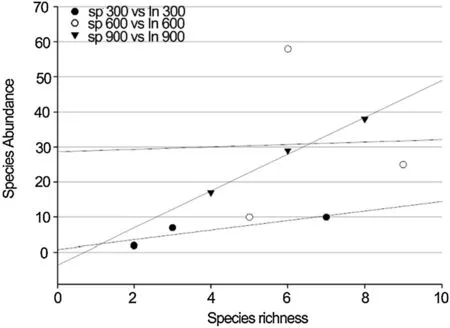
In total,196 individuals of 26 species of ground-beetles were collected with the pit-fall trap,including the most abundant,Carabidae(Appendix S2,see Supplemental Data with online version of this article).Regarding the monthly collection,34 individuals of 11 species were collected in May.Among them,Carabidae once again accounted for the largest number(29 individuals).In July,65 individuals of 13 species were collected,including 60 Carabidae individuals.Finally,97 individuals of 14 species were collected in September,including 91 Carabidae individuals.In terms of the altitudinal increase,19 individuals of 12 species were collected at 300 m,93 individuals of 14 species at 600 m,and 84 individuals of 12 species at 900 m (Fig.4).

Fig.3 Number of moth species with individuals for each elevation and month on Mt.Seongak-san,South Korea

Fig.4 Number of ground-beetle species with individuals for each elevation and month on Mt.Seongak-san,South Korea
Ants
Additionally,11,276 individuals of 14 species of ants were collected with pit-fall traps in 2013(Appendix S3,see Supplemental Data with online version of this article). Among them,3673 individuals of eight species were collected in May,4012 of 11 in July and 3591 of seven in September(Fig.5).

Fig.5 Number of ant species with individuals for each elevation and month on Mt.Seongak-san,South Korea
Dominant species
Among the moths investigated in this study,24 individuals ofHydrillodesmorose(Noctuidae)were collected in May,69 ofHerminiaarenosa(Noctuidae)in July,and 439 ofPareclipsis gracilis(Geometridae)in September,which were the dominant species for each of these survey periods.The dominant species foreach elevation were as follows:300 m:P.gracilis(Geometridae),264 individuals;600 m:P.gracilis,182; 900 m:Nordstromia japonica(Drepanidae),199.P.gracilis,demonstrating its impact on the species diversity of the study areas,wasrecorded asthe main dominantspecieswith respect notonly to altitudinalincrease butalso survey period.Species diversity formothswashighestat600 m,which elevation can be considered to be most relevant for future investigations.
As for the ground-beetles,the results showed thatAulonocarabus seishinensis seishinensis(Carabidae),with 61 individuals,wasthe dominantspecies.By month,Eucarabussternbergi sternbergi(Carabidae)wasthedominantspeciesboth in May(16 individuals)and July(16 individuals).In September,A.seishinensis seishinensis,with 42 individuals,was the dominant species.Additionally,by elevation,Synuchusmelantho(Carabidae) was the dominant species at the 300 m elevation site,showing four individuals.At the 600 m elevation site,A.seishinensis seishinensiswas the dominantspecies,with 40 individuals.And at the 900 m elevation site on Mt.Seongak-san,E.sternbergi sternbergiwas the dominant species,with 34 individuals.
As concerned the ants,Pheidole fervida(Formicidae)was the dominantspeciesforboth month and altitudinalincrease.A totalof7074P.fervidaindividualswerecollected in thisstudy.
Statistical analyses
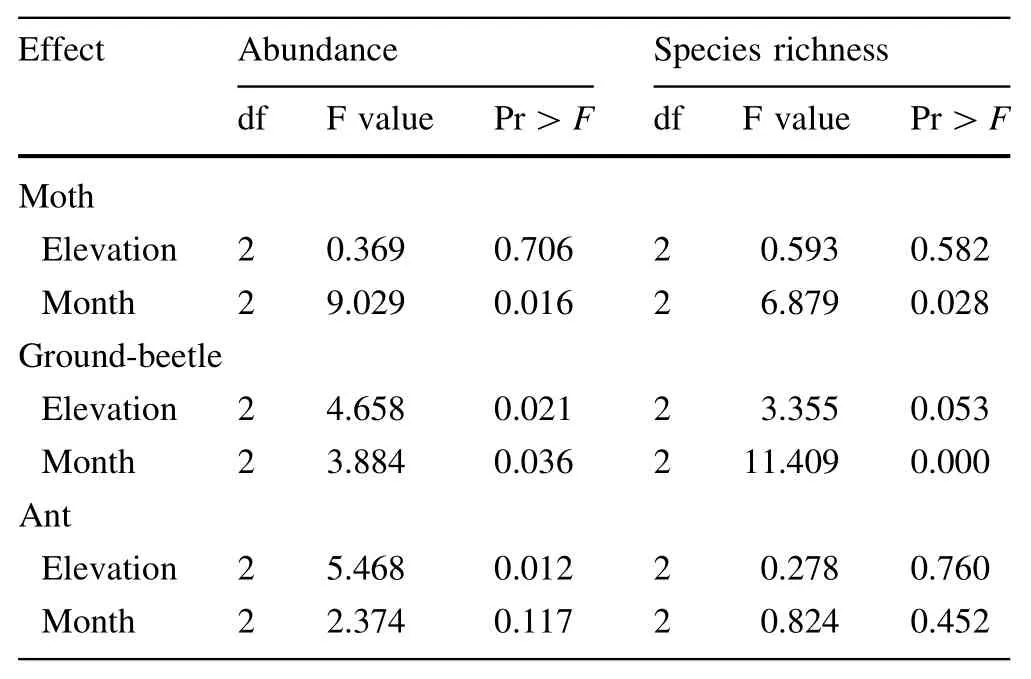
The Table 1 data indicates that the moths’,ground-beetles’and ants’abundance and species richness were affected by elevation and month.To compare those altitudinal and monthly effects,the data were analyzed by ANOVA with the post hoc Duncan test(pair wise test,N=3).In the moth results,month was signif i cantly correlated with variation of both abundance and species richness,though elevation was not.In the ground-beetle results,month was signif i cantly correlated with both abundance and species richness,but elevation was signif i cantly correlated only with abundance.In the ant results,the only signif i cant correlation was between elevation and abundance;there were no correlations between elevation and species richness or between month and abundance or month and species richness.

Table 1 Variation in occurrence(abundance and species richness)of moths,ground-beetles and ants by month and elevation on Mt. Seongak-san,South Korea in 2013
An analysis of the moth,ground-beetle and ant samples using NMS with two variables showed that those community structures respond to both elevation and month (Fig.6).Each plot showed distinct point clouds for elevation(300,600,and 900 m)and month(May,July and September).In the moth results,axis 2 explained 92%of the population,and axis 3 75%,by variable.Each plot was signif i cantly different for each elevation and month, in that there was not too much overlap between them.In the ground-beetle results,axis 1 explained 54%of the population,and axis 2 82%,by variable.And again,each plot,showing little overlap with the other,was signif icantly different for each elevation and month.In the ant results,axis 1 explained 68%of the population,and axis 2 96%,by variable.Each plot showed signif i cant difference by elevation,but not by month.Additionally, MRPP analysis by Sorensen distance measure was utilized to investigate the statistical analyses of the moth, ground-beetle and ant communities.The moth month values were clearly classif i ed(chance-corrected withingroup agreement;A=0.1519,P<0.001),but the elevation values had no mean(A=-0.0632P>0.05).Theground-beetle elevation values(A=0.1864,P<0.001) and month values(A=0.1011,P<0.001)were both clearly classif i ed.And as for the ant results,the elevation values were clearly classif i ed(A=0.1765,P<0.001), though the month values had no mean(A=0.0144,P>0.05).

Fig.6 Non-metric multidimensional scaling(NMS)with moth[a, b f i nal stress:0.44412,f i nal instability:0.00000,iteration:83)], ground-beetle[c,d f i nal stress:10.39124,f i nal instability:0.00000, iteration:68]and ant community data[e,f f i nal stress:17.304,f i nal instability:0.00003,iteration:79]by elevation and month on Mt. Seongak-san in 2013
Discussion
Based on the survey,we could determine the approximate occurrence patterns of the moth,ground-beetle and ant communities,as well as the fact that the insect species actually differed by height and month.
Moth,ground-beetle and ant,subjectsare relevantto forest studies,as they are known internationally as indicators of the ecosystem state(Rykken et al.1997;Isarin and Bohncke 1999;Harrison 2010).In our study,changes in species composition and abundance in correlation with altitudinalincrease were not clearly observed.However,the NMS results did,in fact,indicate species composition changes with elevation.
It is well established that the species compositions of insect communities change with elevation.Yet,according to the community studied and its specif i c location,species richness and abundance might peak at the highest,lowest or middle elevation or display no trend(Hodkinson 2005).
Summervile and Crist(2003)suggested the adoption of a small number of species that correspond to changes,rather than a total community analysis,as an indicator,because in trend analysis of forest ecosystems,community change is not directly correspondent with environmental change.That is why it is necessary to select taxa that are sensitive to environmental changes.However,development of environmental sensitivity indices based on species’ecological requirements,in South Korea,remains diff i cult.Therefore, it is effective to investigate the dominant species by month or the occurrence pattern of multivoltine species using the simplestindicator.Itisexpected thatthe presentresults,thus obtained,can be used as basic information for additional research that will be conducted to reveal the ecological causes of community size change by environmental factors implicated in climate change.Itisanticipated that long-term investigations of this type will accurately detect species composition change resulting from environmental change.
在氯化浸金试验中,浸出时间越长反应越充分,但是会增加能耗。为了确定最佳的浸出时间,本文采用单因子变量原则,考察了不同时间下金的浸出率。浸出时间(h):1、2、3、4;温度:85℃;氯化钠:1.0 mol/L;氯酸钠:16 g/L;稀硫酸:3.0 mol/L;矿浆浓度:25%。不同浸出时间下试验结果如图10所示。
AcknowledgmentsThe present study was supported by‘Study on impacts of the climate changes on climate-sensitive insects in forests’’(Project No.KNA-1-2-11,11-3)of Korea National Arboretum.
Chen IC,Shiu HJ,Benedick S,Holloway JD,Chey VK,Barlow HS, Hill JK,Thomas CD(2008)Elevation increases in mote assemblages over 42 years on a tropical mountain.PNAS 106:1479–1483
Clarke KR(1993)Non-parametric multivariate analyses of changes in community structure.Aust J Ecol 18:117–143
Colwell RK,Rahbek C,Gotelli NJ(2004)The mid-domain effect and species richness patterns what have we learned so far.Am Nat 163(3):E1–E23
Escobar F,Lobo JM,Halffter G(2005)Altitudinal variation of dung beetle(Scarabaeidae:Scarabaeinae)assemblages in the Colombian Andes.Glob Ecol Biogeogr 14:327–337
Harrison SP(2010)Impacts of future climate change on selected indicator species from protected areas in Jordan.Royal Society for the Conservation of Nature,Amman,p 15
Hodkinson ID(2005)Terrestrial insects along elevation gradients: species and community responses to altitude.Biol Rev 80(3):489–513
Huston MA(1994)Biological diversity.The coexistence of species in changing landscapes.Cambridge University Press,Cambridge, p 685
Isarin RF,Bohncke SJ(1999)Mean July temperatures during the Younger Dryas in northwestern and central Europe as inferred from climate indicator plant species.Quat Res 51(2):158–173
Kruskal JB(1964)Nonmetric multidimensional scaling:a numerical method.Psychometrika 29:115–129
Maveety SA,Browne RA,Erwin TL(2011)Carabidae diversity along an altitudinal gradient in a Peruvian cloud forest(Coleoptera). Zookeys 147:651–666
McCune B,Grace JB(2002)Analysis of ecological communities. MjM Software Design,Gleneden Beach
McCune B,Mefford MJ(1999)PC-ORD.Multivariate analysis of ecological data,vol Version 4.0.MjM Software Design, Gleneden Beach
Rykken JJ,Capen DE,Mahabir SP(1997)Ground beetles as indicators of land type diversity in the Green Mountains of Vermont.Conserv Biol 11(2):522–530
SAS(1982)SAS User’s Guide:Statistics,1982nd edn.SAS institute Inc,Cary
Summerville KS,Crist TO(2003)Determinants of Lepidopteran community composition and species diversity in eastern deciduous forests:roles of season,ecoregion and patch size.Oikos 100:134–148
3 October 2014/Accepted:29 October 2014/Published online:19 July 2015
Project funding:The present study was supported by‘Study on impacts of the climate changes on climate-sensitive insects in forests’’(Project No.KNA-1-2-11,11-3)of Korea National Arboretum.
The online version is available at http://www.springerlink.com
Corresponding editor:Chai Ruihai
Il-Kwon Kim and Jong-Woo Nam have contributed equally to this research.
Electronic supplementary material The online version of this article(
10.1007/s11676-015-0127-8)contains supplementary material,which is available to authorized users.
✉Bong-Kyu Byun
bkbyun@hnu.kr
1Division of Forest Biodiversity,Korea National Arboretum, Pocheon 487-829,Republic of Korea
2Department of Biological Science and Biotechnology, Hannam University,461-6 Jeonmin-dong,Yuseong-gu, Daejeon 305-811,Republic of Korea
3Department of Applied Biology,Kyungpook National University,Sangju 742-711,Republic of Korea
4Department of Forest Sciences,Sangji University, Sangjidaegil 83,Wonju 220-702,Republic of Korea
 Journal of Forestry Research2015年4期
- Journal of Forestry Research的其它文章
- Culm characteristics and volume-weight relationship of a forest bamboo(Melocanna baccifera(Roxb.)Kurz)from northeast India
- Effects of characteristic inhomogeneity of bamboo culm nodes on mechanical properties of bamboo f i ber reinforced composite
- Simulating the heartwood formation process of Erythrophleum fordii in South China
- Wood liquefaction with phenol by microwave heating and FTIR evaluation
- The inf l uences of biotic and abiotic factors on the occurrence and severity of poplar canker disease in Qingfeng County,China and the management implications
- Purif i cation and structural analysis of the toxin AP-I from the pathogen of Bambusa pervariabilis×Dendrocalamopsis grandis blight
