Wood defect detection method with PCA feature fusion and compressed sensing
Yizhuo Zhang•Chao Xu•Chao Li•Huiling Yu•Jun Cao
Wood defect detection method with PCA feature fusion and compressed sensing
Yizhuo Zhang1•Chao Xu1•Chao Li1•Huiling Yu1•Jun Cao1
We used principalcomponentanalysis(PCA)and compressed sensing to detectwood defects from wood plate images.PCAmakesitpossible to reduce dataredundancy and feature dimensions and compressed sensing,used as a classifier,improves identification accuracy.We extracted 25 features,including geometry and regionalfeatures,gray-scale texture features,and invariantmomentfeatures,from wood board images and then integrated them using PCA,and selected eightprincipalcomponentsto expressdefects.Afterthe fusion process,we used the features to construct a data dictionary,and realized the classification ofdefectsby computing the optimalsolution ofthe datadictionary in l1norm using the leastsquare method.We tested 50 Xylosma samples of live knots,dead knots,and cracks.Theaveragedetection timewith PCA feature fusion and withoutwere 0.2015 and 0.7125 ms, respectively.The originaldetection accuracy by SOMneural network was87%,butaftercompressed sensing,itwas92%.
Principal component analysis·Compressed sensing·Wood board classification·Defect detection
Introduction
Wood defect detection is an important process in wood board manufacture,and its results directly influence the quality of wood products.Wood-defect detection includesimage acquisition,image segmentation,feature extraction, and defectclassification(Ruz etal.2009).In the process of image acquisition,surface information about the wood board(Este´vez et al.2003)was collected by an industrial camera.Pham and Alcock(1998)summarized 32 feature vectors offourtypes,including windows,shapes,statistical value and gray-scale.Ruz et al.(2009)proposed three methods for feature selection:statistical method,‘‘leave one out’’method,and genetic algorithms.The results showed that the genetic algorithm has the best effect.Our previous experiments showed that the following features, including gray-scale,texture,invariant moment,and geometry region,could give a complete representation of the defects(Zhang et al.2013).However,as various features lead to complex computation and affect detection speed, the application of feature fusion becomes necessary.
Classification is a critical process in defect detection using the MLP neuron network classifier,Pham and Alcock (1999)analyzed the precision of the classification and found thatthe number of neurons in hidden layers had no obvious influences on the results,yetthe finalresults were greatly affected by the learning rate.Castellani and Rowlands(2009)experimented with decoration board classification,using a neuron network together with a genetic algorithm,but it was only effective in recognizing wood board with a single defect on its surface.When there were two or more types of defects in the same image,this method was even less effective.
Gu et al.(2008)proposed a support-vector machine to classify four kinds of defect,used B-spline to identify the boundary and area of the defects,and chose internalcolor, edge color,and the external color as defect features in classifying.As the accuracy of the B-spline boundary is questionable,the speed and accuracy of recognition were affected.Zhang et al.(2013)proposed defect detectionbased on a SOM(self-organizing map)neuralnetwork that requires fewer training samples.
For improving the accuracy of wood-board defect detection and overcoming the disadvantages of multi-dimension and computation complexity,we focused on feature fusion and classifier design.Through linear transformation,the PCA method could discover data variety from multi-dimension and reduce the data dimension by preserving features with the biggest contribution in variance.Compressed sensing is a signal processing method proposed by Donoho(2006)and Candes(2006).Signals are compressed or made sparse through proper transformation.By calculating the optimized feature matrix,defect samples are detected.Because complicated training processes are unnecessary forthe compressed sensing method, takes less computation time and produces better classification results.
Materials and methods
Materials
We focused on three wood board defects:dead knots,live knots,and wood cracks.The size of the board in our experiment was 40×20×2 cm.The wood species was Xylosma.The experimentwas conducted in MatlabR2012, a platform with a 64-bit PC(Corei3,Double-core, 2.25 GHz),and an Oscar F810C IRF camera was used to obtain experimentimages.To make the images clearer,two parallel LEDs were used for illumination.In addition,50 8-bitgray levels images of128×128 pixels were used for training(20 live knots,20 dead knots and 10 cracks).
Feature extraction and fusion of wood defects
Feature extraction and fusion is the firststep in wood defect identification.The features should include as much defect information as possible and require less calculation work at the same time.First,we extracted 25 features of three types including geometry features,regional features,texture features,and invariant moment.Then,we conducted features normalization,used principal component analysis (PCA)forfeature fusion,and selected features with greater contribution for defect identification.The extraction and fusion process is shown in Fig.1.
We gota complete representation of the defects from 25 features of three types in the wood board images.By extracting and observing these features,the same type of defects had similar feature values and different kinds of defects had different feature values.However,25 features contained a large number of repeat information with a duplicate expression,when feature numbers increased and the amount of computation work increased.PCA was implemented to exchange and fuse these features and reduce the number of feature dimensions.Each new feature was obtained by linear combination and transformation of the original features which ensured information preserving of the image.The steps of PCA feature fusion are as follows:
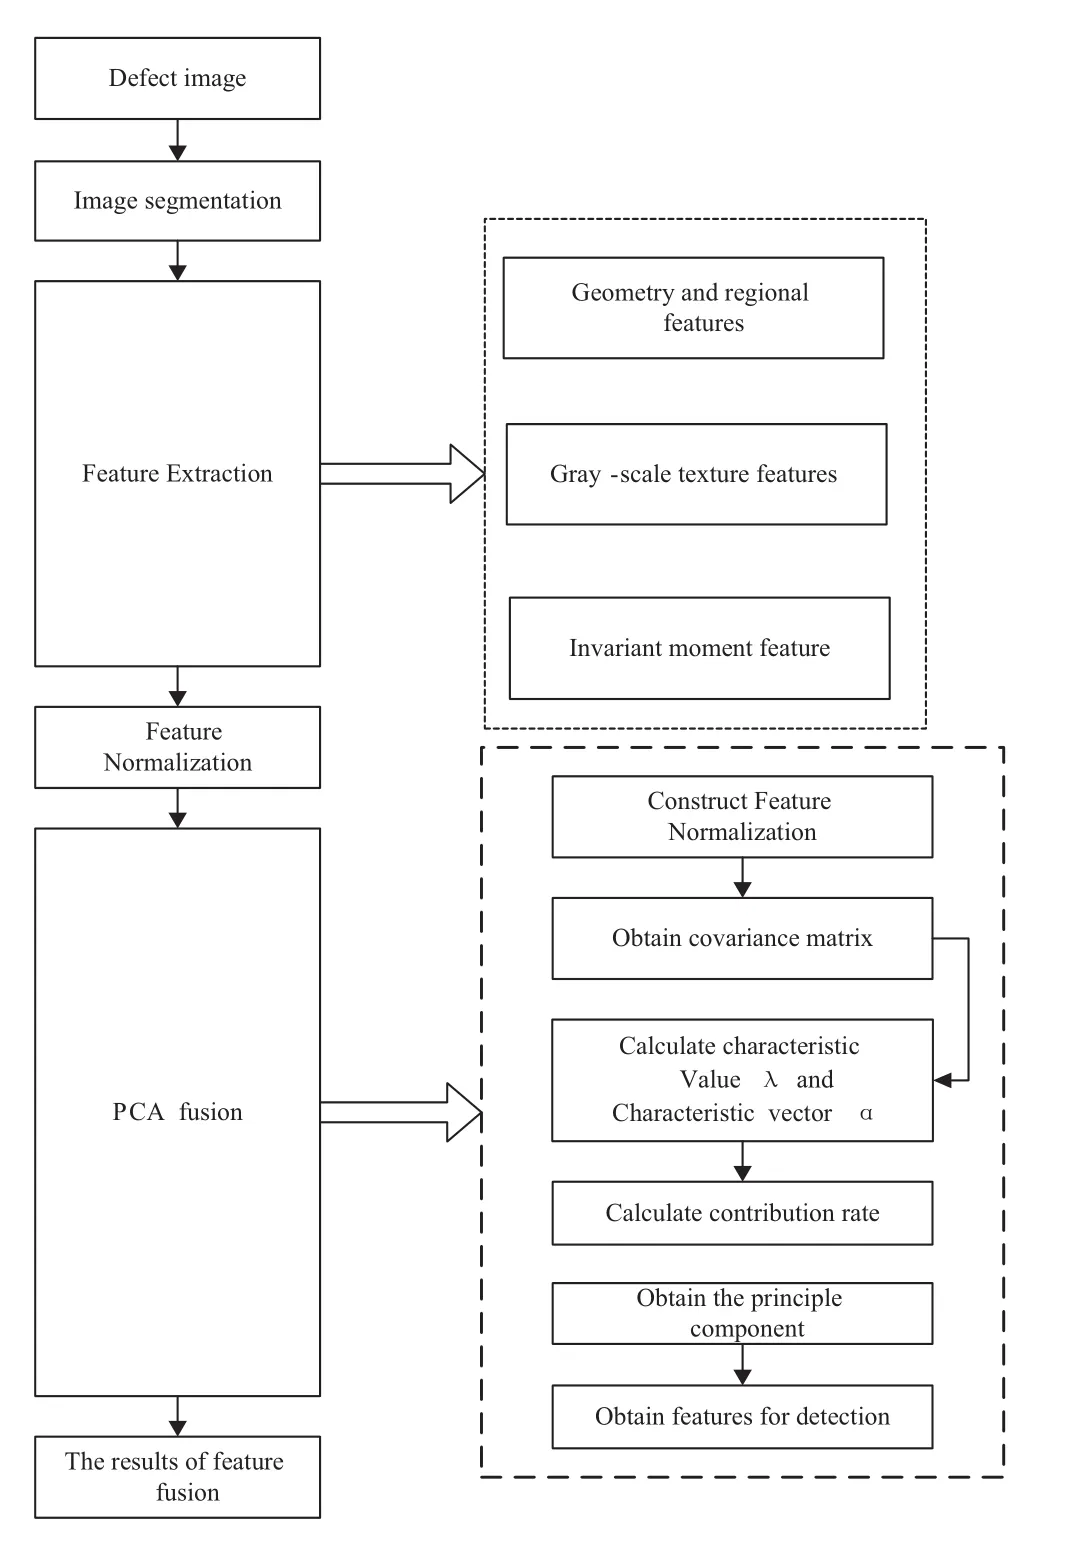
Fig.1 Flow diagram of feature extraction and fusion
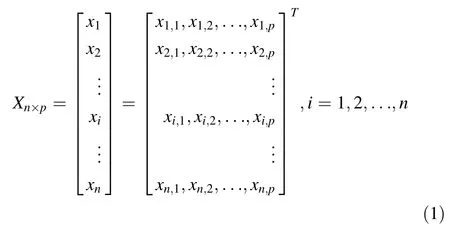
Build the standardize sample matrix X in Eq.1,where,p is the feature dimension,and n is the sample number (n>p).
Use Eq.2 to standardize transform sample X,and then obtain standardized matrix Z.

Calculate covariance matrix R of standardized matrix Z.

Calculate eigenvalueλand eigenvectorαof characteristic equationwith covariance matrix R.
Rerank the eigenvalue by descending orderand obtain λ, calculate the contribution and cumulative contribution of each principal component by Eqs.5 and 6.
The contribution of each principal componentis Eq.5:

The cumulative contribution is Eq.6:

Choose the first k principal components which cumulative contribution can reach the pattern recognition need and transform matrix E is obtained by Eq.7:

Calculate finalprincipalcomponents Y,and Y is the final input of the defect classifier.

Defect detection based on compressed sensing
In applying compressed sensing to wood classification,we used optimized feature vectoring as the sample sequence and training samples to create a data dictionary,and tested samples linearly by training the samples.When the sparse representation vector of test samples in the data dictionary was calculated by solving optimization problem under the l1norm,the classification result was obtained.
With compressed sensing,when a signal is sparse in certain transformation domains,an observation matrix, which is irrelevantto the transformation basis,willproject the multi-dimensional information obtained by the transformation into low-dimensional space.Then,by solving a convex optimization problem,an original signal is reconstructed from these few projections of high probability (Donoho 2006;Shi et al.2009).
First,assume x as one-dimension discrete time signal of a real value with limited length,and can be used as a sequence vector of n×1 dimensions.If matrixψand vectorαexists and Eq.9 is meaningful,then x is sparse in domainψ.

where,ψis the orthogonal transformation basis called a sparse matrix,andψ∈Rn×n.The transformation coefficient of x in domainψ,α,isα∈Rn×1,the number of nonzero values is far less than the number of signal dimensions.
If the signal is projected onto a matrix ofφ,which has no relationship with the transformation basis,the observed signal y is obtained through Eq.10.

where,φis the observation matrix,andφ∈Rm×n:y is the observation vector,and y∈Rm×1.
Finally,by deriving the optimized l0norm of Eq.11,we obtainα1,which is the exactor approximate solution ofα.

Equation 11 is an undetermined equation.According to compressed-sensing theory,if the signal is sparse enough, the question of minimum can be transformed into deriving the l1norm of Eq.12,a process of convex optimization.By solving the problem of linear programming,the original signal is reconstructed from N observation values.

The data dictionary matrix composed of three types of training samples is shown in Eq.13:

If the number of training samples of wood type i is adequate,then the feature vector of test image y can be represented by linear combination of training samples Aiwhich belong to wood type i,thatis:

where,y is the feature vector of the test image,and y∈Rn×1;theαihere is the vector of linear representation coefficient,andαi∈Rn×1.
If we apply the above equations to the whole data dictionary matrix A,then:

where,αis sparse vector,and N is the total amount of samples.

If the test samples are of type i,except for the only m data that represent the feature of wood type i,then all other data in vectorαare 0.In other words,as the number ofvalues which are not0 inαis much less than the number of signal dimensions,αis a sparse vector,and the above process is considered the sparse decomposition of test samples.
The classification process of unknown test samples is as follows:put test sample feature y into Eq.16 in which y∈Rn×1and A∈Rn×N,and acquire sparse vectorαby solving Eq.16.Here,Eq.16 is an undetermined system of equations,andαvector is a sparse vector.According to compressed-sensing theory,the exact solution or approximate solution ofαcan be obtained by solving the optimization problem of Eq.17 of l1norm.Theεin this Eq.17 is the error threshold.In actual application,the sample type is determined by the non-zero item inα1.

Results and discussion
Classification steps
The defect classification experiment is shown in Fig.2, including image collection,morphology segmentation, feature extraction,feature fusion,classifier design,and result assessment.
The defect images are read by Matlab12;for example, Figs.3,4,5 represent live knot,dead knot,and crack,respectively.To reduce the computation work and increase the speed of computation,all color images are transferred into gray-scale images and changed to standard pictures of 128×128 pixels.

Fig.2 The flow diagram of defect classification
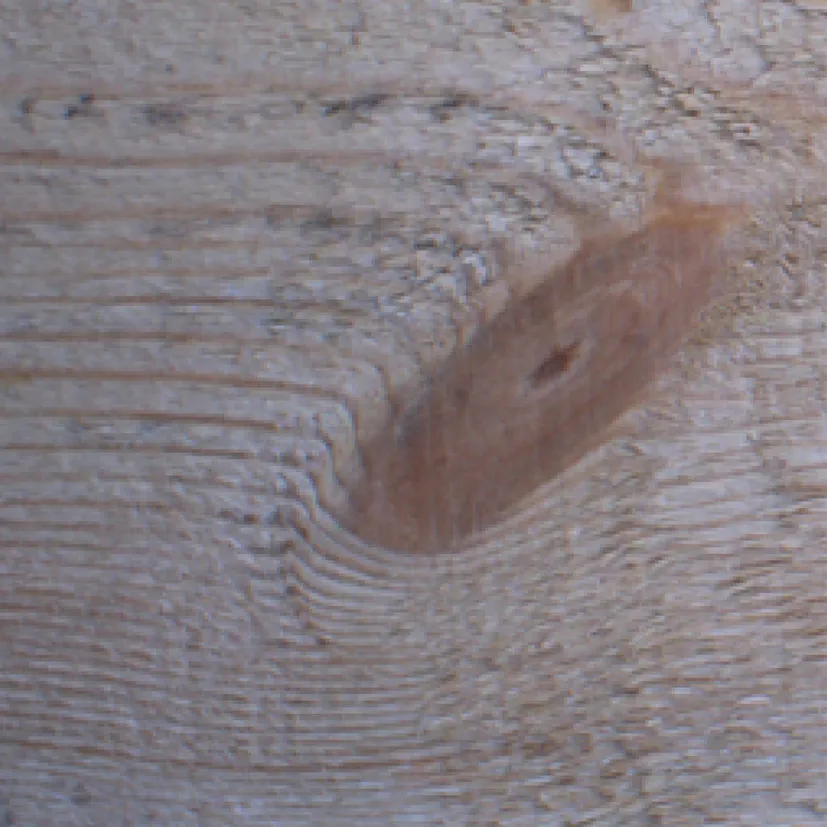
Fig.3 Live knot
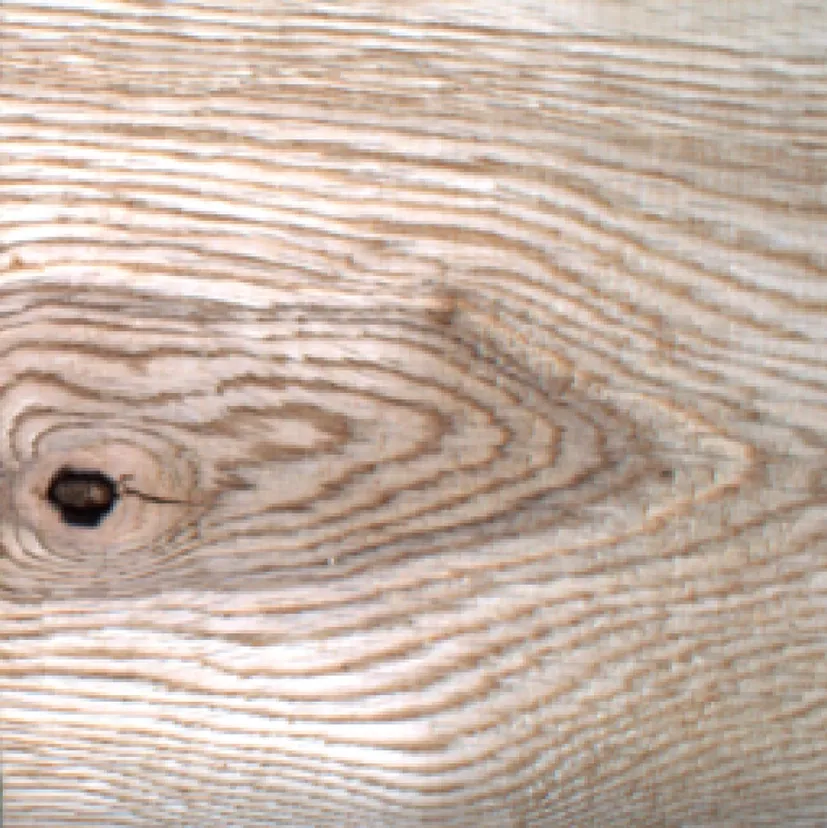
Fig.4 Dead knot
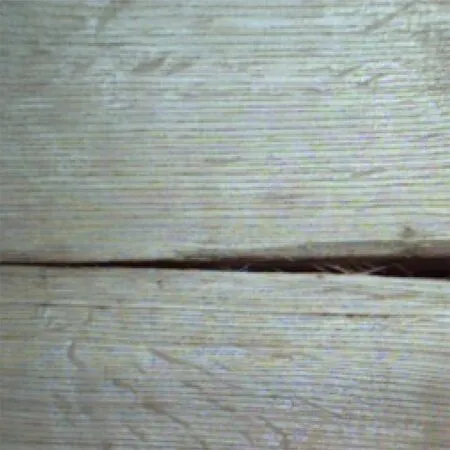
Fig.5 Crack
Mathematical morphology is an image-processing method based on geometry with the advantages of continuous image skeleton,fewer breaking points,and rapid, exact image segmentation(Zhang et al.2014a,b).Using this method,the exactdefecttargets are separated from the background.The results of segmentation are shown in Figs.6,7,8.
Calculate 25 features when segmentation is over and then normalize them.According to Eqs.1–4,PCA maps high dimension features to low dimension spaces,and find eigenvalueλand eigenvectorαby covariance matrix R.λ is obtained by re-ranking eigenvalueλin descending order.
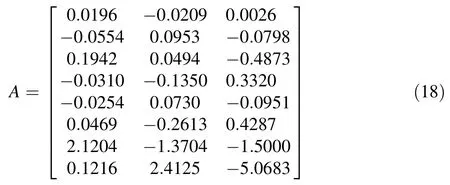
The variance of data is reflected by corresponding eigenvalues.Over different spaces with the same dimensionality,the space spanned by the eigenvectors corresponding to the larger eigenvalues carries the most variance.From Eqs.5 and 6,contribution of each principal component niand cumulative contribution mican be obtained(Table 1). training samples.The data dictionary A of three types of defects is shown as follows:
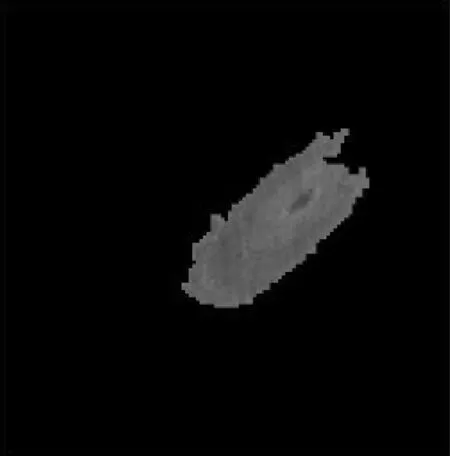
Fig.6 Segmentation result of live knot
Figures 3,4 and 5 are employed as testing samples. Extract 25 features from the segmented images of Figs.6, 7,8,and then calculate the principal components from defect features by PCA transformation.The principal components ofthe three testsamples are represented by hT, sT,and lT,respectively,as follows:

The top eight principal components can reach a cumulative contribution of more than 95%;therefore,those components are selected as the input of the classifier.
After the determination of principal components,calculate its means and build the data dictionary A by the 50
Implementclassification in accordance with Eq.17,and obtainwith the least square method:


Fig.7 Segmentation result of dead knot

Fig.8 Segmentation result of crack
The sample type is determined by the maximum value inAccording to,we see that the classification results of Figs.3,4,5 are live knot,dead knot and crack, respectively.
The effective test of the PCA feature fusion
To verify the necessity of feature selection,we carried out defect-detection comparison tests between the PCA feature-fusion and variance selection methods(Peck and Devore 2005).We used 50 sample images of live knots, dead knots,and cracks for feature selection andclassification.In the process of variance selection,we chose features according to their variances for the betweensample dispersion and divisibility,as determined by feature variance.The classification results ofthe variance selection and PCA methods are shown in Table 2.
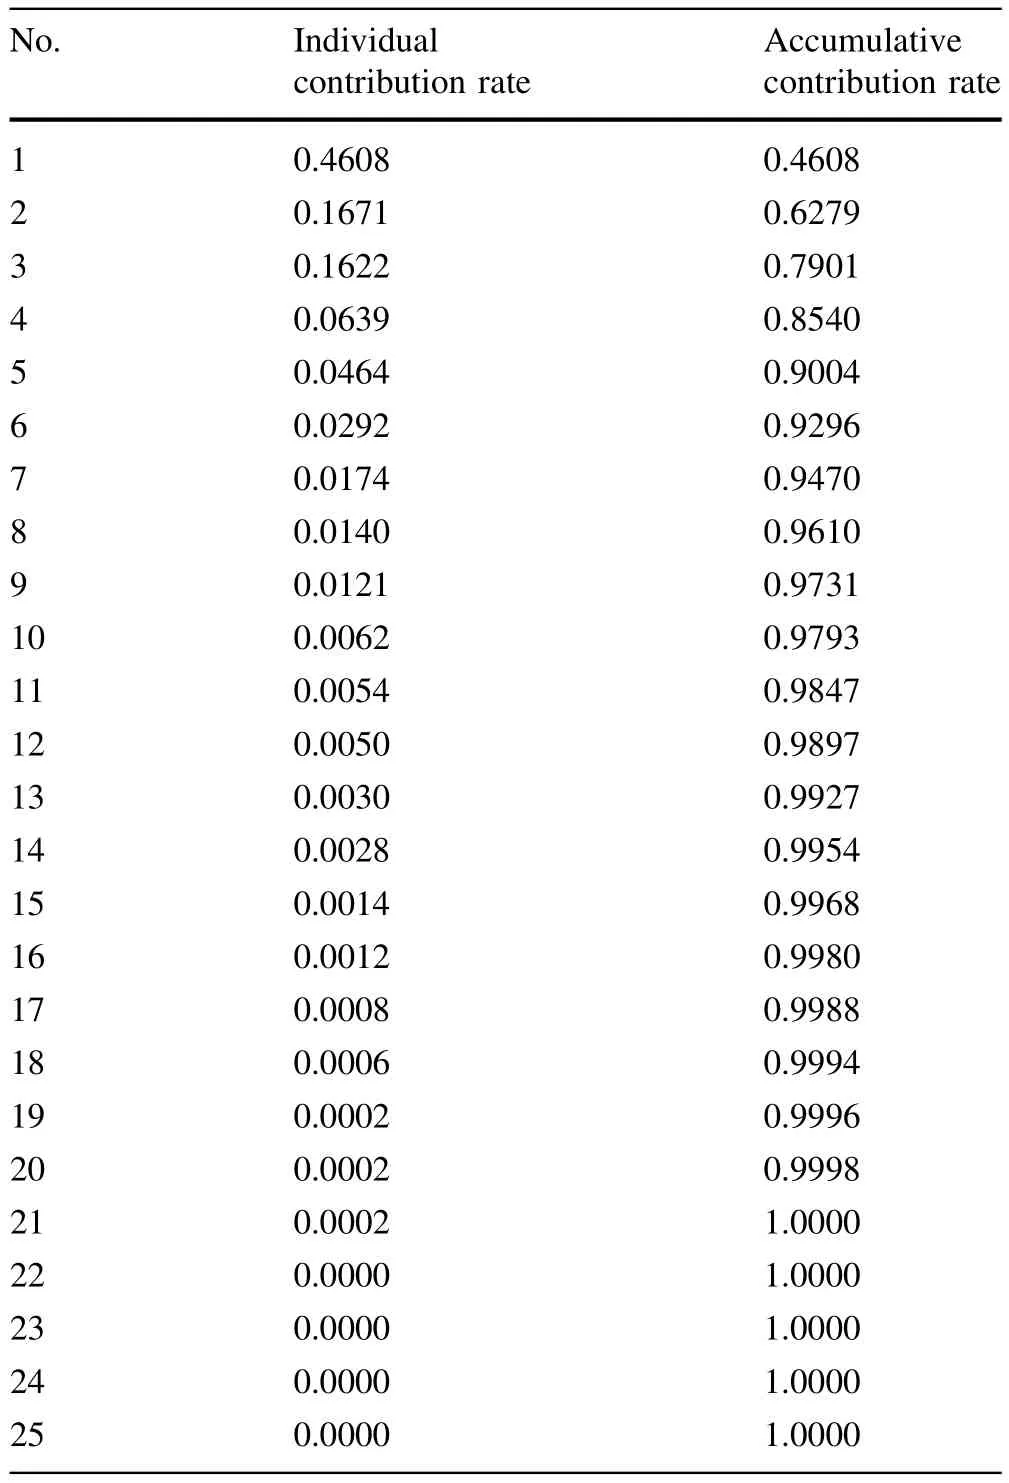
Table 1 Contribution of each principal component
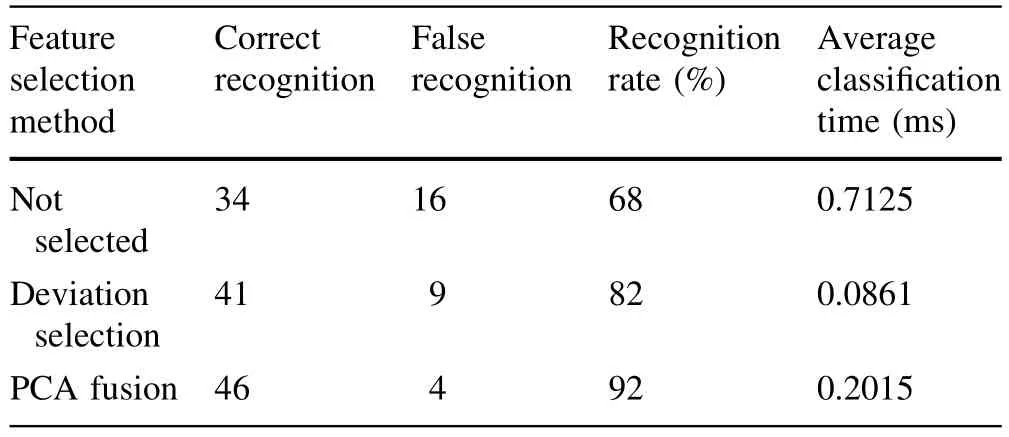
Table 2 Result of feature comparison
In Table 2,the recognition rate without the feature selection step is 68%,and the time required for recognition is 0.7125 ms.The PCA method has the best recognition rate at 92%,and its recognition time is 0.2015 ms. Therefore,the feature selection can not only reduce identification time,but also increase the recognition rate.

Table 3 The comparison with SOM neural network method
The classification test of compressed sensing classifier
To test the performance of the classification method proposed in our study,we used the neural network classifier (Candes 2006).As the SOMneuralnetwork requires fewer training samples with higher classification accuracy,SOM was compared with compressed sensing in our experiment. Live knots,dead knots,and cracks for 50 test images were classified,and the accuracy and time of classification are shown in Table 3.
As shown in Table 3,step-by-step iterative computation is necessary in the process of SOM classification:each step may influence the computation results,so the SOMclassifier has limits on recognition and time consuming.However,the wood defect recognition based on compressed sensing doesn’trequire complex computation.The time required for recognition is significantly reduced,while the exactness of recognition has improved by 5%over the SOM classifier.
Conclusion
Focusing on the complexity of wood-board surface defect information,we proposed a new defect feature fusion method by performing PCA on the high-dimension features.Then,we built a compressed sensing classifier to construct the data dictionary of typical samples,and obtained an optimized solution using the leastsquare method. The results of simulation experiments reveal thatthe PCA fusion method can give a more complete representation of the defect information.Compared with the SOM neural network algorithm,the compressed sensing classifier has several advantages:fewer parameters,better flexibility, less computation time,and higher classification exactness. Therefore,the defect classification algorithm based on PCA fusion and compressed sensing can effectively increase the speed and exactness of wood-defect detection.
AcknowledgmentsThis work was financially supported by the Fund of Forestry 948 Project(2011-4-04),the Fundamental Research Funds for the Central Universities(DL13CB02,DL13BB21),and the Natural Science Foundation of Heilongjiang Province(C201415)
Candes E(2006)Compressive sampling.Proc Int Congr Math 3:1433–14521
Castellani M,Rowlands H(2009)Evolutionary artificial neural network design and training for wood veneer classification.Eng Appl Artif Intell 22:732–741
Donoho D(2006)Compressed sensing.IEEE Trans Inf Theory 52(4):1289–1300
Este´vez PA,Perez CA,Goles E(2003)Genetic input selection to a neural classifier for defect classification of radiata pine boards. For Prod J 53(7/8):87–94
Gu IYH,Andersson H,Vicen R(2008)Automatic classification of wood defects using support vector machines.In:Computer vision and graphics:lecture notes in computer science,vol5337. Springer,Berlin,pp 356–367
Peck R,Devore JL(2005)The exploration and analysis of data. Duxbury Press,Belmont,pp 611–662
Pham DT,Alcock RJ(1998)Automated grading and defectdetection: a review.For Prod J 48(3):34–42
Pham DT,Alcock RJ(1999)Automated visual inspection of wood boards selection of features for defect classification by a neural network.Proc Inst Mech Eng Part E 213(4):231–245
Ruz GA,Estevez PA,Ramirez PA(2009)Automated visual inspection system for wood defect classification using computational intelligence techniques.Int J Syst Sci 40(2):163–172
ShiGM,Liu DH,Gao DH,Liu Z,Lin J,Wang LJ(2009)Advances in theory and application of compressed sensing.Acta Electron Sin 37(5):1070–1081
Zhang YZ,Cao J,Xu L,Yu HL(2013)Wood floor defects segmentation and recognition based on morphologicaland SOM. Electr Mach Control17(4):116–120
Zhang YZ,Liu SJ,Cao J,Li C,Yu HL(2014a)A rapid,automated flaw segmentation method using morphologicalreconstruction to grade wood flooring.J For Res 25(4):959–964
Zhang YZ,Xu L,Ding L,Cao J(2014b)Defects segmentation for wood floor based on image fusion method.Electr Mach Control 18(7):113–118
10 September 2014/Accepted:4 December 2014/Published online:30 April 2015
©Northeast Forestry University and Springer-Verlag Berlin Heidelberg 2015
The online version is available at http://www.springerlink.com
Corresponding editor:Yu Lei
✉Jun Cao zdhcj@163.com
1Northeast Forestry University,Harbin 150040,China
 Journal of Forestry Research2015年3期
- Journal of Forestry Research的其它文章
- Management of pests and diseases of tropical sericultural plants by using plant-derived products:a review
- Gamma generalized linear model to investigate the effects of climate variables on the area burned by forest fire in northeast China
- Diversity,abundance,and structure of tree communities in the Uluguru forests in the Morogoro region,Tanzania
- Brazilian savanna re-establishment in a monoculture forest: diversity and environmental relations of native regenerating understory in Pinus caribaea Morelet.stands
- Carbon storage and sequestration rate assessment and allometric model development in young teak plantations of tropical moist deciduous forest,India
- Use of infrared thermal imaging to diagnose health of Ammopiptanthus mongolicus in northwestern China
