Three-Dimensional Reconstructed Finite Element Model for C/C Composites by Micro-CT
(张海军), (周储伟)
State Key Laboratory of Mechanics and Control of Mechanical Structures, Nanjing University of Aeronautics and Astronautics, Nanjing 210016, P.R. China (Received 8 October 2014; revised 15 May 2015; accepted 19 October 2015)
Three-Dimensional Reconstructed Finite Element Model for C/C Composites by Micro-CT
ZhangHaijun(张海军),ZhouChuwei(周储伟)*
State Key Laboratory of Mechanics and Control of Mechanical Structures, Nanjing University of Aeronautics and Astronautics, Nanjing 210016, P.R. China (Received 8 October 2014; revised 15 May 2015; accepted 19 October 2015)
The precise microscopic feature of carbon-carbon(C/C) composites is essential for an accurate prediction of their mechanical behavior. After fabrication, actual microscopic feature differs from simple ideal spatial model. Micro-computed-tomography(CT) scan can well describe internal microstructures of composites. Therefore, a reconstructed model is developed based on mirco-CT, by a series of prodcedures including extracting components, generating new binary images and establishing a finite element (FE) model. Compared with the model designed by reconstructed commercial software MIMICS, the presented reconstructed FE model is superior in terms of high mesh quality and controllable mesh quantity. The precision of the model is verified by experiment.
C/C composites; mirco-CT; binary image; reconstructed procedure; finite element model
0 Introduction
Carbon-carbon (C/C) composites are ideally suited for those situations where high specific strength and stiffness, low density, corrosion and fatigue resistance and especially high serving temperature are required[1-5]. C/C composite has been widely used in aerospace, aviation, nuclear and other civilized industries[6]. Its service performance is severely influenced by defects during manufacturing process, including voids and irregular yarns′ appearance, as shown in Fig.1.
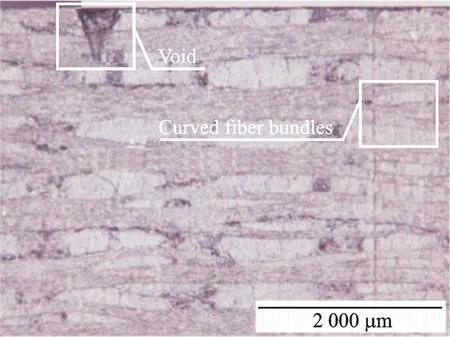
Fig.1 Defects of C/C composites observed by microscope
Based on experimental results, Siron and Lamon[7]discovered the tensile and shear modules of 8-H satin weave C/C composites would be reduced by 25% and 80% due to micro-cracks and voids under loading. Aly-Hassan et al.[8]reported that at room temperature the fatigue limit of C/C laminates reduced from 230 to 213 MPa due to the occurrence of the fiber-matrix interface de-bonding. Not only the modules and strength but also the oxidation behavior are influenced by the microstructure. Han et al.[9]claimed that the zirconium carbide doped C/C composites and the oxidation always started from the voids and cracks at the fiber-matrix interfaces. Jacobson and Curry[10]investigated the oxidation processes of the fine weave C/C composites and revealed that the oxidation occurred firstly from the surfaces and voids. Microstructures are the essential factors to influence mechanical properties and oxidation behaviors of C/C composites.
To describe microstructures of C/C composites, the distributions and shapes of voids, the real cross-sections, relative positions and longitudinal shapes of real yarns must be focused on. Mirco computed tomography(CT) is an effective technology for detecting microstructures without damage inside body[11-13]. X-ray micro-tomography has its roots in computerized axial tomography(CAT or CT) scans that have been used for medical imaging for over 40 years[14]. Presently, CT has been introduced for modeling in many fields, such as concrete reconstruction[15-17], mannequin reconstruction[18]and foamed aluminum reconstruction[19-21]. In C/C composite researches, CT is used to capture the subsurface features. A geometry model of C/C composite has been successfully reconstructed[22-23], however, the model is too complex to be used for mechanical analysis. Kan[24]did some work on voids statistics and interface extraction, but the investigation was mainly based on a simplified spatial model. Sharma et al.[25]introduced voids and cracks in the ideal model for analyzing their influence on mechanical properties. The model is more complex than the ideal model but still cannot represent real material. Therefore, a sophisticated model is needed.
Based on micro-CT, a more realistic finite element(FE) model is established. The model takes the voids and real yarns into consideration and is verified by experiments. Some conclusions are drawn.
1 Reconstruction Procedure
1.1 Extraction of components
Results of a CT scan is a gray level image which can be delivered and stored by matrix, thus MATLAB is a favorite tool in CT treatment[26-28].
CT for fine weave pierced C/C composite is acquired from multi-scale voxel. The general view of the model scope is shown in Fig.2. The side lengths of the cube inX,YandZdirections are 5.42, 5.25 and 5 mm.
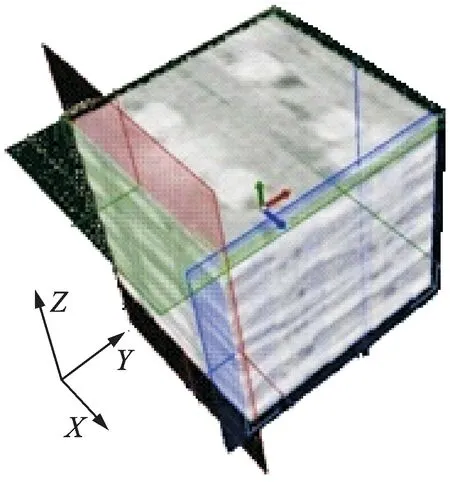
Fig.2 General view of the scope
Take images ofY-Zplane for example. Since both matrix and reinforcement fibers are carbon, their gray values are close. Due to low contrast, traditional methods, like homogenization of gray value or Gauss wavelet do not work. Therefore, to distinguish the boundaries of components, an appropriate threshold should be determined first.
Step 1 From the gray level map of CT shown in Fig.3(a), the distribution scope of threshold can be obtained. In the present work,Yyarns are the major content in the image with high intensity and located at the right part of gray level map shown in Fig.4. A value near 150 is the dividing point between yarns and others.

Fig.3 Original image and local enlarged image
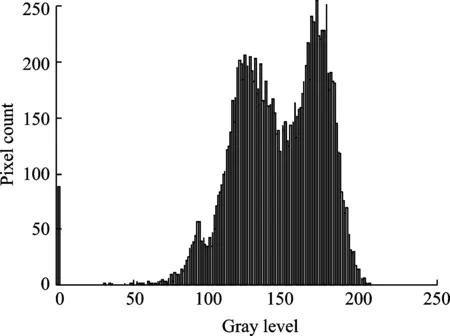
Fig.4 Gray level map of CT of C/C composite
Step 2 A local part of original image (Fig.3(a)) which contains boundaries among different components is extracted, as shown in Fig.3(b). The bold white frame near left side of Fig.3(b) involves a boundary between yarn and matrix, the two of which are of close gray value. The corresponding gray value matrix is shown in Fig.5.
With identity of local image and its matrix, one can get the boundary of yarns marked with bold and gray background in Fig.5. Therefore, the threshold is in range of 147 to 150, and in this work, the value is determined as 150. By many attempts, the results from threshold 147 and 150 are similar.

Fig.5 The gray value matrix of the enlarged scope
After resetting the gray value of every position in the images by the threshold, new binary images are obtained, shown in Fig.6(a).The new binary image is identical to the original one but polluted by noises, thus the boundaries are not so smooth. The mid-filter method is then used to eliminate the noises. Filtered results(Fig.6(b)) show that corrosion and inflation are implemented to smooth the boundaries with operator ″line 8×8″ after trial and error. The final binary image with clear and smooth boundaries is obtained, as shown in Figs.6(c, d).
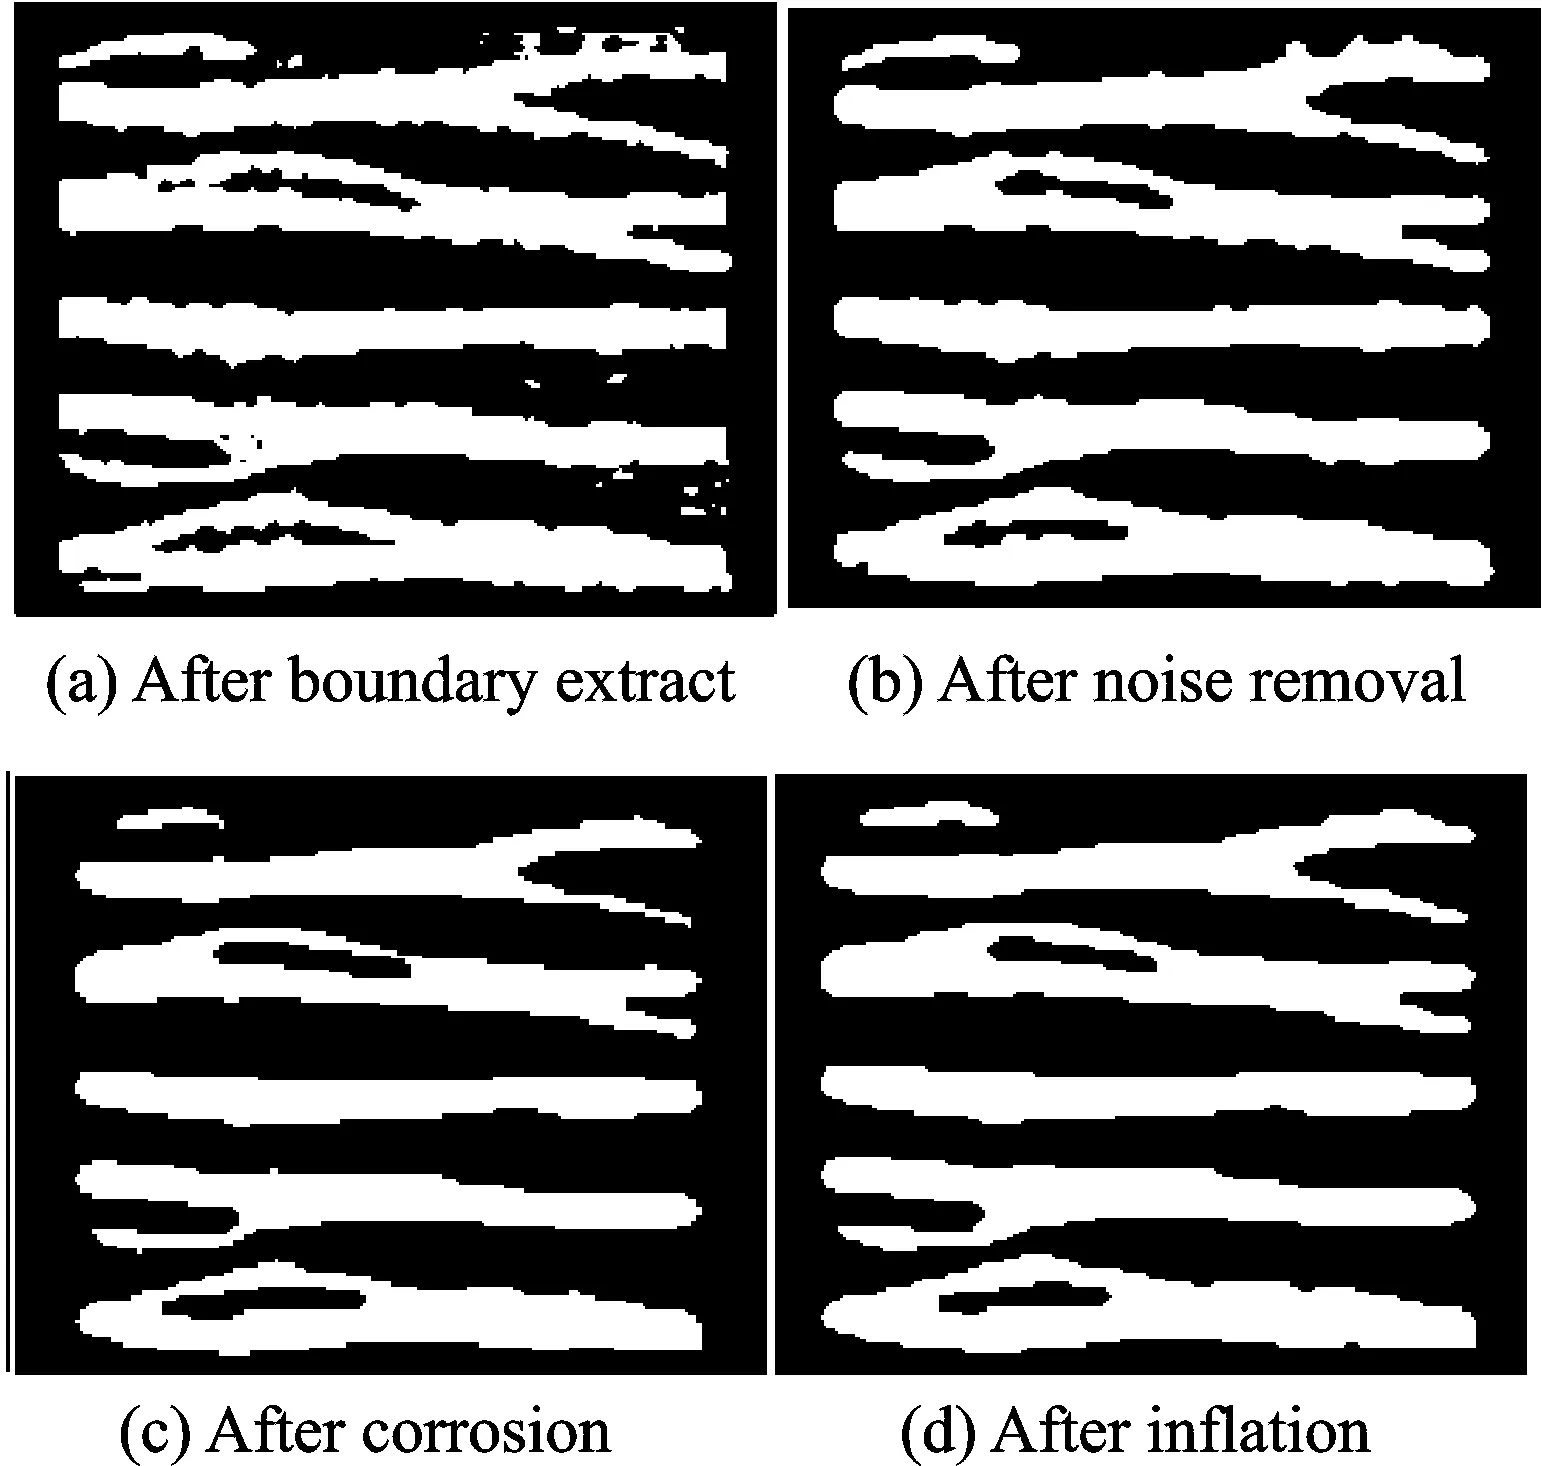
Fig.6 Binary images after noises removal and boundary smoothing
By the method and procedures presented above, three groups of yarns, voids and matrix can be acquired conveniently.
1.2 Reconstruction of FE model
In engineering applications, composites always contain several components. If each component can be reconstructed, their relative positions in the final assembly will be a thorny problem. To circumvent this difficulty, a new set of unidirectional images containing all components is generated after each component extracted from its original tomography. A typical diagram is shown in Fig.7. The gray value of each component in Fig.7 is listed in Table 1. This new set of images is the source of the reconstructed model.

Fig.7 Components in the images with different pixel values

ComponentMatrixVoidZyarnYyarnXyarnGrayvalue040110180255
The essence of reconstruction is to determine whether components exist in a certain spatial position or not. In this paper, the determination is achieved by matching the gray values between adjacent layers, which is displayed in Fig.8.
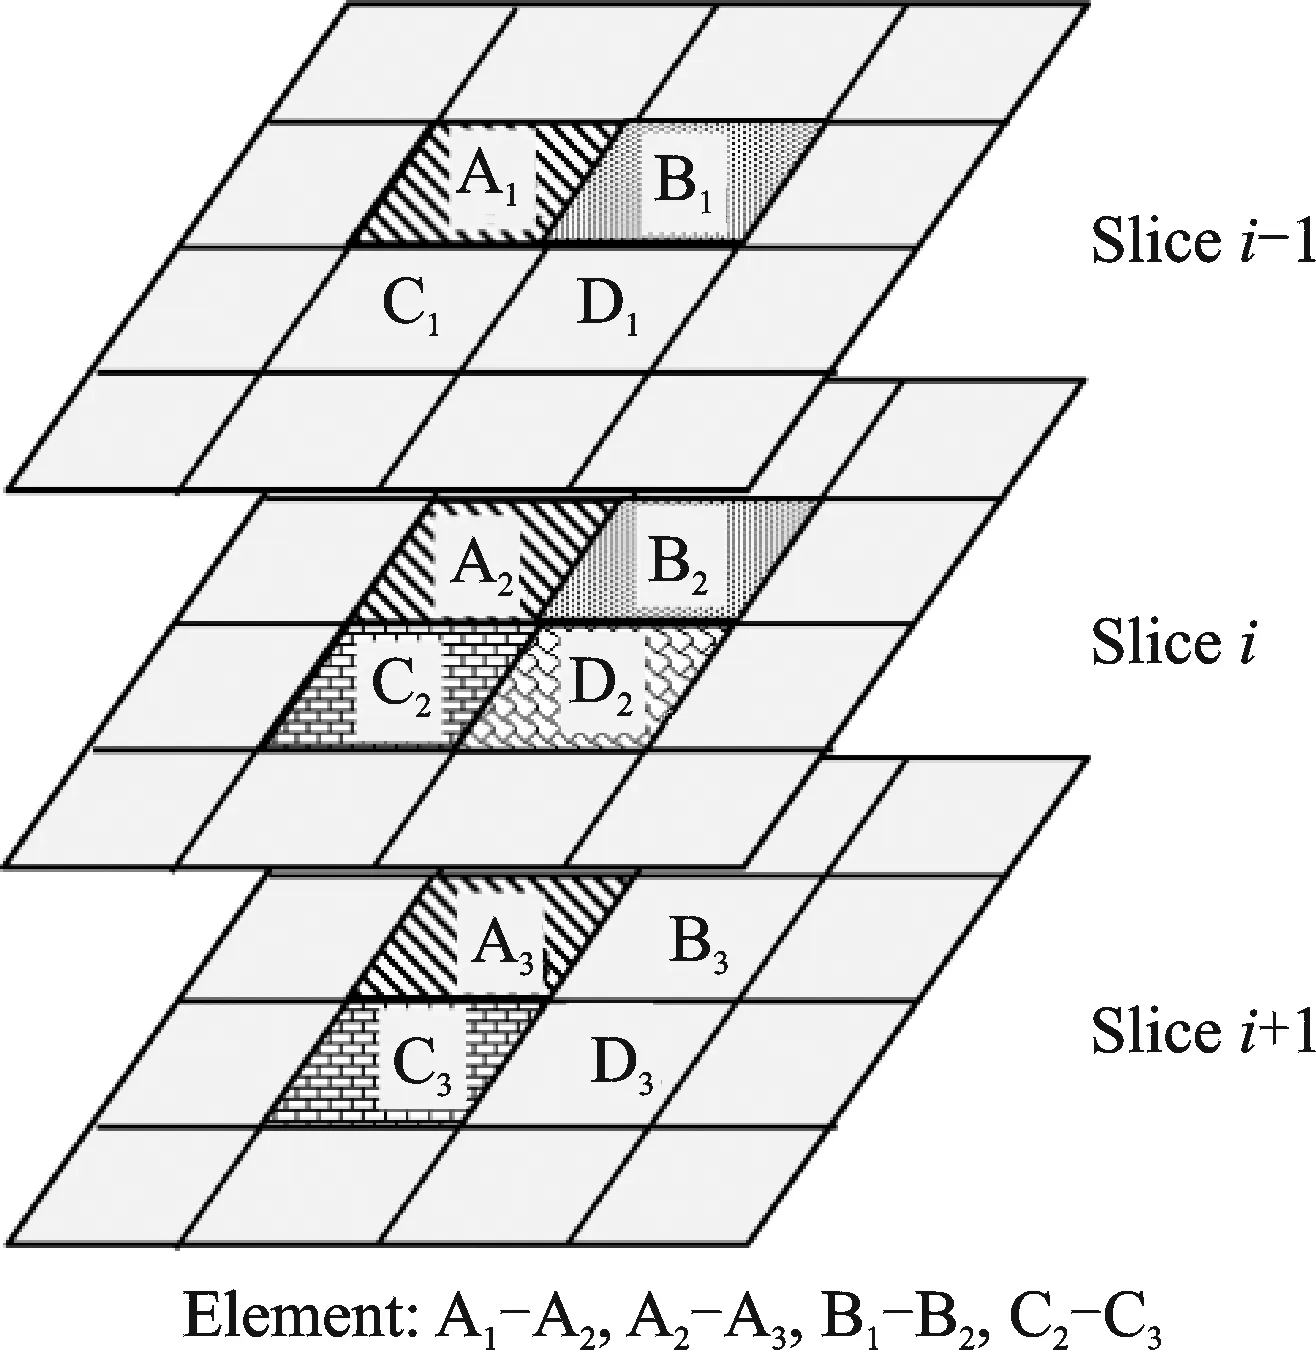
Fig.8 Relationship between elements and gray values in layers
Only when the gray levels are the same between adjacent layers, the element of corresponding set can be generated, as shown in Fig.8.
Since the amount of judgment and calculation is large, a special reconstruction program is compiled for automatic operation.
The output file of the reconstruction program is in INP format, which can be imported to ABAQUS for analysis. The FE model and its components are shown in Fig.9.
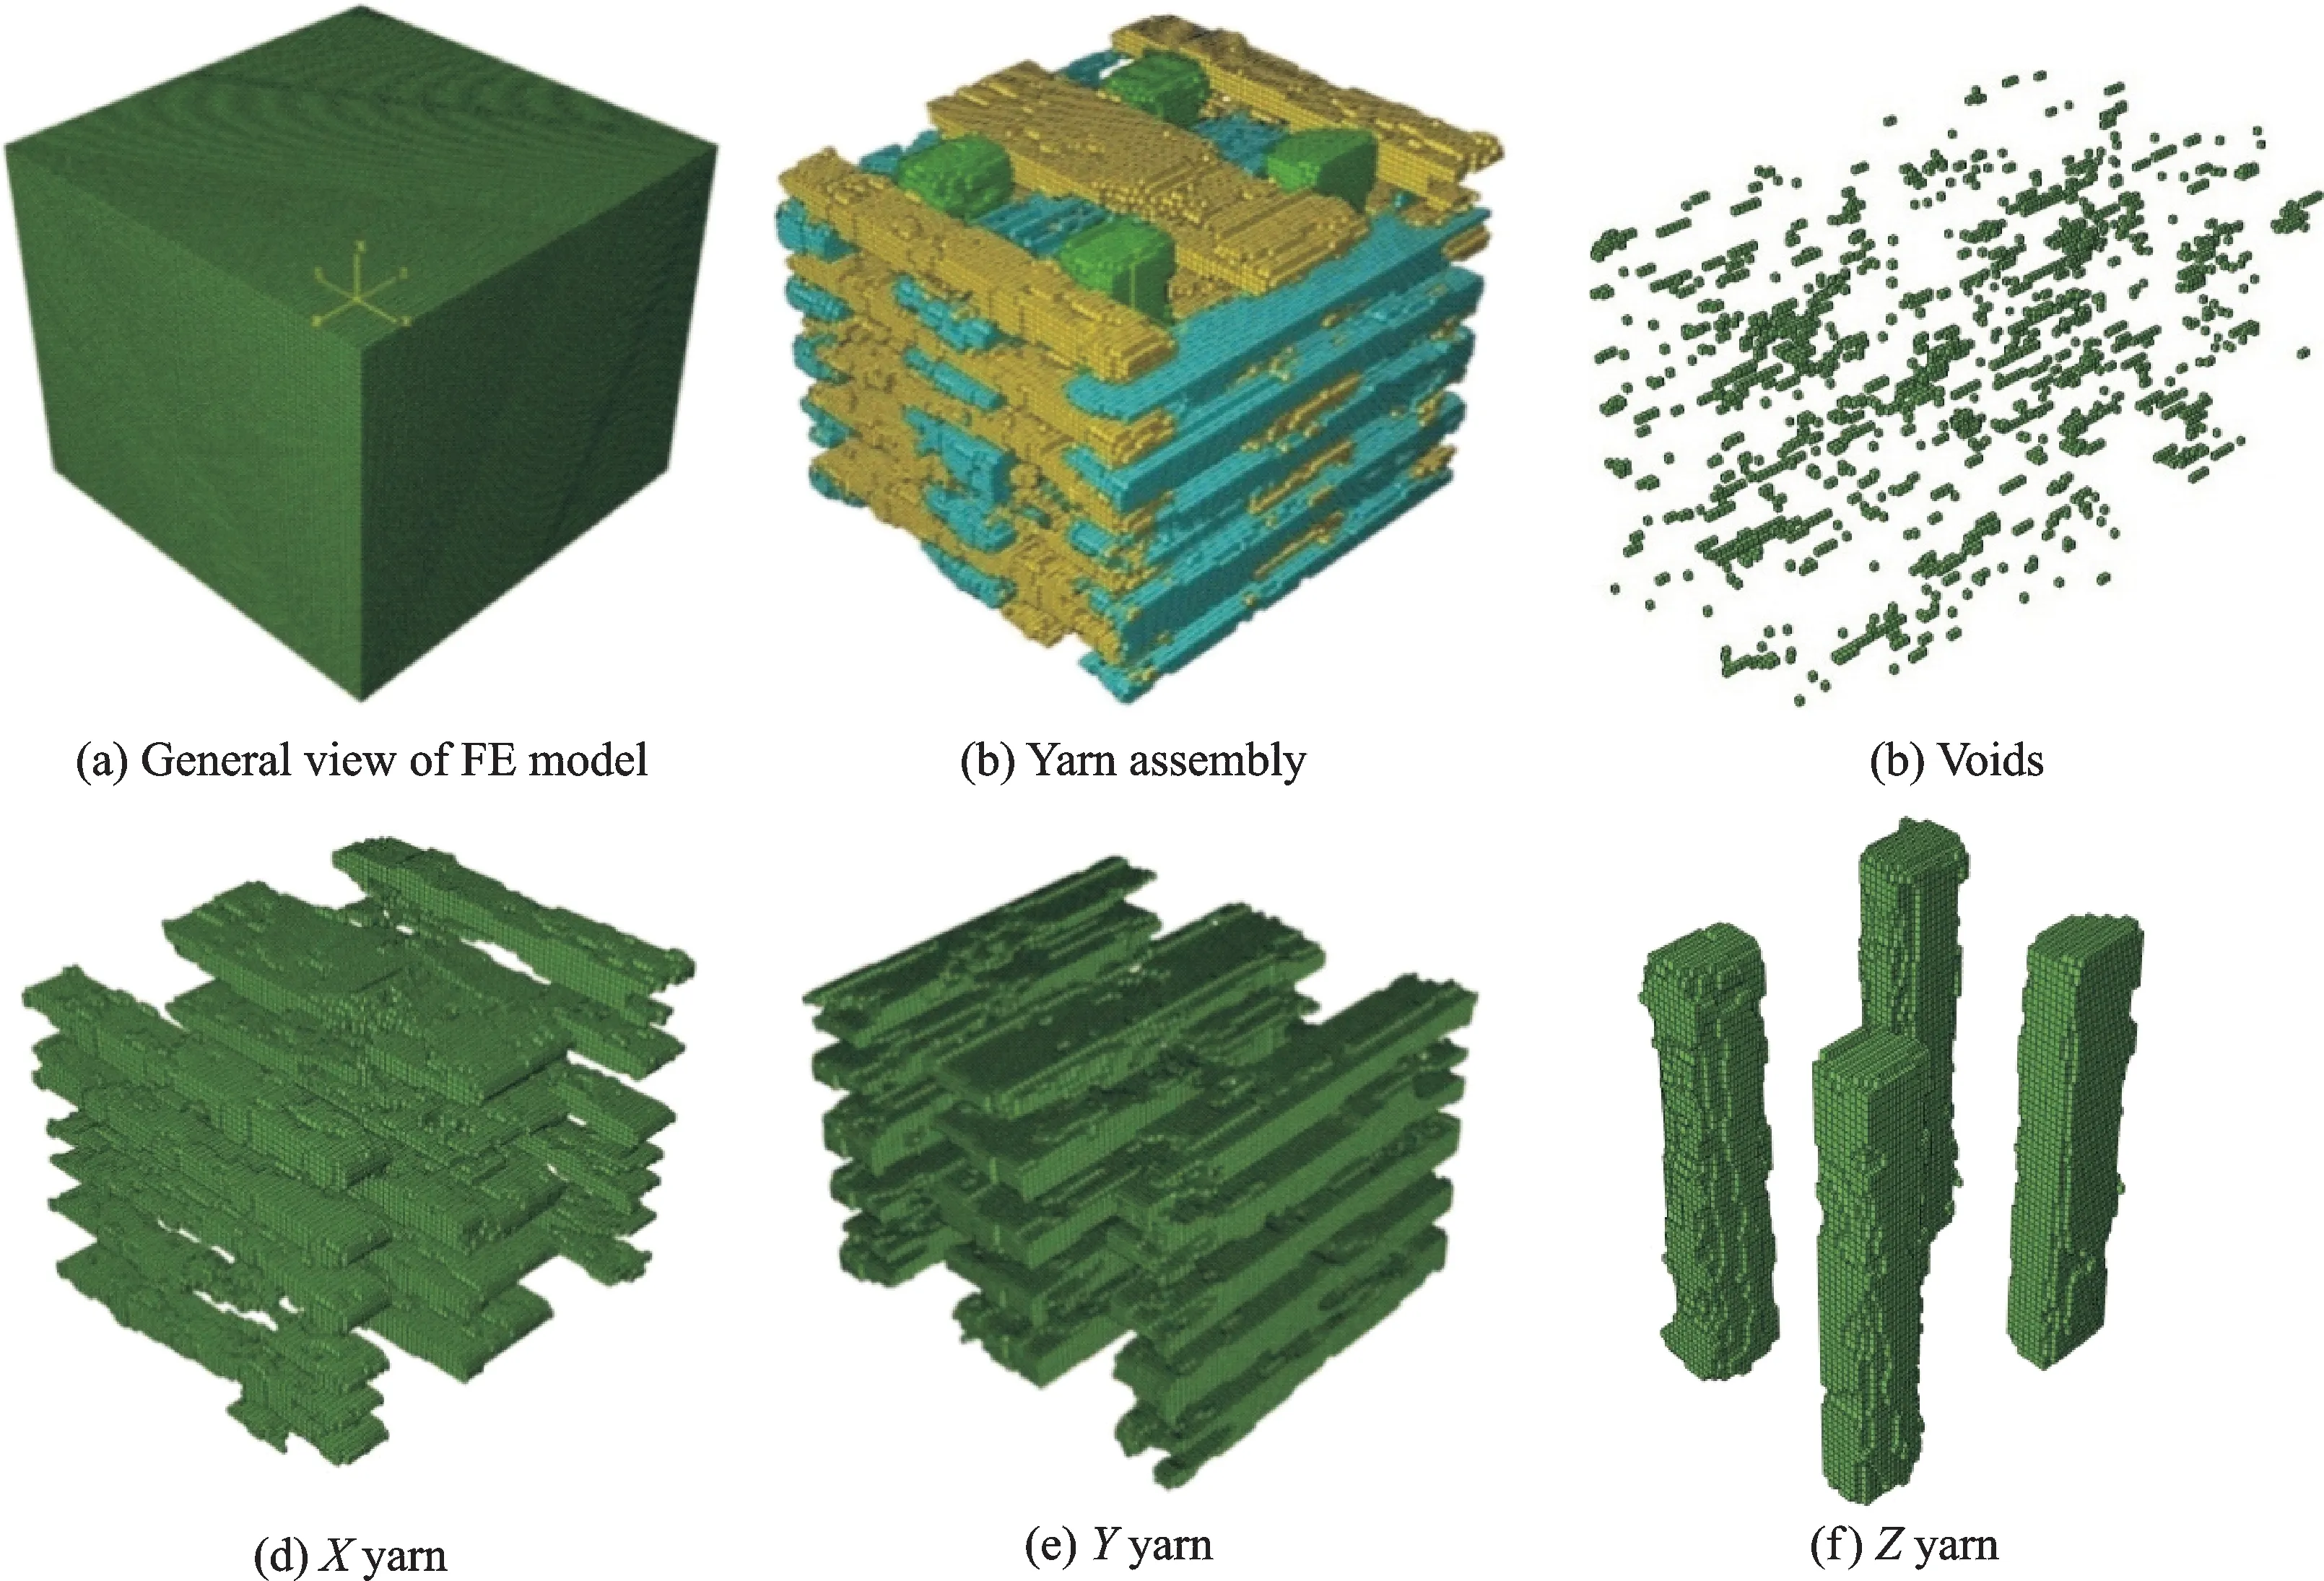
Fig.9 Reconstructed model and components
Fig.9 reveals the characters of microstructure. The cross-sections ofXyarns andYyarns are an approximate rectangle, and that ofZyarns is circle. In the reconstructed model, the fiber volume fractions in the three direction ofX,YandZare 11%, 16% and 7.4%, respectively. Voids influence the stiffness and strength of C/C composites greatly, so it is important to model them accurately. The voids distribute desultorily. The volume of voids calculated by the reconstructed model is about 4.78%, agreeing with the experimental measurements of 4% to 5%. In order to verify the accuracy of the reconstructed model, a comparison to model from MIMICS is made, shown in Fig.10.
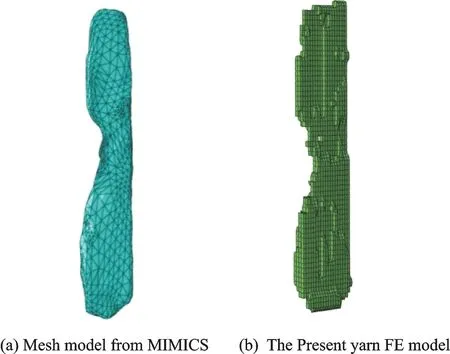
Fig.10 Comparison between models from MIMICS and the present work
Fig.10 shows that, the shapes of the two models are similar, but the qualities of the mesh are different. The model from MIMICS contains various dimensional tetrahedral elements and the mesh might be malformed in region where curvature varies sharply. This will lead to big computing error and irreal local stress prediction. The present model contains only hexahedral element with same dimensions and the mesh fineness is adjustable.
2 Elastic Property Prediction and Experiment Validity
Due to the periodicity and symmetry of the structure and loading, quarter of the reconstructed model is adopted for calculation of the elastic constants. The elastic modulus and Poisson ratio of carbon matrix is 11 GPa and 0.1, respectively. The yarns consist of T300 fibers whose relevant elastic constants are listed in Table 2.

Table 2 Elastic constants of T300
From statistics, average of sectional area ofXyarn is 0.29 mm2,Yyarn 0.43 mm2, andZyarn 0.52 mm2. The yarn inXandYdirections are double strands of 3 000 fiber bundles. The yarns inZdirection are triple strands of 3 000 fiber bundles. Since the diameter of T300 fiber is 7 μm, the filling rate of yarns inX,Y,Zdirections are estimated as 79.6%, 53.7% and 65.8%, respectively. The elastic constants of yarns can be obtained by hybrid method of two phases in composites[29]and the results are presented in Table 3.

Table 3 Elastic constants of yarns
In meso-scale, both the architecture and deformation of the fine weave pierced C/C composite are repeated in three spatial directions, therefore, periodic boundary conditions (PBC) must be applied to the unit cell FE model. The principle of PBC was detailed demonstrated by Xia et al.[30], and in ABAQUS. It could be achieved with multi-point constrains (MPC) technology. Finally, three uniaxial tensile loads and three pure shear loads are applied on the FE unit cell to obtain the total nine independent elastic constants for the orthogonal fine weave pierced C/C composite and the result is presented in Table 4.Local maximum principal stress in unit cell under unidirectional uniaxial tensile load alongYdirection is shown in Fig.11. For explicit illustration, the matrix elements are hidden. As expected, theYyarns undertaking most of the load and stress are observed not uniform in meso-scale because of the variation of cross sections and local undulation of yarn. The local stress concentration is important for further strength prediction.

Table 4 Elastic constants of C/C composites
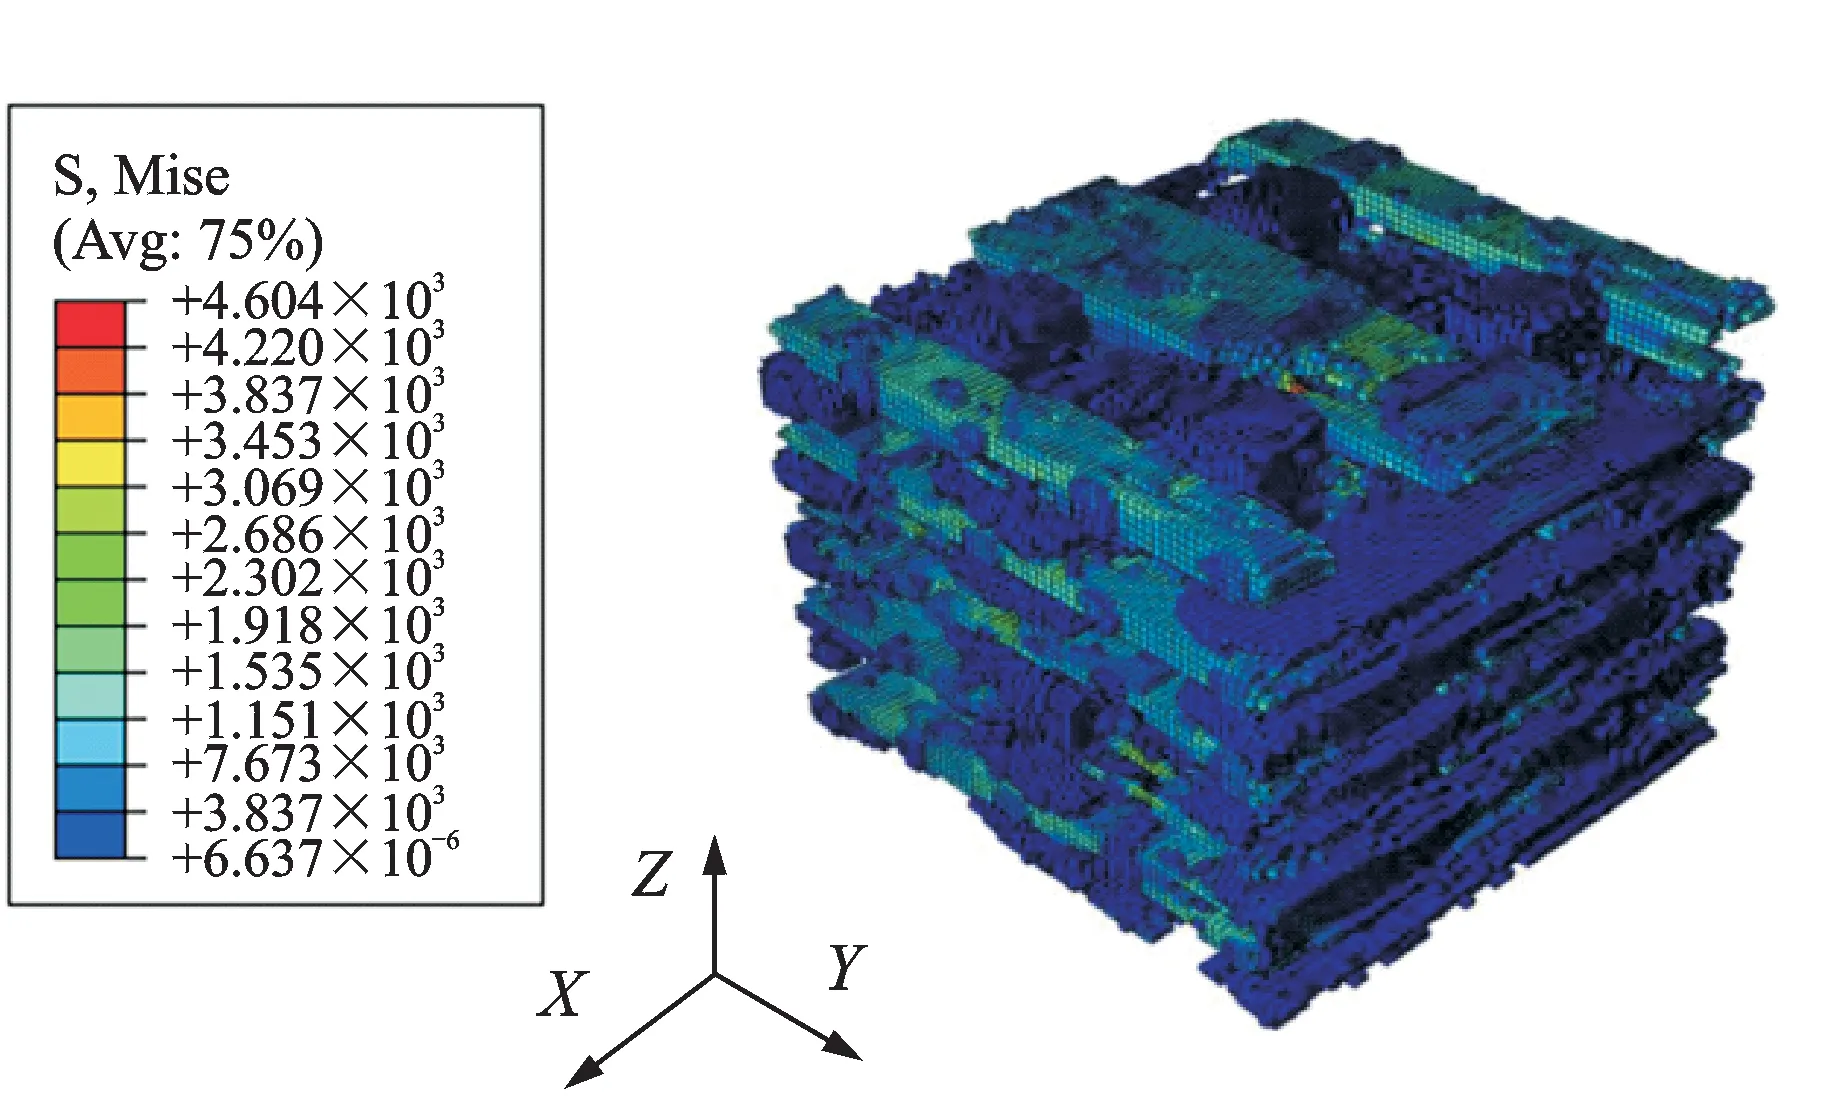
Fig.11 Mises-stress state distribution
Three-point bending test is performed for C/C composite to verify the FE results. Two kinds of specimens with dimensions of length(l)×width(b)×thickness(t)=74 mm×14.8 (or 18) mm×5 mm are prepared. Electronic universal testing machine (WDW-100) is used for loading and indenter displacement measurement. The experimental setup is shown in Fig.12.
For the test, the displacement loading speed is 0.5 mm/min and indenter force is recorded instantaneously. The elastic modulus is calculated as
(1)
where Δpand Δfare the force increment and the deflection increment, respectively. By averaging the measure data within linear elastic response scope, the experimental elastic modulus inYdirection is 27.82 GPa in average and 4.74% bigger than the FE prediction.
3 Conclusions
Based on results reported herein, several conclusions are drawn.
(1) The proposed two-step method can help extracting components from the low contrast micro-CT of C/C composite;
(2) The model reconstructed by the proposed procedures is accurate;
(3) The generated meshes of the model are high quality and controllable.
Acknowledgements
This work was supported by the National Natural Science Foundation of China (Nos.11272147, 10772078), the Aviation Science Foundation (No.2013ZF52074), the State Key Laboratory of Mechanical Structural Mechanics and Control (No.0214G02), and the Priority Academic Program Development of Jiangsu Higher Education Institutions (PAPD).
[1] Windhorst T, Blount G. Carbon-carbon composites: A summary of recent developments and applications [J]. Materials & Design, 1997, 18(1): 11-15.
[2] Fitzer E. The future of carbon-carbon composites [J]. Carbon, 1987, 25(2): 163-190.
[3] Luo Ruiying. Present study situation and technology of preparation for carbon/carbon composites[J]. Ordnance Material Science and Engineering, 1998, 21(1): 62-66.
[4] Buckley D, Edie D D. Carbon-carbon materials and composites [M]. New Jersey, USA: Noyes Publications, 1993:1-2.
[5] Sheehan J E, Buesking K W, Sullivan B J. Carbon-carbon composites [J]. Annual Review of Materials Science, 1994, 24: 19-44.
[6] Chareire J L, Dupupet G. Brake disc of carbon-carbon composite material:US 4457967[P]. 1984-7-3.
[7] Siron O, Lamon J. Damage and failure mechanisms of A3-directional carbon/carbon composite under uniaxial tensile and shear loads [J]. Acta Materialia, 1998, 46(8): 6631-6643.
[8] Aly-Hassan M S, Hatta H, Wakayama S, et al. Comparison of 2D and 3D carbon/carbon composites with respect to damage and fracture resistance[J]. Carbon, 2003, 41(5): 1069-1078.
[9] Han J C, He X D, Du S Y. Oxidation and ablation of 3D carbon-carbon composite at up to 3000 °C[J]. Carbon, 1995, 33(4): 473-478.
[10]Jacobson N S, Curry D M. Oxidation microstructure studies of reinforced carbon/carbon [J]. Carbon, 2006, 44(7): 1142-1150.
[11]Landis E N, Keane D T. X-ray micro-tomography [J]. Materials Characterization, 2010, 61(12): 1305-1316.
[12]Feng Yanzhang, Feng Zude, Li Siwei, et al. Micro-CT characterization on microstructure of C/SiC composites [J]. Journal of Aeronautical Materials, 2011(2): 49-54.
[13]Somashekar A A, Bickerton S, Bhattacharyya D. Compression deformation of a biaxial stitched glass fibre reinforcement: Visualisation and image analysis using X-ray micro-CT [J]. Composites Part A: Applied Science and Manufacturing, 2011, 42(2): 140-150.
[14]Feng Yanzhang, Feng Zude, Liu Yongsheng, et al. Micro-CT analysis of high temperature creep damage of 2D C/SiC composites [J]. Heat Treatment of Metals, 2011, 36(S1): 482-485.
[15]Liang Limin, Yu Hongfa, Pan Zhefeng. Actual meso-structure based three-dimensional reconstruction of porous concrete [J]. Journal of Hohai University: Natural Science, 2010, 38(4):424-427.
[16]Qin Wu, Du Chengbin. Meso-level model of three-dimensional concrete based on the CT slices [J]. Engineering Mechanics, 2012, 29(7):186-193.
[17]Jiang Yuan, Bai Wei, Qi Yongle, et al. Reconstruction of 3D model of concrete mesa structure with CT original data [J]. Journal of China Three Gorges University: Natural Sciences, 2008, 30(1): 52-55.
[18]Mu Weibin, Zhang Shuli. Investigation and achievement of three dimensions reconstruction for CT fault image by Matlab [J]. Journal of Qiqihar University, 2009, 25(1): 33-35.
[19]Li Peng, Wang Min, Qi Xiaoli. Mechanical properties of aluminum foam based on synchrotron radiation computed-tomography[J]. Journal of Material Science & Engineering, 2011, 296:916-919.
[20]Vesenjak M, Veyhl C, Fiedler T. Analysis of anisotropy and strain rate sensitivity of open-cell metal foam[J]. Materials Science and Engineering: A, 2012, 541(16): 105-109.
[21]Helfen L, Baumbach T, Stanzick H, et al. Viewing the early stage of metal foam formation by computed tomography using synchrotron radiation [J]. Advanced Engineering Materials, 2002, 4(10): 808-813.
[22]Martín-Herrero J, Germain C. Microstructure reconstruction of fibrous C/C composites from X-ray micro tomography [J]. Carbon, 2007, 45(6): 1242-1253.
[23]Martín-Herrero J. Hybrid object labelling in digital images [J]. Machine Vision and Applications, 2007, 18(11): 1-15.
[24]Kan Jin. Micro and meso structures and their influence on effective properties of carbon/carbon composites [D]. Heilongjiang: Harbin Institute of Technology, 2010.(in Chinese)
[25]Sharma R, Mahajan P, Mittal R K. Image-based finite element analysis of 3D-orthogonal carbon-carbon composite[C]∥Proceedings of the World Congress on Engineering. London, UK:WCE,2010:1597-1601.
[26]Zeng Zheng, Dong Fanghua, Chen Xiao, et al. Three dimensions reconstruction of CT image by MATLAB [J]. CT Theory and Applications, 2004, 13(2): 24-29.
[27]Zhang Aidong, Li Ju, Sun Lingxia. Three dimensional reconstruction of continuous ICT images by MATLAB [J]. Nuclear Electronics & Detection T echnology, 2006, 2604: 489-491.
[28]Nixon M S, Aguado A S. Feature extraction and image processing second edition [M].Li Shiying, Yang Gaobo, translator. Beijing: Publishing House of Electronics Industry, 2011.
[29]Chamis C C. Mechanics of composite materials: Past, present and future [R]. NASA TM- 100793, 1989.
[30]Xia Z, Zhou C, Yong Q, et al. On selection of repeated unit cell model and application of unified periodic boundary conditions in micro-mechanical analysis of composites [J]. International Journal of Solids and Structures, 2006, 43(2): 266-278.
(Executive Editor: Zhang Bei)
TB322 Document code: A Article ID: 1005-1120(2015)06-0639-07
*Corresponding author: Zhou Chuwei, Professor, E-mail: zcw@nuaa.edu.cn.
How to cite this article: Zhang Haijun,Zhou Chuwei. Three-dimensional reconstructed finite element model for C/C composites by micro-CT[J].Trans.Nanjing U.Aero.Astro., 2015, 32(6):639-645. http://dx.doi.org/10.16356/j.1005-1120.2015.06.639
 Transactions of Nanjing University of Aeronautics and Astronautics2015年6期
- Transactions of Nanjing University of Aeronautics and Astronautics的其它文章
- Modeling and Identification Approach for Tripod Machine Tools
- Three-Dimensional Planning of Arrival and Departure Route Network Based on Improved Ant-Colony Algorithm
- Prediction of Compressive and Shear Moduli of X-cor Sandwich Structures for Aeronautic Engineering
- Infrared Heating Technology for Automated Fiber Placement
- Effect of Tip-Blade Cutting on the Performance of Large Scale Axial Fan
- Mechanical Behavior of Bistable Bump Surface for Morphing Inlet
