
A Methodology to Measure the Environmental Impact of ICT Operating Systems across Different Device Platforms
2015-02-13 01:57:20DanielWilliamsandYinshanTang
Daniel R. Williams and Yinshan Tang
A Methodology to Measure the Environmental Impact of ICT Operating Systems across Different Device Platforms
Daniel R. Williams and Yinshan Tang
—A new methodology was created to measure the energy consumption and related green house gas (GHG) emissions of a computer operating system (OS) across different device platforms. The methodology involved the direct power measurement of devices under different activity states. In order to include all aspects of an OS, the methodology included measurements in various OS modes, whilst uniquely, also incorporating measurements when running an array of defined software activities, so as to include OS application management features. The methodology was demonstrated on a laptop and phone that could each run multiple OSs, results confirmed that OS can significantly impact the energy consumption of devices. In particular, the new versions of the Microsoft Windows OS were tested and highlighted significant differences between the OS versions on the same hardware. The developed methodology could enable a greater awareness of energy consumption, during both the software development and software marketing processes.1
Index Terms—Environment, green information and communications technology, operating system, sustainability.
1. Introduction
Operating systems (OSs) run and manage the devices, applications, and processes that form the foundations of modern computing. Therefore, OSs are a logical starting point of any information and communications technology (ICT) related environmental strategy aiming at reducing energy consumption and related green house gas (GHG) emissions. OSs utilise device hardware for its own operation and to host and manage various software activities and services. Additionally, an OS is often intrinsically linked to the software it runs, through drivers and process controls. The manner in which an OS utilises a device and its components is a combination of the device and OS design. Additionally, any software activity and service is also dependant on the OS configuration. Consequently, in theory, because the OS can manage a device and software differently, the energy consumption of each device could be variable, and be designed towards energy efficiency.
There is little academic research into the methods used to measure the OS energy efficiency and related GHG emissions. Commercial studies[1],[2]have attempted to measure OS in an attempt to highlight that newer versions of the Microsoft Windows OSs were more energy efficient than previous versions. One study[2]found that when a device was in active mode, Windows 7’s power consumption was an average of 10.60% lower than Windows XP. However, few scientific justifications, details, or data were provided to verify this claim. A commercial certification scheme[3]which aims to quantify the typical energy consumption of devices is popular with many device manufacturers. The method to calculate the energy consumption is, however, based upon assumptions of use and does not measure device power consumption in detail nor with a focus on the OS and activity efficiency.
The OS can execute and manage additional software in different manners, and thus should also be analysed in terms of energy consumption and efficiency. There are existing methods to measure the energy consumption of software which can be broadly split into two areas of hardware[4]-[11]and software measurement[12]-[17]. The purpose of these methods is often either for very detailed information of a software process, utilised for the development phase of software or hardware, or used to estimate the effectiveness of a process[18]. Yet, few methods focus upon the end user energy impact and are either highly technical or highly OS, device, and software dependant. One brief study[11]did focus upon end user impact and highlighted the importance of end user software selection.Yet, this study did not highlight a technically sound measurement method across many device types.
Hardware based methods of measuring software’s energy consumption show that it is a relatively simple undertaking to measure the energy consumption of a device running an OS and software. However, measuring and apportioning the specific energy or environmental impact of the OS or a software activity is a complex task. Often, only the device’s total hardware power consumption is measured and reported, primarily because of the simplicity in measurement technique[3]. The power consumption and energy efficiency of the OS and software activity is thus overlooked because of the operational complexities. Simply dividing the measured energy consumption equally between the OS and the number of software activities can be problematic as the services being run are not necessarily related and can use varying and disproportionate amounts of a device’s resource and thus energy.
This research aims to create a methodology to measure and describe OS’s impact on device energy consumption and related environmental impact, regardless of its device type or platform. This involves two goals, firstly to define and measure the OS energy consumption, and secondly to measure an OS ability to efficiently run a range of software. In order to validate the method, a laptop and phone will be used which are able to use multiple OSs.
2. Proposed Methodology Scope
For this research the OS impact was defined as the energy consumption of the OS in various states, plus the energy consumption of running a variety of software activities. This broad definition ensured that a wide aspect of the OS capabilities was encompassed, including not only its static (idle) state, but also its execution of other software. Microsoft consumer OSs were chosen as the subject of analysis as they represented the most populous of all OSs in existence. A laptop and phone (Table S1 in the supporting information) were selected for testing as they represented an array of current and accessible hardware. Both devices were designed to support a variety of OS versions. Each device was required to have specific OS support so as to take advantage of any OS specific drivers for the device.
For the laptop, 64 bit versions of the OS were installed apart from Windows XP where a 32 bit version was used. Although a 64 bit version of Windows XP is now available, Windows XP was designed for 32 bit computing only, and few devices fully support it. Each version utilises certain components differently, and for the 32 bit version in some cases not all device capability was supported. For example, the total memory (RAM) support for 32 bit versions of Windows is 4 GB and 16 TB for 64 bit versions. Therefore, results were expected to differ somewhat more significantly between the 32 bit and 64 bit versions.
A device’s idle and standby modes were used to represent the OS energy consumption; informed from previous research on the common energy states of a device[19]. Idle and standby were allocated to the OS, as any other mode, such as ‘active mode’ would contain the influence of other software applications. Additionally, within idle mode, two further distinctions of device connectivity state and monitor brightness level were defined to represent two significant energy consuming device components. Device connectivity was analysed using the wireless networking adapter of each device in either an on or off mode. The brightness level was determined as significant to energy consumption as a majority of devices include automatic brightness controls. For monitor brightness, a high, medium, or low display brightness level was defined and related to the range of brightness level that the display monitor could achieve by OS control. Thus, high was 100%, medium 50%, and low 0% of the brightness range (i.e. 0% is not completely blank, but the lowest brightness level of the monitor).
An array of common consumer and business software activities that could be undertaken on both devices were defined (Table 1). Although not exhaustive, the activities selected were determined by Microsoft sales and marketing teams to be some of the most common performed on the OS, which were also comparable across device platforms. Additionally, a wide selection of activities was selected in order to include the use of device components such as the graphics, audio, screen, camera, and wireless adapter. Each activity was performed using the high brightness level (to simplify testing) and using a defined connectivity state. In the case of test 7 (game), the test was completed in both connectivity on and off modes as some advertisements were displayed, which utilised the data connection. Each activity was specified with sub activities, timings, and actions to be completed. Activities that utilised external processing elements (such as cloud computing) were not included; although, they are not excluded from the concept of this study but would require measurements and data from many different stakeholders, methods for which are available[20]. Multi-tasking software services were also excluded from the scope of testing, as the OS and software activity energy consumption was the prime target of interest.
3. Proposed Energy Measurement and Apportionment Method
This section describes the method that was created to measure the energy consumption of the defined OS states and apportion to the various software activities. None of the investigated methods approach the subject with the goal of wanting to rapidly complete the process across a number of devices and OSs. In order to create a new method, previous methods, which can be split into hardware and software based energy measurement, were reviewed and used as foundations.
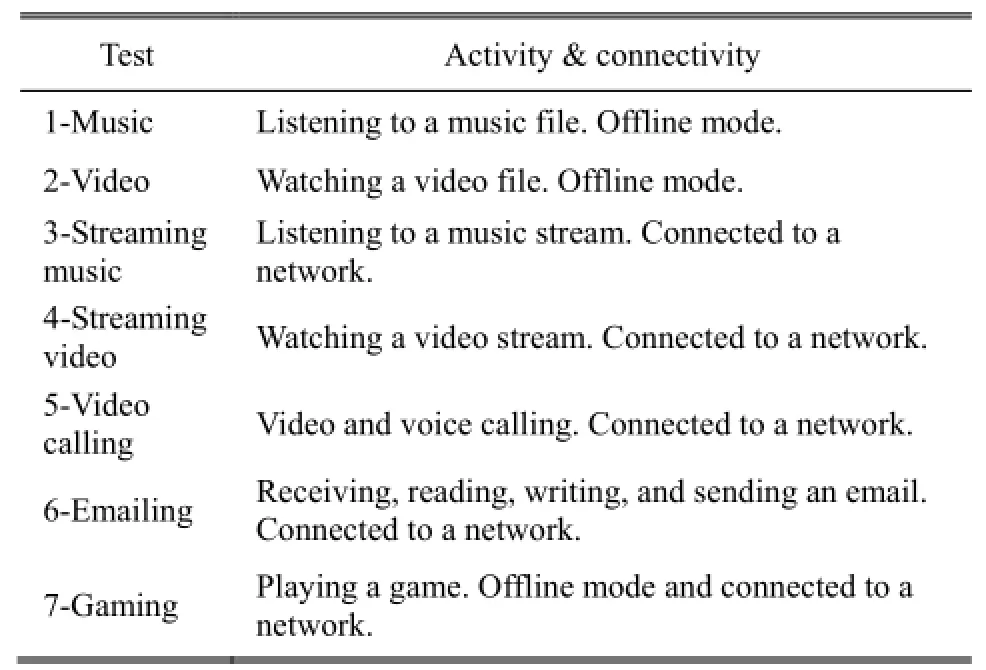
Table 1: Summary of the activities tested
Hardware measurement involves using a combination of device or component level power meters to directly measure power consumption, and the results are often very precise. A number of studies[4]-[9]have utilised hardware measurement, and all used instruments to measure the voltage and current of the device are analysed[21],[22].
Software measurement utilises the OS measured system resource of a software service and integrates this into a mathematical model which has prebuilt or real-time information about the hardware’s power consumption range[12]-[16]. Software measurement is often not precise but can be a useful approximation of energy consumption. It is also quicker and requires less technical skill and device preparation. However, software measurement is often performed without hardware measurement, which can provide inaccurate results where actual power measurement is estimated from secondary data. If the secondary data is not exactly for the device being analysed, the estimation process will become flawed and open to misinterpretation. Thus, the ideal scenario is a device that is measured by a hardware measurement device and is integrated directly into a software measurement tool. This is often achieved in highly technical and specific projects[12]-[16].
3.1 Method Choice
For this research, a method was required to accurately measure device power at the defined OS states whilst performing the prescribed software based activities. Crucially, the method was required to be applicable and operational across different OSs and hardware devices. The individual device component based detail was not required, however, the method was required to apportion the software activity from the OS and any other activity being performed at the same time.
Hardware based power measurement was selected as it fulfilled all measurement requirements, although it was acknowledged to be more time consuming than software measurement. Software based power measurement would not be useful for this method as each of the software measurement methods reviewed relied upon a particular OS type, and thus was difficult or not transferable between different OSs. This was particularly evident with the Windows Phone OS which had no software measurement method currently available. Conversely, hardware power measurement was found to be accurate and could be performed across any device, albeit with some degree of technical proficiency. It was noted that if the scope of testing relied upon only one OS, such as Microsoft Windows, then software measurement could have been utilised and would have been quicker and require less device technical knowledge.
3.2 Device Preparation
Before the assessment, each device was specifically configured in order to maximise control over the testing process. Following guidance[23],[24], each device was prepared to minimise the impact of any other OS process interfering with the test and the results. Details of the specific device preparation can be found in the supplementary information (Section 2).
3.3 Measuring Device Energy Consumption
A PC oscilloscope was utilised (‘PicoScope 2204’) to measure the power consumption of each device. Each device was turned on for at least 30 minutes before testing to allow for internal temperature adjustment. The room temperature was taken during each measurement and was kept within a ±2°C variance around 19°C. Where relevant the connectivity state of each device was also set and the device restarted to ensure the state was entered. Where the device was being measured using wireless networks, the device was placed within 2 meters of the wireless adapter (‘TP-Link WA830RE access point’) to ensure that the signal was constant and of a high quality. Where the use of a mobile data network was required, each device was placed in the same physical location and the same network signal was utilised. The U.K. ‘Orange/EE’ High Speed Packet Access (HSPA) signal was used, which was in the 80% to 100% quality range during testing.
For each device, a previously defined method[20]was utilised to measure power consumption. In summary, before testing the devices, any batteries were removed to exclude charging overhead. The oscilloscope was used to measure the power consumption of the laptop and tablet using a custom made extension. For each test activity, three repeats were performed to ensure the range of measurement was suitable and was assessed using a statistical check. Although three repeats are statistically not a large sample, low measurement precision was required for the purpose of the methodology.
The method[20]was altered in the case of measuring power consumption on the phone, which presented particularly difficult measurement conditions. Unlike the laptop, the phone could not be powered without the battery being present, meaning the previously made custom extension could not be utilised. To add complication, thephone’s battery was sealed within its casing and was not removable and connected directly into the phones motherboard with a small section of wiring. Consequently, to measure power, the phone was opened and the batteries negative wire was identified, cut, and extended to include a 0.01 Ω sense resistor, plus further wire so that three oscilloscope probes could attach to measure voltage and current. A small section of the batteries positive wire’s sheathing was removed so an oscilloscope probe could be attached to measure voltage. The phone battery charge level was kept between 50% and 90% to reduce any possible measurement differences.
For both devices, voltage and current measurements were recorded every 5 milliseconds (ms) (200 Hz) over the course of each activity test. This recording frequency was considered acceptable after a number of initial tests completed with a 1 GHz oscilloscope did not report a significant difference in total energy consumption. For each measurement taken, the power consumption (watts) was subsequently calculated. Using the defined timing for each test, the activity related power measurements were identified and summed, and multiplied by the recording frequency (5 ms) to calculate the total energy consumed (Joules). This was then converted into a 60 minute watthour (Wh) equivalent value by dividing the energy consumed (Joules) by the total time (seconds) of the test period.
3.4 Apportionment Techniques
The measured energy consumption of each activity test included both the OS and software activity being performed. Therefore, in order to apportion the total consumption between the OS and software, the measured idle power consumption of the OS was subtracted, and the difference between the software activity energy and the OS idle state was then attributed to the software activity. A full explanation of this method can be found in [20]. For all devices, idle mode was measured whilst the device was in the ‘desktop’ mode for Windows OS or ‘screen brightness setting’ mode for the phone.
· AMOLED Screens
A supplementary step was added to the method to measure the idle power consumption for the phone. The phone under test had the capability of varying power consumption according to the colour of the screen, where white is all colours and thus maximizes the power. Therefore, idle power consumption was a range that required an average to be calculated. The display technology utilised was an active-matrix organic lightemitting diode (AMOLED) and is currently being more commonly used by smart phone manufacturers. This assessment was performed as a primary power consumption feature of the phone was an auto-brightness feature (which was turned off according to the scope) and assumed therefore that the maximum brightness level on a white screen would rarely be achieved.
In order to determine an average idle power consumption value for the phone, it was tested twice using the defined idle method, with a black and white background configuration. During testing the majority of the background was covered with either the same number of black or white pixels. The Windows Phone OS menu coincidently has a black or white background choice. The percentage increase in power consumption between black and white was calculated. This percentage increase was assessed over the three different brightness levels that the phone could achieve (low, medium, and high). In order to calculate the final average idle value of the phone, the increase in power consumption for each brightness level was averaged and it was assumed that the screen would typically have 25% white pixels at one time. The power consumption average increase was then calculated using the black idle level as a baseline, and combined with the black idle level to provide an overall idle power consumption value.
3.5 Environmental Impact Emissions Factors
The environmental impact was calculated from the measured energy consumption and described in terms of grams of carbon dioxide equivalent (CO2e). To complete the calculation, an average U.K. domestic electricity consumer emissions factor was used[25].
4. Results
The OS and software activity energy consumption measurement and apportionment results for each device and OS combination are presented in Section 4.1 and Section 3.1 of the supporting information document. This is followed by an examination of how variable the energy measurements were by calculating the relative standard error (Section 4.2 and Section 3.2 of the supporting document). In Section 4.3, the variation between OSs on the same device is illustrated and in Section 4.4 results are interpreted in a use model.
4.1 OS and Software Energy Measurement and Apportionment
The energy consumption of each device and OS combination was measured, and the software activity energy apportioned using the techniques described in Section 3.4. The energy consumption (Wh), environmental impact (grams of CO2e), and energy percentage increase over idle of each test are presented in the supporting document Table S3-S8.
In order to determine the idle energy consumption of the phone, the method described in Section 3.4 was used along with the measured data described in Table 2.
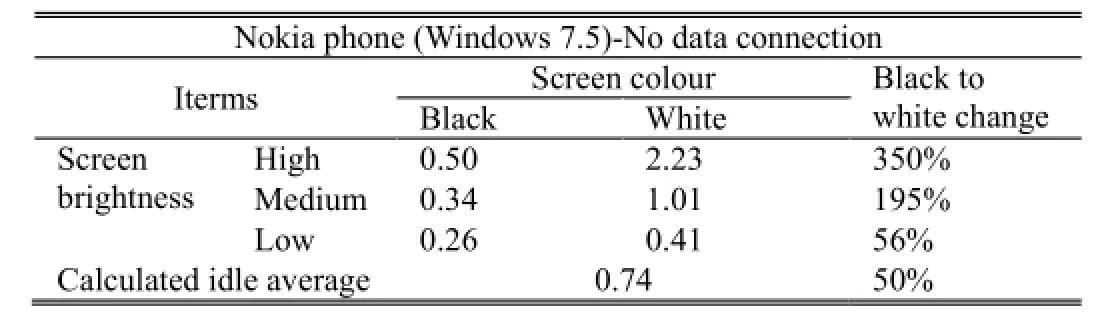
Table 2: Energy consumption (W) and calculated idle average for the phone
4.2 Measurement Variation
The relative standard error (RSE) of each test’s energy consumption on each device and OS combination was calculated and analysed within Table S9 and Section 3.2 of the supporting document. This was used to determine how variable the tests were, indicating how reliable the results would be.
4.3 Operating System Variation
The energy consumption of each OS state (idle and standby) and software activity was measured using a variety of OSs for each device. Therefore, the energy consumption of each test for the laptop and phone was compared side by side in Fig. 1 and Fig. 2 for OS states, and in Fig. 3 and Fig. 4 for activities. Windows XP and Windows Phone OS 7.5 were selected as relevant baselines to compare energy consumption to other related OS versions as it was the first OS released.
4.4 Interpreting Results
In order to interpret and communicate results based on overall OS performance, each device’s results were processed using two use models (Table S10 and S11 in the supporting document) and compared to a baseline. For both devices, the first released OS was set as the baseline OS; Windows XP for the laptop and Windows Phone OS 7.5 for the phone. The first use model set all activities to an equal time of 1 hour, and the second was created based upon an approximation of use time that was assumed to reflect standard and generic user. The results of each use model are presented in Table 3 and Table 4.
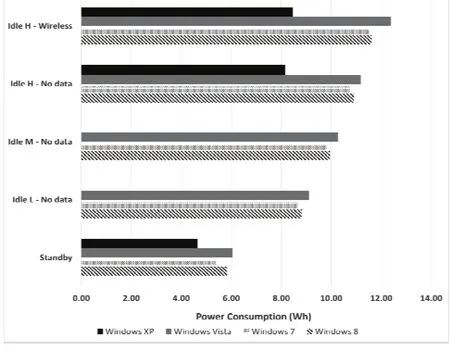
Fig. 1. Energy consumption across OS states for the laptop against different OSs.
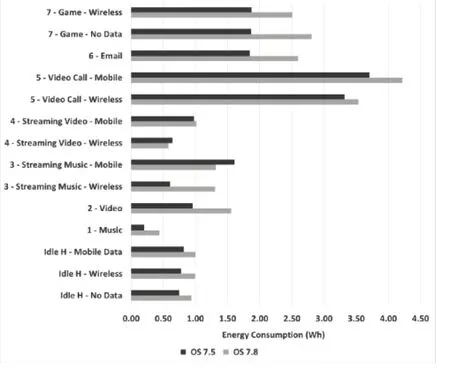
Fig. 2. Energy consumption across OS states for the phone against different OSs.
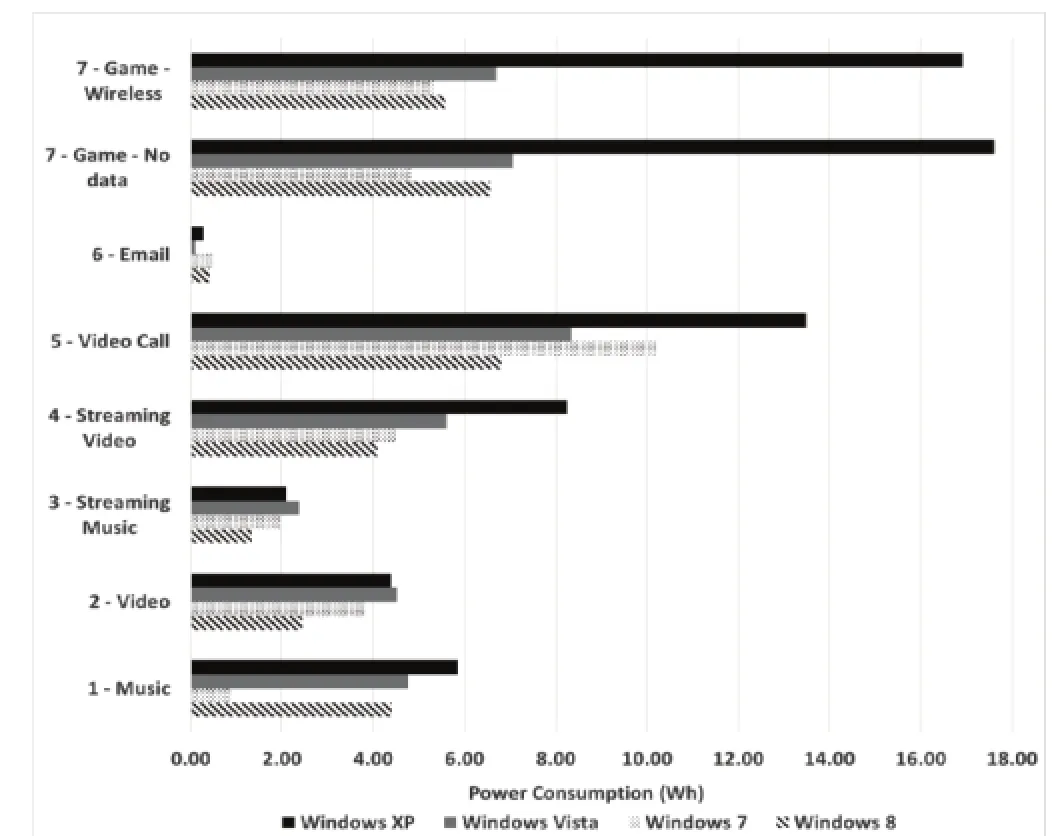
Fig. 3. Energy consumption across activities for the laptop against different OSs.
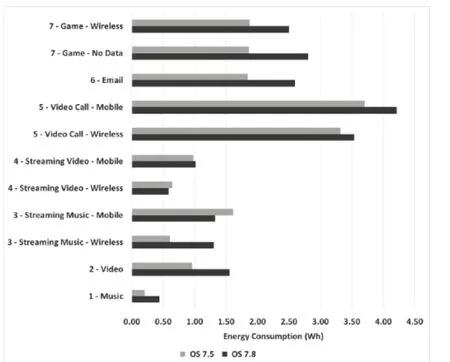
Fig. 4. Energy consumption across activities for the phone against different OSs.
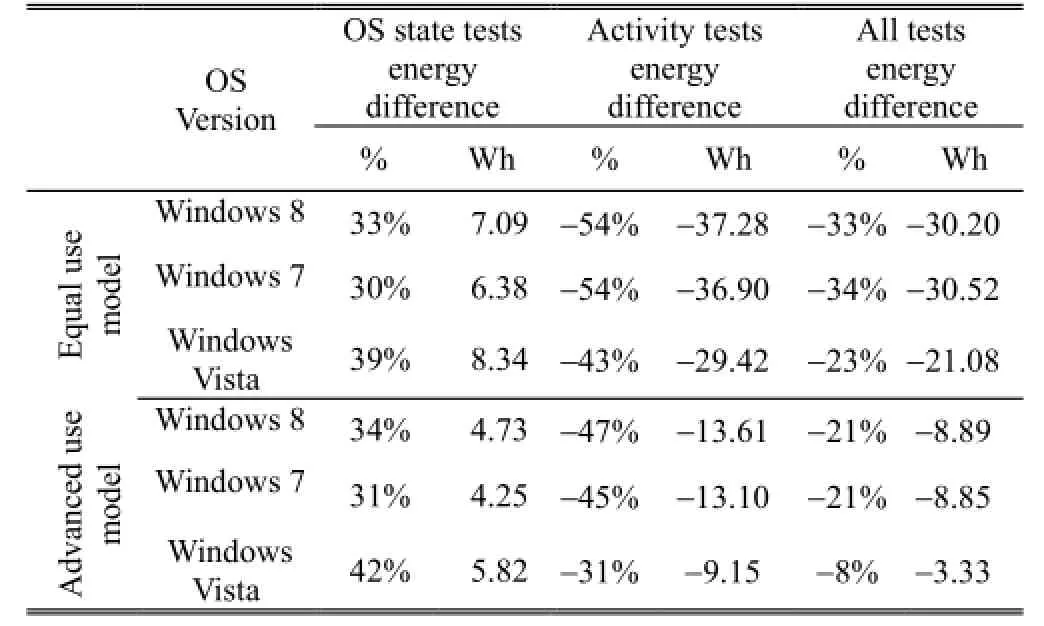
Table 3: Laptop energy differences using Windows XP results as baseline
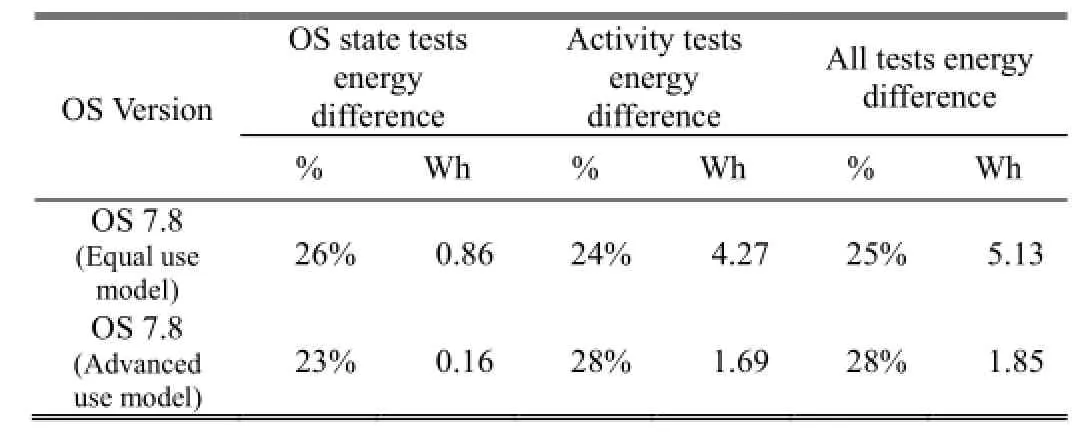
Table 4: Phone energy differences using Windows OS 7.5 results as baseline
5. Discussion
5.1 Methodology Discussion
A new method was created to measure the energy consumption of a device whilst in various OS modes and when performing software activities. The apportionment of a software activity’s energy consumption involved calculating the difference in energy consumption between a device’s idle state and the device’s activity state. The measurement technique utilised highly accurate direct power measurements, in order to overcome the cross device and cross platform requirements of the study. The hardware measurement method utilised for testing required specific technical skills to undertake; conversely, the application was simple, inexpensive, and provided accurate results.
Although the measurement of energy consumption was highly accurate, the method of apportionment was based upon a measureable difference in power consumption between idle and active device states. This, therefore, presented an area of uncertainty in the results as exact processes between idle and active state were not known. Uncertainty in this area was minimised as the OS and software on each device were prepared and tested with a high degree of controllability. Although the devices were controllable, the ability to directly relate what was being processed by the device to energy consumption was not possible. This could be especially important where the scope of analysis was extended to focus upon performing more than one software activity at once (i.e. multitasking). Software methods of energy consumption measurement (Section 3) could be ideal to mitigate this uncertainty, although they are difficult to consistently setup across different software platforms and devices.
The influence of power management was minimised during testing, which limits this research result as the full environmental impact of the device and OS is not necessarily represented. This becomes particularly apparent when analysing devices which are maximised to use power management features and maximise battery life, such as phones. Additionally, some software activities did not require the use of the screen, such as the music tests. By default they would have initiated either a screen dim or screen off mode, thus reducing power consumption of the software. The measurement method employed required the OS power management to be minimised during testing to maximise controllability and ensure cross platform comparability. Device features such as automatic display dimming, standby modes, and OS CPU throttling did not operate (hardware CPU throttling did still occur). In order to include the impact of power management, each test could be specified and include a default power management configuration, and results be communicated accordingly. For example, the phone tested had a light sensor to dim or brighten the screen based upon external light levels, therefore variably influencing the power consumption across every OS state and software activity. To include this feature in this method, power management could be turned on and tests could be conducted within a light controlled environment, whereby each set of tests is repeated under varying levels of light intensity.
The overhead power consumption of the power adapter and battery charging circuitry was excluded from the scope of this research. Both were excluded because of the technical complexity involved to measure the impact and because the power consumption measurement results reported in this research are likely to be lower than the actual power drawn from the mains electricity. Some manufacturers may create more energy efficient power adapters or charging systems than others, and thus should be included in the overall environmental impact. Both the power adapter and battery charging circuitry will dissipate some energy[6],[26]when charging the device battery, and the battery will often degrade in efficiency terms over its lifetime. Despite being a difficult element to test, the measured efficiency levels of both will not change between different OSs and software, and thus repeat testing would be minimal.
The scope of this research included running one software activity, and excluded multiple services running at the same time (i.e. multi-tasking). Therefore, the methodology has excluded the possibilities of OS energy efficiencies that are only gained when running multiple activities, which is especially important to the serverdevices and OSs. Most modern OSs are designed to run multiple software activities at once, and some promote it as a feature. Indeed, an OS can share resource when similar operations are being carried out, and the server OS employs virtualisation techniques to maximise efficiency. Nevertheless, the method described in this research could be extended to add multi-tasking software scenarios, and still the difference in power consumption would highlight if efficiencies exist. The results, however, would not be attributable to one single software activity, rather a defined set of activities. Additionally, a modification would be required to the method used to define idle power, as it would be supporting multiple software activities and therefore would need to be apportioned between the multiple activities. These issues have been explored in a separate research project led by the author of this research[23].
5.2 Result Verification
Measurement results were difficult to verify as there was little data published by the device manufacturers to compare results. Section 4.1 of the supporting document details an approximate method used to confirm results were within a sensible range.
5.3 Result Discussion
The new methodology was demonstrated and informed by measuring and calculating the energy consumption and related GHG emissions of a laptop and phone across different OSs. The results demonstrated that an OS can make a significant difference to a device’s idle and activity state power consumption, thus highlighting the requirement for such a method to be created.
Results substantiated the significance of the screen brightness levels and connectivity states of each device. For screen brightness, the laptop, on average, reduced energy consumption by 8% and 19% for medium and low brightness levels respectively, using high level brightness as a baseline. The phone, on average, reduced energy consumption by 21% and 38% for medium and low brightness levels respectively. For wireless connectivity, the laptop and phone in OS idle states on average reduced energy consumption by 7% and 5% respectively, when the wireless and mobile (where relevant) connection was disabled. For the phone (with mobile connectivity), an average reduction in energy consumption of 8% was observed when the mobile and wireless connections were disabled. For activity tests, similar patterns were observed, although, for test 7 (game) on the laptop, where wireless was activated, the activity energy consumption was on average 4% lower than when the wireless connectivity was disabled. This minor difference could not be explained and requires further investigation at the level of the software coding.
For the laptop tests, an interesting result was observed for test 1 (music) and test 2 (video). One might expect music to consume less energy than video due to the higher visual processing required by video playback. This was not the case for the laptop when running in Windows 8, Windows Vista and Windows XP, but was the case for Windows 7 and the phone tests. The unexpected results were explained by the OS having music software that visualised the audio signal on screen, based upon a signal analysis of the audio playback, thus increasing the processing power required by the device. In Windows 7, the audio visual playback was turned off by default and thus music consumed significantly lower amounts of energy than video.
The laptop OS comparison results are useful in illustrating that OS design and technical configuration can impact the power consumption of the device. In particular, this fact is highlighted by the result of Windows XP’s idle power consumption results being significantly lower than all other versions of the OS. This was determined to be contributed by a number of different variables. Firstly, hardware driver differences were found to play some part. Secondly, Windows XP’s low graphics requirement and older design simply demanded less power to host idle state. Finally, Windows XP was a 32 bit version of the Windows OS and so utilised device resources differently to the 64 bit versions. The 64 bit version was not included for testing as it was not officially supported by the laptop. Further explanation and testing can be found in Section 4.2 of the supporting document.
Device OS results, presented in Section 4.3, highlight that the energy consumption differences for each test are not uniform between different versions. This means that using either an OS state or activity’s energy consumption result in isolation does not reflect the energy performance of a device. For example, for the laptop with all OS state tests, all newer versions of Windows increased energy consumption; however, for most activity tests all newer versions of Windows reduced energy consumption. These results were collectively interpreted in Section 4.4 through analysing the energy difference of an OS by summing OS state and activity results based upon a use model. The use model highlights that when communicating environmental impact, the device use scenario should be communicated, too, as it can affect the outcome significantly.
The OS comparison tests on the phone highlighted the importance of understanding the coding changes between OSs. The significant energy consumption difference that was measured, was not expected between the 7.5 to 7.8 OSs on the phone, as the changes were advertised publicly as cosmetic with little added functionality. Without further information from the phone software and hardware manufacturer on the actual changes between the OSs, it was not possible to determine why this difference was measured. Phone OS details, drivers, and hardware settings arecommonly difficult to gain access to, and not possible to the public on the Windows Phone platform. In order to investigate this change fully, an official log of changes between the OSs is required.
6. Conclusions
This research has described a new methodology that is able to measure and describe a consumer OS’s impact on a device’s energy consumption, and related GHG emissions. Uniquely, in order to include all aspects of an OS range of control, the new methodology included the individual analysis of a set of OS power states and software activities that were run by the OS. Technically, the direct power measurements of devices were involved, and used a technique to rapidly apportion device energy to a software activity from the OS’s own energy footprint. The methodology was both informed and demonstrated using a laptop and phone that could each run multiple OSs.
The results indicate that an OS and activity, both separately and combined, can significantly impact the energy consumption of a device. Laptop results also suggest that the latest versions of the Microsoft Windows OS are more energy efficient. Conversely, phone results imply that the later version of the Windows Phone OS is less energy efficient. A use model was applied and highlighted that the energy efficiency of an OS should be determined according to the specific use of the device.
The methodology developed has two main implications. Firstly, it could enable a greater awareness of energy consumption during the software development process as the method is standardised and publicly available. Additionally, the results could be used for communication activities for the software vendor, rigorously proving results unlike some past studies[2].
A phone and laptop, both running popular OSs, were used to inform and demonstrate the new methodology. There are many different device types and OSs combinations currently available to the consumer with which this methodology should be tested. We believe that although limited, the devices used to demonstrate the methodology are likely to represent the common functions and technical operation of a laptop and phone available today. It is hoped that this methodology and approach will be used on further devices to extend its validity and usefulness.
Appendix
A supporting information document is available online only.
[1] P. Lahoty and R. Nataraja. (2009). Green computing with Windows 7. [Online]. Available: http://download.microsoft. com/download/D/A/6/DA638155-DAF4-4E00-81196FC9B-12AA94D/GreenComputingwithWindows7Ver1.pdf
[2] A. Hacker. (2010). Maximizing the impact of effective power management with Windows 7. [Online]. Available: http://www.thewindowsclub.com/green-computing-energysavings-with-windows-7
[3] The Energy Star Program, ENERGY STAR®Program Requirements for Computers Version 6.1, Energy Star, 2014.
[4] S. Assim, “Power consumption in handheld computers,” in Proc. of IEEE Asia Pacific Conf. on Circuits and Systems, Singapore, 2006, pp. 1721-1724.
[5] W. L. Bircher and L. K. John, “Complete system power estimation: A trickle-down approach based on performance events,” in Proc. of IEEE Intl. Symposium on Performance Analysis of Systems & Software, 2007, pp. 158-168.
[6] A. Carroll and G. Heiser, “An analysis of power consumption in a smart phone,” in Proc. of the 2010 USENIX Annual Technical. Conf. on USENIX, Boston, 2010, pp. 1-14.
[7.] A. Pathak, Y.-C. Hu, and M. Zhang, “Where is the energy spent inside my app?: Fine grained energy accounting on smartphones with Eprof,” in Proc. of the 7th ACM European Conf. on Computer Systems, Bern, 2012, pp. 29-42.
[8] A. Rice and S. Hay, “Decomposing power measurements for mobile devices,” in IEEE Intl. Conf. on Pervasive Computing and Communications, 2010, pp. 70-78.
[9] R. A. Giri, “Increasing data center efficiency with server power measurements,” in IT@Intel White Paper, 2010.
[10] E. J. Vergara, S. Nadjm-Tehrani, and M. Prihodko,“EnergyBox: Disclosing the wireless transmission energy cost for mobile devices,” Sustainable Computing: Informatics and Systems, vol. 4, no. 2, 2014, pp. 118-135.
[11] C. Zhang, A. Hindle, and D. M. German, “The impact of user choice on energy consumption,” IEEE Software, vol. 31, no. 3, pp. 69-75, 2014.
[12] R. Bertran, M. Gonzalez, X. Martorell, N. Navarro, and E. Ayguade, “Decomposable and responsive power models for multicore processors using performance counters,” in Proc. of the 24th ACM Intl. Conf. on Supercomputing, 2010, pp. 147-158.
[13] T. Li and L. K. John, “Run-time modeling and estimation of operating system power consumption,” ACM SIGMETRICS Performance Evaluation Review, vol. 31, no. 1, pp. 160-171, 2003.
[14] S. Gurumurthi, A. Sivasubramaniam, M. J. Irwin, N. Vijaykrishnan, M. Kandemir, T. Li, and L. K. John, “Using complete machine simulation for software power estimation: The softwatt approach,” in Proc. of IEEE the 8th Intl. Symposium on High-Performance Computer Architecture, 2002, pp. 141-150.
[15] A. Kansal, F. Zhao, J. Liu, N. Kothari, and A. Bhattacharya,“Virtual machine power metering and provisioning,” in Proc. of the 1st ACM Symposium on Cloud Computing, 2010, pp. 39-50.
[16] T. Do, S. Rawshdeh, and W. Shi, “pTop: A process-level power profiling tool,” in Proc. of the 2nd Workshop onPower Aware Computing and Systems, 2009, pp. 1-7.
[17] M. Dick, J. Drangmeister, E. Kern, and S. Naumann, “Green software engineering with agile methods,” in Proc. of the 2nd Intl. Workshop on Green and Sustainable Software, 2013, pp. 78-85.
[18] H. Chen and W. Shi, “Power measuring and profiling: stateof-the-art,” in Handbook of Energy-Aware and Green Computing, I. Ahmad and S. Ranka, Ed. 2012, London: Chapman and Hall/CRC.
[19] The Energy Star Program, ENERGY STAR® Program Requirements for Computers Version 5.0, Energy Star, 2011.
[20] D. R. Williams and Y. Tang, “Impact of office productivity cloud computing on energy consumption and greenhouse gas emissions,” Environmental Science & Technology, 2013, vol. 47, no. 9, pp. 4333-4340.
[21] GHG protocol product life cycle accounting and reporting standard ICT sector guidance—Cloud computing and data center services. GreenHouse Gas Protocol. [Online]. Available: http://www.ghgprotocol.org/ standards/productstandard
[22] M. Marcu and D. Tudor, “Power consumption measurements of virtual machines,” in Proc. of the 6th IEEE Intl. Symposium on Applied Computational Intelligence and Informatics, 2011, pp. 445-449.
[23] GHG protocol product life cycle accounting and reporting standard ICT sector guidance—Guide for assessing GHG emissions related to energy used by software. (2012). GreenHouse Gas Protocol. [Online]. Available: http://www.ghgprotocol. org/ standards/product-standard
[24] Mobile Battery Life Solutions for Windows 7: A Guide for Portable Platform Professionals, Microsoft, Redmond, 2009.
[25] 2011 guidelines to Defra/DECC’s GHG conversion factors for company reporting: methodology paper for emission factors. (2011). [Online]. Available: http://thenewspaper. com/rlc/docs/2011/uk-defra.pdf
[26] J. Ruutu, J. K. Nurminen, and K. Rissanen, “Energy efficiency of recharging a mobile device,” in Proc. of the 5th IEEE Intl. Conf. on Next Generation Mobile Applications, Services and Technologies, 2011, pp. 175-179.

Daniel R. Williamsreceived his B.Sc. degree in computer science and business from the University of Swansea, U.K. in 2005. In 2008, he received his M.Sc. degree in environmental technology from Kings College London, U.K. He then received an Engineering Doctorate in environmental information & communication technologies at the University of Reading and Microsoft in 2013.
Dr Williams is currently a Research Fellow at the University of Reading, U.K., furthering research into the environmental impact of information & communication technologies. He has had positions at Microsoft. U.K. Ltd. and Yell Ltd.. He is currently the Director of a small business Qingtech Ltd. (U.K.).

Yinshan Tangis a professor in management informatics at Henley Business School, who has 11 years teaching experience at the postgraduate level and 6 years senior management experience in industry. His research interest covers the areas of management and informatics and expands into
areas such as strategy, management ecology, business ethics, innovation, cross culture management etc. He was a biologist and parasitologist for over 17 years. He is currently the Vice Dean of Henley Business School.
Manuscript received May 22, 2015; revised June 25, 2015.
This work was in part supported by an Eng.D. studentship provided by the U.K. Engineering and Physical Sciences Research Council (EPSRC) and Microsoft (U.K.) Ltd.
D. R. Williams is with the Technologies for Sustainable Built Environments (TSBE) Centre, University of Reading, Reading RG6 6AF, U.K. (Corresponding author e-mail: dw10@hotmail.com).
Y. Tang is with the Henley Business School, University of Reading, Reading RG6 6UD, U.K.
A supporting document and color versions of one or more of the figures in this paper are available online at http://www.journal.uestc.edu.cn.
Digital Object Identifier: 10.11989/JEST.1674-862X.505221
 Journal of Electronic Science and Technology2015年3期
- Journal of Electronic Science and Technology的其它文章
- Energy Management Strategies for Modern Electric Vehicles Using MATLAB/Simulink
- Hybrid Aging Delay Model Considering the PBTI and TDDB
- Time-Efficient Identification Method for Aging Critical Gates Considering Topological Connection
- Residual Phase Noise and Time Jitters of Single-Chip Digital Frequency Dividers
- Enhancement of Distributed Generation by Using Custom Power Device
- Influence of Taxation on Supply and Demand in Tomorrow’s Crowd Energy Paradigm