Forecasting and Analysis of Agricultural Product Logistics Demand in Tibet Based on Combination Forecasting Model
Wenfeng YANG
Agricultural and Animal Husbandry College of Tibet University,Nyingchi860000,China
1 Introduction
Tibet is an important passage for thewestern logistics,and also an important area for the development of border trade and logistics.Through the analysis of industrial structure and logistics demand,it is found that Tibet Autonomous Region has continuously adjusted and optimized the industrial structure of Tibet,so that the industrial structure and layout are upgraded.Tibet has basically formed the characteristic industrial structure system which integrates tourism,Tibetan medicine,agricultural and livestock product processing industry,folk handicrafts,characteristic plateau bio-industry,green food(drink)product processing industry,mining and building material industry.With the completion of a number of transport,energy and other major infrastructure projects,especially the Qinghai-Tibet Railway,it has a profound impact on Tibet's transportation layout.Tibet's transport pattern basically forms the three-dimensional transport network with highway as the skeleton,railway asmeridian,complemented by civil aviation.In short,dramatic economic developmentand logistics infrastructure construction have an enormous impact on Tibet's logistics demand.Agricultural product is important strategic commodity related to people's livelihood,and the circulation industry of agricultural products is the basic industry for stabilizing the national economy.Tibet's agricultural product logistics is at the initial stage of development.Through the forecasting ofagricultural product logistics demand,it is necessary to reveal changes in agriculturalmarkets,develop scientific and rational development strategies and development plans,and provide the supporting logistics facilities,in order to provide an important basis for optimizing agricultural product logistics supply system in Tibet Autonomous Region.
2 Establishment of indicator system for agricultural product logistics demand
Population is the primary factor affecting the agricultural product logistics demand;the fundamental growth driver for logistics demand is the rapid development of the national economy,which rapidly increases the demand for goods turnover and stimulates and inhibits the development of logistics in the region,so the level of social and economic development is themajor factor affecting agricultural product logistics demand;income level affects the product purchasing power,and it is a factor affecting the formation of effective demand;the level of agricultural product logistics technology directly affects the function of agricultural product logistics,and gradually becomes the determining factor restricting the development of agricultural product logistics(Han Song,2008).The structure of consumption is determined by the level of consumption,and the structure of consumption determines the product structure,thereby affecting the quantity and quality of agricultural product logistics demand;foreign trade reflects the international logistics demand of agricultural products.According to the above analysis and related scholars'research and literature(Chen Yana and Zhao Qilan,2005;Fan Ronghua,2011;Lihua and Ren Zhongliang,2011;Wei Heng,2006;Wang Yue,2009),we establish the indicator system for forecasting of agricultural product logistics demand,and build first level indicators from demographic factors,level of socio-economic development,income,technological advances,supply capacity,residents'consumption,and foreign trade.There are 16 secondary indicators(see Table 1).
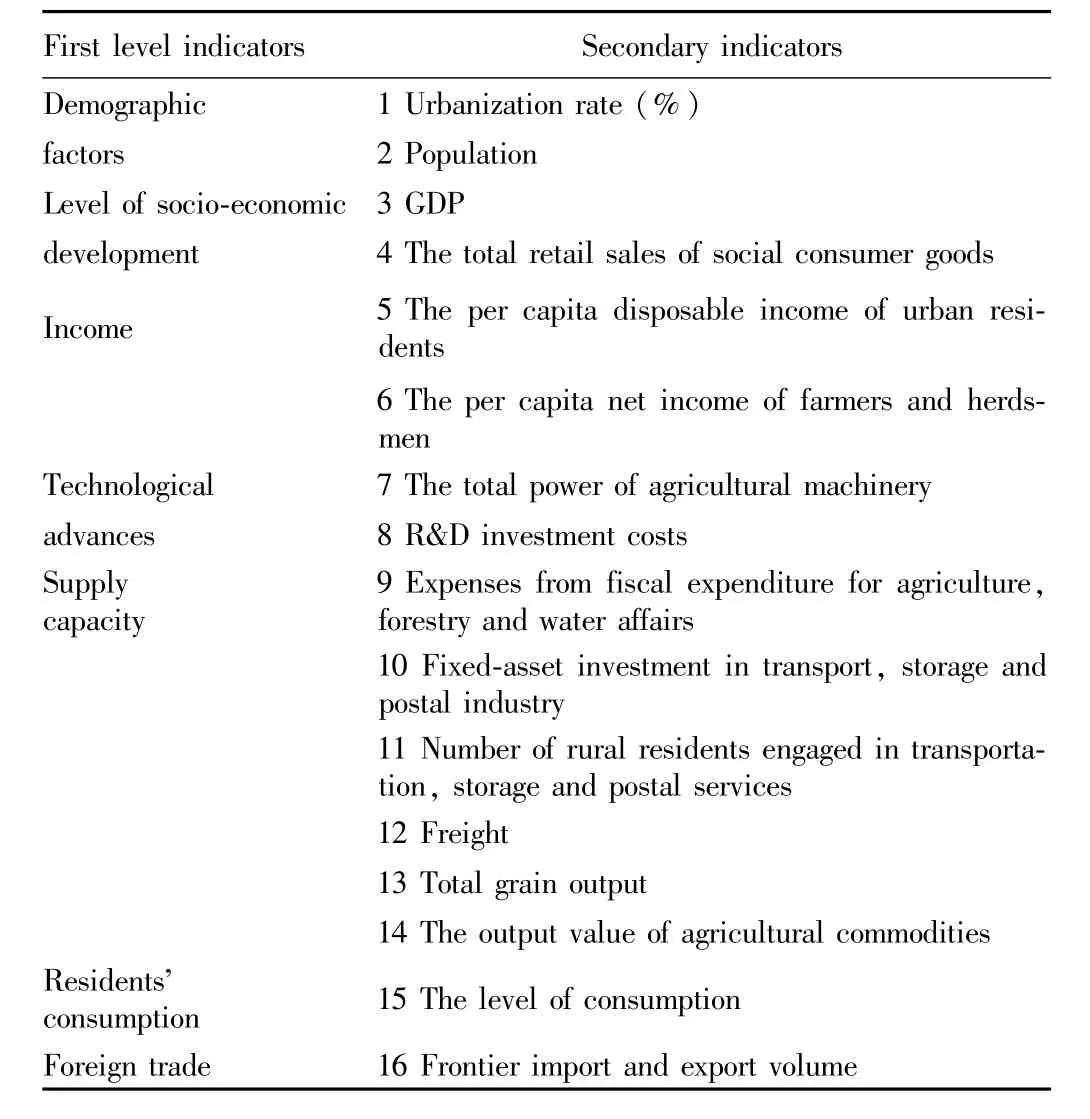
Table 1 The indicator system for agricultural product logistics demand in Tibet
3 Establishment of single forecasting model
3.1 Establishment of principal component regression model
Principal component regression analysis selects the following eight indicators as independent variables:X1urbanization rate(%);X2total retail sales of consumer goods(104yuan);X3per capita disposable income ofurban residents(yuan);X4total power of farm machinery(kW);X5R&D investment costs(104yuan);X6consumption levels(yuan/person);X7fixed assets investment in transportation,storage and postal industry(104yuan);X8number of rural residents engaged in transportation,storage and postal services(104persons).The dependentvariable Y is the total amount of agricultural product logistics in Tibet(104yuan).The data for the empirical analysis are the time series data during 2000-2013,and the original data are from Tibet Statistical Yearbook,as shown in Table 2.
In this paper,weuse SPSS17.0 software for principal component analysis,and select the eigenvalues greater than 1 as the standard to extract the principal component.The analysis shows that the characteristic root of the first principal component is 6.685,explaining83.568%of the total variance,and the characteristic root of the second principal component is 1.004,explaining 12.552%of the total variance.The cumulative contribution rate of the first two principal components has reached 96.12%,indicating that the first two principal components have reflected 96.12%of information of8 indicators,so the number of principal components is2.The indicatorswith high loading on the first principal component include urbanization rate,total retail salesof consumer goods,per capita disposable income of urban residents,total power of farm machinery,consumption levels,fixed assets investment in transportation,storage and postal industry,and number of rural residents engaged in transportation,storage and postal services,indicating that the first principal component reflects the basic information of these indicators,and the first principal component is named institutional factor.The indicatorwith high loading on the second principal component is R&D investment cost,indicating that the second principal component basically reflects the information of R&D investment costs,and the second principal component is named technical factor.The principal component analysis of agricultural product logistics demand in Tibet extracts two principal components(F1 and F2),covering the information of all original indicators,so F1 and F2 are used as new variables to replace the original eight variables.We take the proportion of eigenvalues of two principal components to total eigenvalues of the principal components extracted as theweight,to calculate comprehensive evaluation model of principal component:
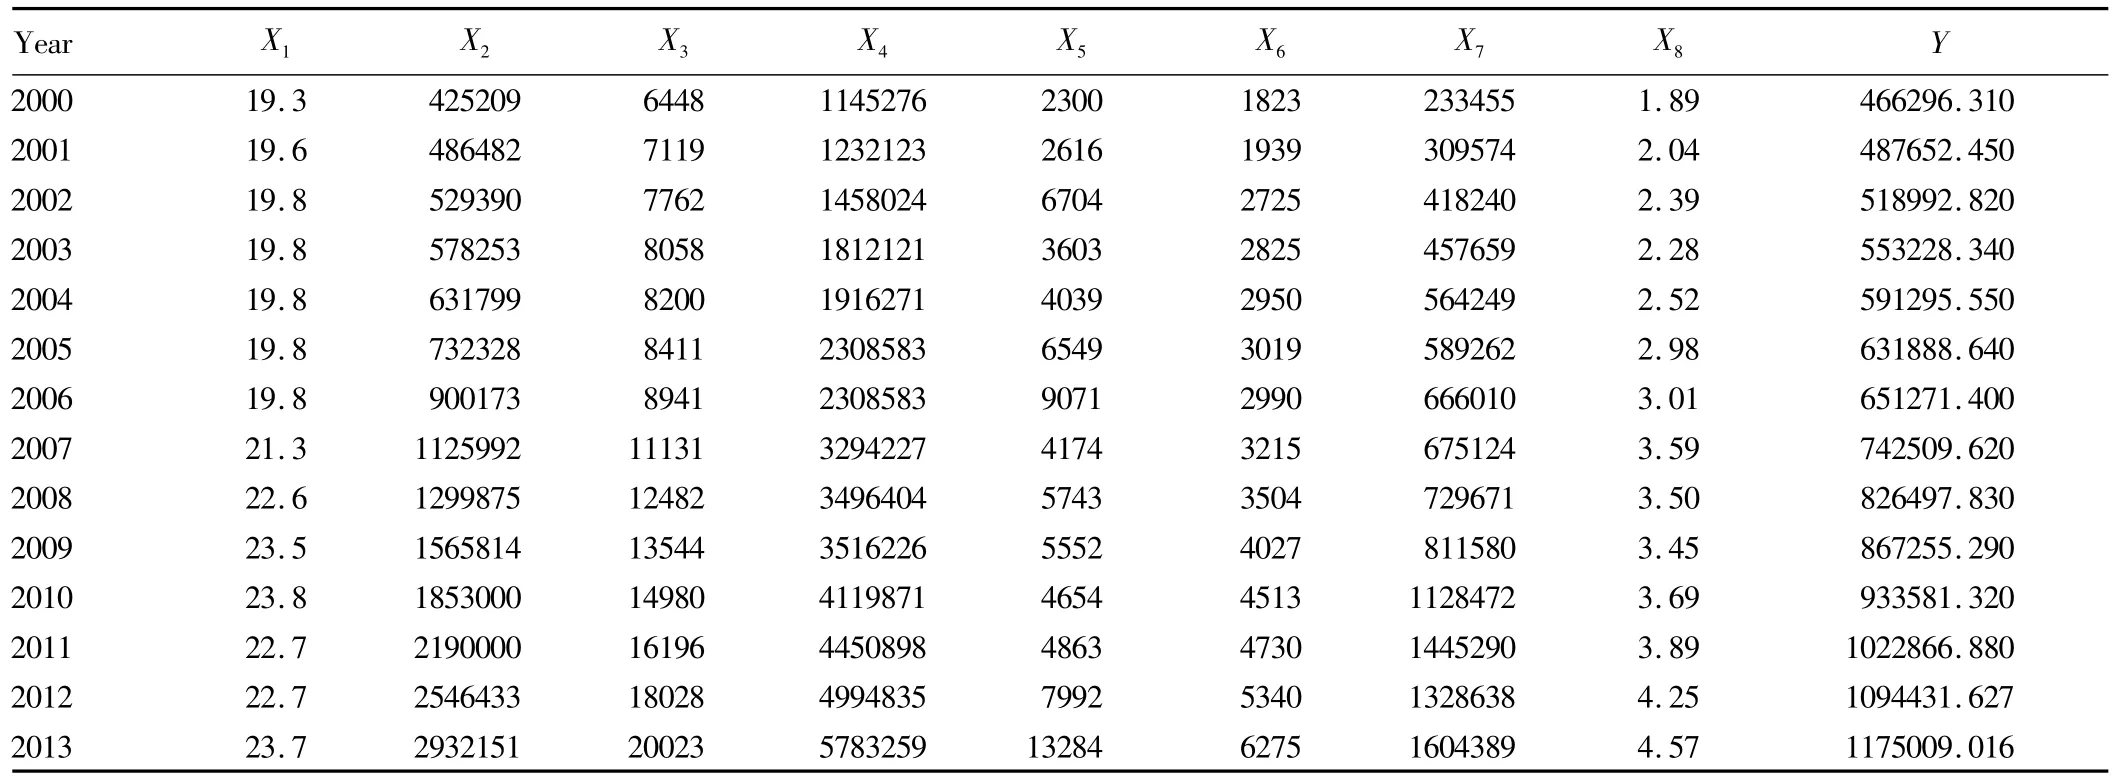
Table2 The econom ic indicators for the principal component analysis of agricultural product logistics demand in Tibet
whereλ1is the eigenvalue of principal component i.
The comprehensive evaluation model of principal component is as follows:
According to the principal component expression,we calculate the scoresof F1and F2as independentvariables,and the total amount of agricultural product logistics in Tibet is regarded as the dependent variable for regression analysis(Table 3).
The equation of principal component after regression is as follows:
X1,X2,X3,X4,X5,X6,X7and X8are substituted for F1and F2,respectively,to get the regression model for agricultural product logistics demand in Tibet:
The eight indicators during 2000-2013 are put into the above regression equation of agricultural product logistics demand to get the forecast value during 2000-2013.The forecasting error is controlled in less than 5%,indicating that themodel fitswell.
3.2 Establishment of BP neural network forecasting model
The idea of neural network forecastingmodel is to use the nonlinear approximation ability to build models based on the existing data,and forecast the future trends bymodel.BP,an abbreviation for"backward propagation of errors",isa commonmethod of training artificial neural networks used in conjunction with an optimization method such as gradient descent.Themethod calculates the gradient of a loss function with respect to all theweights in the network.The gradient is fed to the optimization method which in turn uses it to update the weights,in an attempt tominimize the loss function.ItusesMSE learning approach,with good nonlinear mapping ability,curve fitting ability,learning ability and capacity of resisting disturbance.

Table4 Statistics of neural network model for agricultural products in Tibet
3.2.1Establishment of neural networkmodel.Based on the indicator system for forecasting of agricultural product logistics demand and the relevant literature study(Geng Yong et al.,2007;Hu Xiongbin and Wang Xionghui,2010;Hou Rui and Zhang Bixi,2005;Jin Qiao,2008;Wen Peina etal.,2009;Wang Xinli and Zhaokun,2010),we consider the availability and operability of statistics in Tibet and actual characteristics of agricultural product logistics development in Tibet,and select seven indicators X1total retail sales of consumer goods(104yuan);X2total grain output(t);X3per capita net income of farmers and herdsmen(yuan);X4national fiscalexpenditure on agriculture(104yuan);X5output value of agricultural commodities(104yuan);X6population(104);X7consumption levels(yuan/person)as independent variables(see Table 4),and the amount of agricultural product logistics in Tibet(Y)as the dependent variable,to establish the neuralnetwork forecastingmodel.7 economic indicators in Table 4 are regarded as the inputvariables(input layer)for the neural network,and the amount of agricultural product logistics as an output variable(output layer).The number of neurons in the hidden layer is calculated at15 according to Kolmogorov Theorem.3.2.2Neural network training phase-determining the network structure and indicatorweight.We select the values of various indicators during1990-2013 in Table4 as the samples to be input.The input sample includes 7 indicators,so the number of neurons in the input layer is7.The amountof agricultural product logistics is as the output layer,and there is an indicator,so the number of neurons in the output layer is 1.The number of neurons in the hidden layer is15,and the other neural networkmodel parameters are shown in Table 5.After the initialization of weights,the BP network is trained,and the simulated error curve is shown in Fig.1.It can be found that through five training cycles,the BP network reaches the given MSE(2.06 e-08),the network is convergent,and the training ends.LM is employed as the training algorithm;the learning rate of training objective is0.01;the number of training times is 5;other parameters are from MATLAB toolbox.

Table5 BP neural network parameters for agricultural product logistics demand in Tibet
3.2.3Neuralnetwork simulation phase.Using the output result,we fix the neuralnetwork structureof differentsamplesand indicator weight for the simulation output of logistics demand scale to be forecasted.After training,the model performance has stabilized,and the indicator values during 2000-2008 are used to input into the trained neural network model,to get the predicted values of output samples of neural network forecasting model(2008-2013).Through error comparison(see Table6),it indicates that the simulation effect of the model is very good,with some reference value.

Table6 Error between actual values and predicted values during 2008-2013
4 Establishment of combination forecastingmodel
4.1 PrincipleFor a forecasting issue,ytis used to represent the actual observed value(t=1,2…n,where n is the sample size).There are m kinds of forecastingmethods;fitis the predicted value of forecastingmethod i(i=1,2…m);wiis the weight ofmethod i in the combination forecastingmodel.The combination forecastingmodel can be expressed as:
Model1
Objective function:
Predicted value is the unbiased estimate of actual value,namely E(fit)=yt,and∑wufitin formula(1)is also the unbiased estimate of yi,so formula(1)is the combination forecastingmodel established with the minimum bias between combination forecasting and original data as goal.The difficulty of combination forecasting lies in calculating the weight.Model 1 uses the Lagrange multipliermethod,and it is easy to calculate the value of wi,but theweights calculated based on Model 1 often contains negative weight,so there is a need to improve Model 1.
Model2
Objective function:
Through(3),we can solve the problem of negative weights in Model 1,but the weight calculation becomesmore complicated in Model 2,and it is often converted to quadratic programming for solutions(Liu Xin and Xu Shiying,2008).
4.2 Forecasting error analysis of single forecasting model for the agricultural product logistics demand in TibetPrincipal component regressionmodel:
Neural network forecastingmodel:see the above detailed description.
The forecasting error and results of agricultural product logistics demand scale in Tibet based on single forecasting model(principal component regression model,gray forecasting model,BP neural network model)can be shown in Table 7,8,respectively.According to the singlemodel forecasting results,it can be found that the variance of three single forecastingmodels is slightly lower than the raw data,indicating that it is stable to use these threemethods for long-term forecasting.BP neural network model has the highest forecast accuracy(maximum relative error of 1.18%),followed by principal component regressionmodel,and gray forecastingmodel.Fig.2 clearly describes the singlemodel forecasting results.
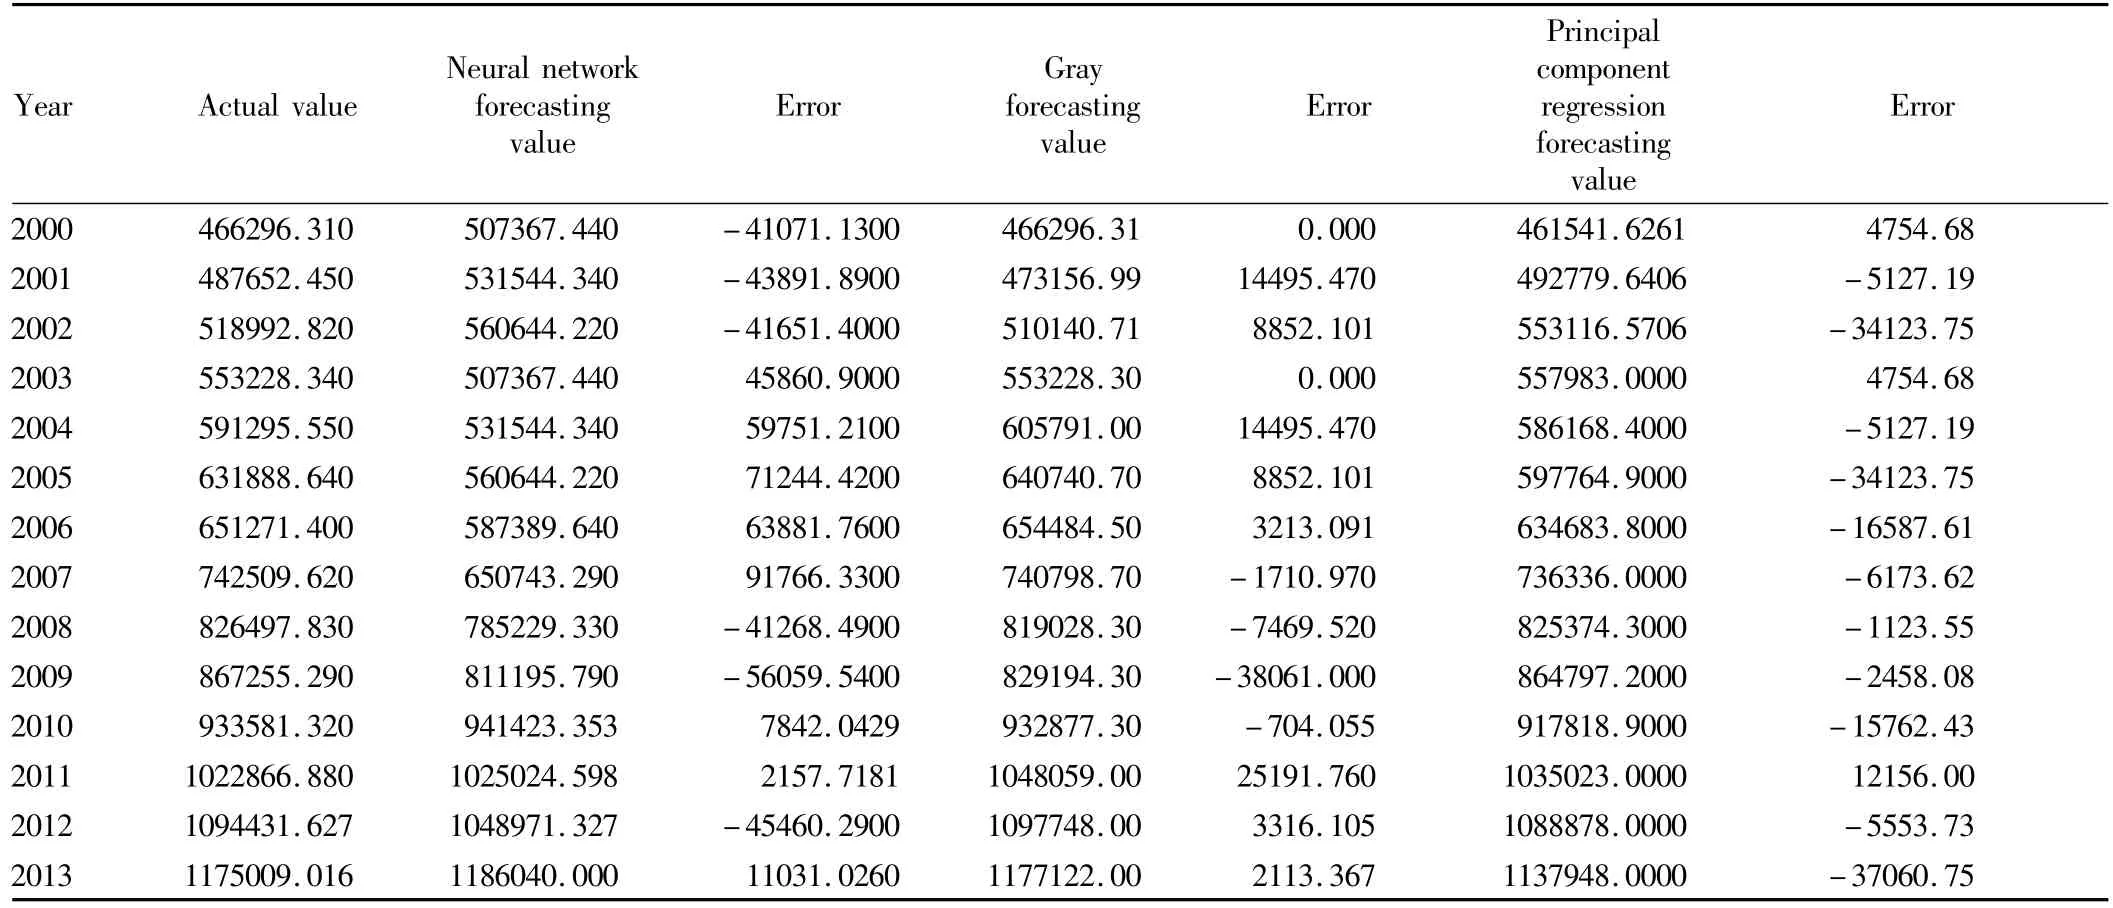
Table 7 Forecasting error of single forecastingmodel for the agricultural product logistics demand in Tibet

Table 8 Singlemodel forecasting results
4.3 Establishment of combination forecasting modelAccording to Model 2,the combination forecasting model is transformed into quadratic linear programming model for solution and weight(see Table 9).The combination forecasting model for Tibet's agricultural product logistics demand is established as follows:
where Y1is calculated value of principal component regression forecastingmodel;Y2is calculated value of gray forecastingmodel;Y3is calculated value of neural network forecastingmodel.
According to the singlemodel forecasting values in Table 7,
we use combination forecastingmodel to predict Tibet's agricultural product logistics demand scale during 2000-2013,as shown in Table 10.

Table 9 The weight of combination forecastingmodel
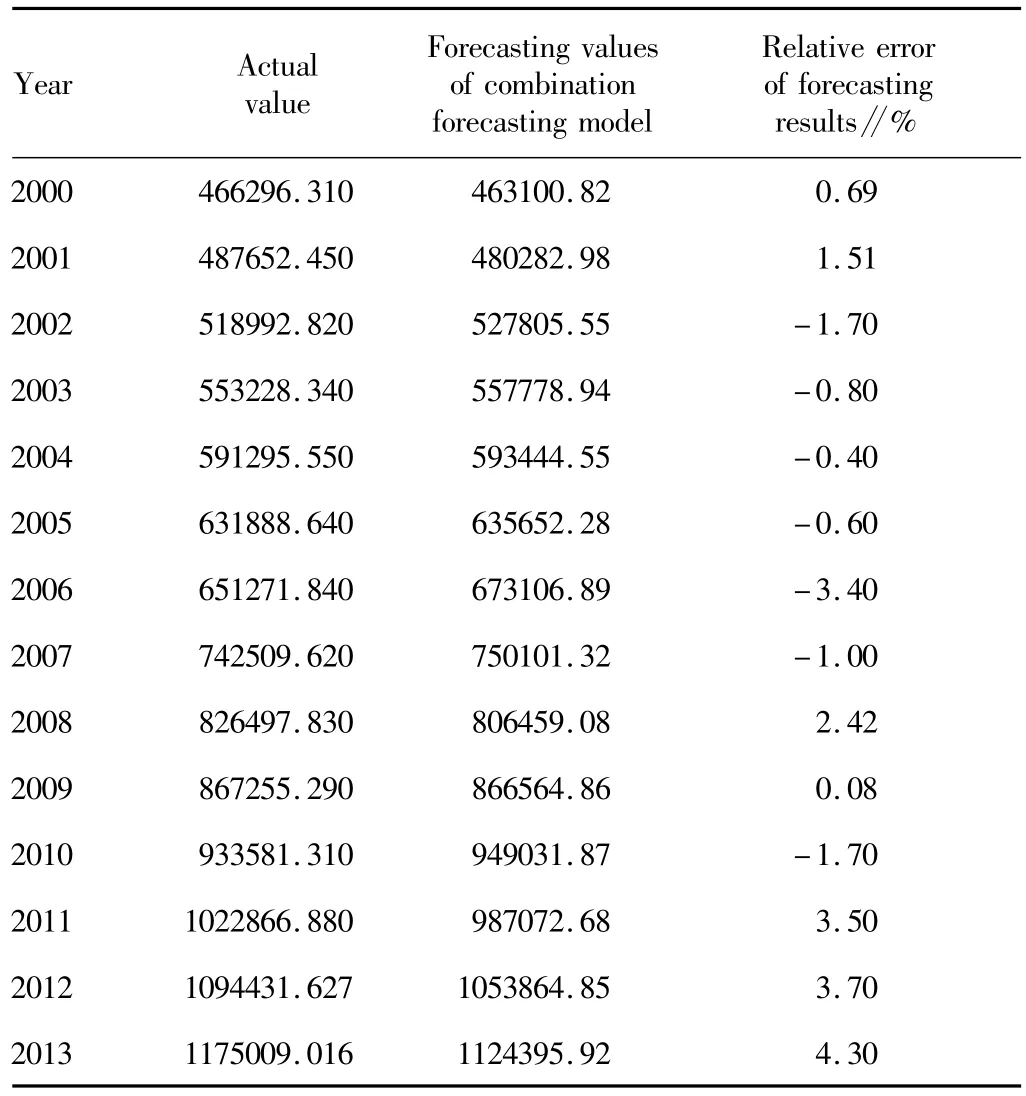
Table10 Combination forecasting results of Tibet's agricultural product logistics demand scale during 2000-2013
From the forecasting results of the above single model and combination forecasting model and Fig.3,it can be found that combination forecastingmodel is superior to singlemodel in terms of the long-term forecasting stability.
Based on the above forecasting results,the combination forecastingmodel using quadratic linear programming has high forecasting accuracy.Therefore,it is used to forecast Tibet's agricultural product logistics demand scale,as shown in Table 11.

Table 11 The combination forecasting values of Tibet's agricultural product logistics demand scale during 2014-2018
5 Conclusions
The combination forecastingmodel results show thatwith the rapid development of Tibet's economy,increase of government investment,improvement of people's living standards and constant optimization of industrial structure,Tibet's agricultural product logistics demand will grow over the next five years,reaching 12.7741952 billion yuan at the end of the"Twelfth Five-Year Plan"and 15.4113773 billion yuan in 2018.The growth of agricultural product logistics demand in Tibetwill certainly lead to the increase of agricultural production,promotion of agricultural product logistics services,development and application of agricultural product logistics technology.Tomeet the growing Tibet's agricultural product logistics demand,relevant government departments should strengthen the development strategies and development plans for Tibet'sagricultural product logistics;developmodern agriculture and improve the yield and quality of agricultural products;supportagricultural product logistics enterprises and improve service levels of agricultural product logistics;build agricultural product logistics park and use modern technology to enhance the level ofagricultural product logistics industry and improve the supply capacity of Tibet's agricultural product logistics.
[1]CHEN YN,ZHAO QL.Analysis on logistics demand in regional logistics planning and its system construction[J].Railway Materials Management,2005,23(1):27-28.(in Chinese).
[2]FAN RH.Discussion on agricultural product logistics demand in Nanyang City center town[J].Journal of Anhui Agricultural Sciences,2011,39(2):1224-1225.(in Chinese).
[3]GENG Y,JU SD,CHEN YN,et al.Analysis and forecast of logistics demand based on BPneural network[J].Logistics Technology,2007,26(7):35-37,73.(in Chinese).
[4]HAN S.Probe into logistic technique and equipment's development of primary products under new-country constructing[J].China Business and Market,2008(5):31-33.(in Chinese).
[5]HOU R,ZHANG BX.A method for forecasting regional logistics demand based on MLP neural network and its application[J].Systems Engineering—Theory&Practice,2005,25(12):43-47.(in Chinese).
[6]HU XB,WANG XH.Demand forecastingmodel and development strategy for the logistics industry ofWuhan based on BPneuralnetwork[J].Logistics Technology,2010,29(15):70-73.(in Chinese).
[7]JIN Q.Study on the prediction of port’s logistics demand based on artificial neural network algorithm and its empirical analysis[D].Beijing:Beijing Jiaotong University,2008.(in Chinese).
[8]LIH,REN ZL.On logistics demand forecasting in Liaoning Province[J].China Collective Economy,2011(16):121-122.(in Chinese).
[9]LIU X,XU SY.Population forecast in Tibet region based on combining forecastingmodel[J].Journal of the Central University for Nationalities(Natural Sciences Edition),2008,17(3):67-70.(in Chinese).
[10]WANG XL,ZHAOK.Research on the forecasting of the logistics demand for agricultural productsbased on neural network[J].Journal of Agrotechnical Economics,2010(2):62-68.(in Chinese).
[11]WANG Y.Study on the forecastingmethods of regional logistics demand[J].Logistics Technology,2009,28(12):169-171.(in Chinese).
[12]WEIH.SWOT analysis of agricultural products logistics of Heilongjiang Province[J].LogisticsManagement,2006,29(3):86-87.(in Chinese).
[13]WEN PN,ZHANG ZY,LUO B.Prediction and analysis on logistics demand in Beijing based on BP neural network[J].Logistics Technology,2009,28(6):91-93.(in Chinese).
 Asian Agricultural Research2015年9期
- Asian Agricultural Research的其它文章
- Risk Evaluation on Logistics Finance of Agricultural Products Based on Fuzzy-AHP Model
- An Analysis on Export Competitiveness of Vegetables from China to ASEAN
- The Influence of Agricultural Mechanization on the Development of Agricultural Economy in Chongqing City
- Land Use Change and Driving Forces in Guangzhou City during 1996-2012
- Canonical Correlation between the Leaf Quality Indicators of"Moderate Aroma"Flue-cured Tobacco
- Increase of Income of Farmers and Herdsmen in Tibet in the New Period
