Geometric active contour based approach for segmentation of high-resolution spaceborne SAR images
Shaoming Zhang,Fang He,Yunling Zhang,Jianmei Wang,Xiao Mei,and Tiantian Feng
1.College of Surveying,Mapping and Geo-Informatics,Tongji University,Shanghai 200092,China;
2.Institute of Remote Sensing and Digital Earth,Chinese Academy of Sciences,Beijing 100094,China
Geometric active contour based approach for segmentation of high-resolution spaceborne SAR images
Shaoming Zhang1,Fang He1,Yunling Zhang2,*,Jianmei Wang1,Xiao Mei1,and Tiantian Feng1
1.College of Surveying,Mapping and Geo-Informatics,Tongji University,Shanghai 200092,China;
2.Institute of Remote Sensing and Digital Earth,Chinese Academy of Sciences,Beijing 100094,China
Segmentation is the key step in auto-interpretation of high-resolution spaceborne synthetic aperture radar(SAR)images.A novel method is proposed based on integrating the geometric active contour(GAC)and the support vector machine(SVM) models.First,the images are segmented by using SVM and textural statistics.A likelihood measurement for every pixel is derived by using the initial segmentation.The Chan-Vese model then is modifed by adding two items:the likelihood and the distance between the initial segmentation and the evolving contour.Experimental results using real SAR images demonstrate the good performance of the proposed method compared to several classic GAC models.
image segmentation,synthetic aperture radar(SAR) imagery,support vector machine(SVM),geometric active contour (GAC).
1.Introduction
Due to the active use of microwave radiation,synthetic aperture radar(SAR)systems are capable of observing the Earth’s surface day and night,independent of weather and environmental conditions[1].This makes SAR a highly valuable method for obtaining remote sensing imagery. Currently,high-resolution(HR)spaceborne SAR images with up to one-meter spatial resolution have been applied widely in many felds.Segmentation is a crucial step in the automatic interpretation of HR spaceborne SAR imagery. However,SAR images are affected by speckle noise.In addition,the appearance of objects in SAR images is signifcantly different from the human perception of the environment.Hence,the segmentation of HR spaceborne SAR imagery is a very diffcult task.
A signifcant effort has been devoted to the development of segmentation methods for SAR imagery.In recent years, region-based geometric active contour(RGAC)models have been applied to SAR image processing.Based on an assumption of proper probabilistic models such as the K, the Gamma,and the g0Adistributions,global RGAC models[2]have been applied to segmentation of midresolution SAR images into multiple homogeneous regions [3–7].
In some cases,the regions of interest in SAR are not homogeneous and the distribution is diffcult to be determined.For example,the building area consists of high-intensity pixels(strong signal responses by doublebounce scattering at the dihedral corner refector between the ground and the building wall)and low-intensity ones (shadow caused by buildings).The texture descriptors are the most useful features for segmenting those areas instead of the distribution of the pixel intensity.The global models are not capable of segmenting with the heterogeneous texture.Given a proper analysis window,localized RGAC models[8–10]can solve this problem in some extent.However,the performance of localized RGAC models depends on the size and shape of the analysis window.It is not easy to determine them for images with complex texture.Therefore,the localized RGAC models are also mainly used to extract homogeneous regions[11,12] in SAR imagery.
Another drawback of the RGAC model is the existence of the local minima,which makes the initial contour a critical factor in obtaining good results and reducing time consumption.
The issue of heterogeneous texture can be solved by employing multi-scale texture features and machine learning classifers.In recent years,the support vector machine (SVM)and the gray level co-occurrence matrix(GLCM) are widely used in SAR image segmentation.However, along the segmentation boundary,the analysis window inwhich the GLCM is calculated usually covers more than one region.Hence,it is diffcult to obtain suffciently accurate results and the results vary when windows of different sizes and/or structures are employed.
The SVM and RGAC methods have different advantages.Inspired by this,a method combining RGAC and SVM is proposed for segmentation of HR spaceborne SAR images in this paper.An improved RGAC model is developed by integrating an SVM to the RGAC model.the SVM is used to obtain an initial segmentation.Then the CV model[2]is modifed by adding a likelihood term derived from the initial segmentation and a term for distance between the initial segmentation and the evolving contour.The GLCM is used to add the texture information to the SVM sample.The new RGAC model can obtain a result that is close to the global optimal solution with good time effciency due to the combination of the advantages of SVM and RGAC.
This paper is organized as follows:Section 2 describes the proposed method,Section 3 shows the experimental results of the proposed algorithm and the comparison with two classic RGAC models,and Section 4 outlines signifcant conclusions.
2.Proposed method
2.1Existing RGAC models
Two main categories exist for RGAC models:global[2] and localized[8–10].
Let C=∂ω be an evolving curve in Ω⊂R2where ω⊂ Ω is an open subset of Ω and let I:Ω → R be a given gray level image.The variable x in I(x)is a point in Ω.Representing the contour C with zero level set C={x∈Ω|φ(x)=0},the CV model minimizes the following energy function:
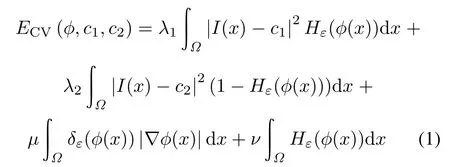
where μ≥0,ν≥0,and λ1,λ2>0 are constants.The frst two items are the global data-ftting energy.The third and the last terms are the length of C andthe area of the regioninside C.Terms c1and c2are the ftting functions that approximate the image intensity in the regions inside and outside the curve C,where Hε(φ)and δε(φ)are the regularized versions of the Heaviside function and the Dirac function.They are defned respectively as


Minimizing the energy function using a gradient descent method,the following evolution equation can be obtained:

The segmentation can be achieved by updating the contour using(4).
Compared to the global models,localized ones are capable of segmenting objects with heterogeneous intensity by making use of the local image intensity statistics at a controllable scale.In this paper,the Lankton model[10]is compared with the proposed model.
In the Lankton model,the energy function is defned as

where F is a generic internal energy measure used to represent local adherence to a given model at each point along the contour.B(x,y)is used to control the scale and is defned as

2.2Proposed model based on CV model
In this paper,the CV model is improved by integrating it with SVM.First,an initial contour is obtained by segmenting the SAR images using SVM and texture.Then a likelihood measurement is calculated for every pixel based on the texture histogram of regions separated by the initial contour.The likelihood and the distance between the evolving and the initial contour are both added to the CV model to create a new RGAC model.
SVM and GLCM statistical parameters including energy,entropy and contrast are used to derive a meaningful initial curve for the RGAC method.To improve the results,the dimensionality of the texture feature vectors is reduced by using the independent component analysis(ICA) method.Along the segmentation boundary,the analysis window in which the GLCM is calculated usually covers more than one object.As segmentation results vary when windows of different sizes and/or structures are employed, the initial results are not suffciently accurate.
To overcome the drawbacks of the above texture-and SVM-based method,a post-segmentation procedure is performed by adding information about the initial contour tothe CV RGAC model.Let φSVM(x)denote the signed distance function[13]generated from the initial segmentation.It is defned as

where CSVM={x|φSVM(x)=0}is the initial contour derived by using the above texture-and SVM-based method,i.e.the boundary of two segmentations.d(x)is the Euclidean distance between x and the nearest point xφSVMon CSVM.

The frst item added to the CV model is a likelihood measurement L(x)that introduces texture information into the RGAC model.Let V denote the N dimensional texture feature vector used in the initial segmentation.For the kth component Vk,a normalized histogram for the regions inside and outside CSVMcan be computed as

where i denotes inside and outside CSVM,Vkdenotes the kth component of V,Ωidenotes the region inside or outsideCSVM,Area(Ω)is the area of the region,i.e.the number of pixels inside the region,and u denotes the intensity of Vk.δ(x)is defned as

For Vk,the above normalized histogram can be used as the probability of belonging to the region Ωi.The components of V are independent of each other because they are derived using ICA method.For V,the probability of belonging to Ωican be computed as

For each pixel,a likelihood measurement L(x)is defned as

For each pixel,L shows the likelihood of being inside and outside of CSVM.
The second item is a distance measurement controlling the extent of variation between the current contour C={x|φ(x)=0}and the initial contour CSVM.Firstly, a normalized version of φSVM(x)is defned as

The distance measurement D(x)is defned as

where Hε(x)is defned in(2).
The SVM model is an optimal solution of the training procedure.Despite the existence of noise,CSVMis near the global optimal segmentation.Therefore,CSVMis a good initial contour for the RGAC model.CSVMcan guide the RGAC curve evolving from a position which is near to the global optimal segmentation,which can speed up the evolution procedure of RGAC.
However,the existence of local minima of the RGAC model will lead to over-segmentation.It is not enough to only force the RGAC curve to evolve from CSVM.The above two items derived from CSVMcan be used as the complementary constraints for the RGAC model.The frst item shows the likelihood of being inside and outside CSVMfor each pixel according to texture features.The second item denotes the variation between a contour and CSVM.If these items are introduced to the RGAC model, the curve of the RGAC model can be forced to evolve under the constraint of CSVM.For the pixels that are near CSVM,the energy of the classic RGAC model and the texture likelihood measurement will dominate the evolution of the curve.For the pixels that are far from CSVM,the distance measurement will weaken the energy of evolution. Only the pixels with more energy can change their sign. The texture information also will be introduced through the likelihood measurement,which is very important for segmentation of some texture regions such as buildings and forests.
By adding the likelihood and distance measurement to (1),the energy function of the proposed model can be defned as

where λ3,λ4,and λ5are positive constants to balance the contributions of the items of the CV model,likelihood anddistance measurements,they can be determined by experiences.Li(x),a function denoting every pixel’s likelihood of being inside or outside CSVM,is defned as(12),D(x) is the distance function that is defned as(14).
Let eCV=μdiv(∇φ/|∇φ|)−v−λ1(I−c1)2+λ2(I−c2)2and minimizing the energy function using a gradient descent method[14],the evolution equation can be obtained as

which can be simplifed as

In order to segment SAR imagery to N(N≥2)phases, the multi-phase strategy proposed by Mansouri et al.[15] is adopted.Each class j(j=1,2,...,N−1)has an associated level set function φj,and the inside regions Rjand outside regions Rcjcorrespond to areas represented by φj<0 and φj>0,respectively.Each j has its own evolution function as follows:

where ξjis defned as

and let χRbe the indicator function of the regions denoted by R,defned by χR(x,y)=1 if(x,y)∈R,and otherwise χR(x,y)=0.Φjis defned as

Images can be segmented by using(18)to update each curve that is associated with a class.
The entire procedure of the proposed method is shown in Fig.1.
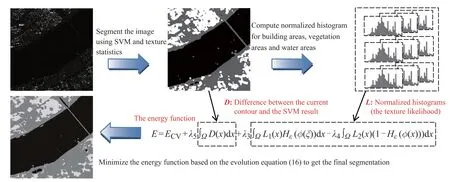
Fig.1 Flow chart of the proposed method
3.Experimental results
3.1Experimental results of synthetic images
As shown in Fig.2(a),a synthetic SAR image(200×200 pixels)consisting of building areas,vegetation areas and water areas of TerraSAR-X images(X band,2.4 m ground resolution)was used in experiments to quantitatively evaluate and compare the performance of the proposed method, the CV model,the Lankton model and SVM.The algorithms are developed by using C++and tested in a desktop with a 1.8 G 2-core CPU and 4 G memory.
Fig.2(b)shows the segmentation results obtained by using SVM with GLCM statistics.A standard C-SVM with a 3-degree polynomial kernel where C=20 was used.Energy,entropy and contrast of GLCM were calculated horizontally and vertically.The size of the analysis window is26×26 pixels,the offsets are 3 pixels in both directions and the GLCM dimension is 32×32.The number of training samples for building areas,vegetation areas,and water areas(or other low-intensity objects)were 7 896,7 096, and 7 552,respectively.These samples were selected by visual check from the Terra SAR-X images.The resulting segmentation is poor because the GLCM analysis window covered multiple regions of the boundary,thus causing severe over-segmentation.
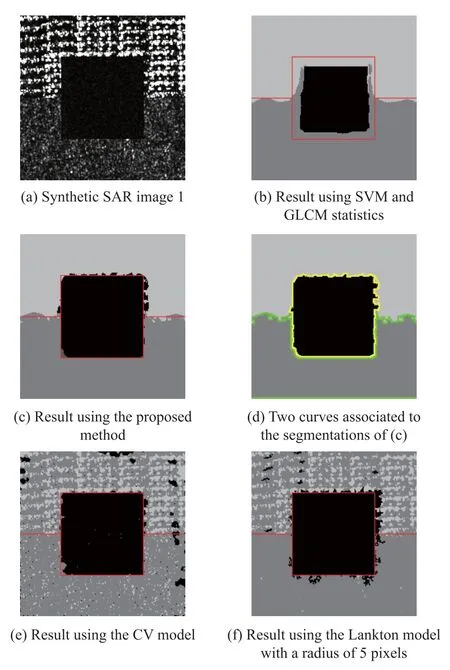
Fig.2 Experimental results of synthetic images
Fig.2(c)shows the refned result for Fig.1(b)obtained by using the proposed method with μ=0.1,λ1,λ2,λ3, λ4,λ5=1 and iteration times of 927.Fig.1(d)shows two curves associated to the segmentations.
Fig.2(e)shows the result using the CV model with μ=0.1,λ1,λ2=1.The iteration times,i.e.the number of iterations of RGAC until convergence,is 2 019.The CV model performs poorly because the building and vegetation areas are of heterogeneous intensity.
Fig.2(f)shows the result using the Lankton model with a radius of 5 pixels(radii of 5,20 and 50 were tested and 5 is the best in this case),with μ=0.1.The iteration times is 1 983).This model performs poorly as well due to the heterogeneous intensity of the building area.
Table 1 shows the segmentation accuracy and the computing time for the above four methods.

Table 1 Accuracy and computing time of the segmentation
The physical meaning of the proposed method could be demonstrated by Fig.2.Although the initial contour was given by SVM and GLCM,the CV and the Lankton models cannot perform well for the building and the vegetatian areas.There are two reasons for the poor performance.
First of all,the initial contour was not utilized effectively.The curves of those two models evolved without any constriaints and stopped at a result far from the initial contour.In contrast,the proposed method introduces the distance item,the difference between the initial conour and the fnal result,to restrict the curving evolving under the constraints of the initial contour.Therefore,the proposed method can prevent the curve from evolving into the local minimum.
Secondly,the texture information which is of great signifcance for segmenting building and vegetation areas was not adopted by CV and Lankton models.This leads to the oversegmentation in the interior of those two kinds of areas.The Lankton model performs a little better than the CV model in the vegetation area due to the consideration of neighborhood information.However,the result for the building area is still not good.The texture information, GLCM statistics,was introduced into the proposed mehtod by using a likelihood based on the initial contour.This can provide much more information for the segmentation of inhomogeneous areas.
By introducing the two extra items,the evolution of the curve for the pixels far from the initial contour will be dominated by the distance item.Instead,the evolution for the pixels near the inital contour will be dominated by the texture likelihood item.Therefore,the two items will force the evolution to converge to a solution which is close to the optimal one.
3.2Experimental results of segmentation of HR spaceborne SAR images
Fig.3(a)shows the original 1 600×1 600 TerraSAR-X images(X band,2.4 m ground resolution)used for this analysis.Fig.3(b)shows the initial segmentation results generated using SVM and GLCM statistics with the same parameters as the experiments outlined in Section 3.1.Fig.3(c)shows the segmentation results generated by the proposed method with μ=0.1,λ1,λ2,λ3,λ4,λ5=1 and iteration times of 1630.The original image was segmented into three regions:building areas and vegetation areas and water areas(or other low-intensity objects).Fig.3(c)to Fig.3(m)show these three subareas of Fig.3(a),respectively,along with the corresponding optical images andthe segmentation results.
4.Conclusions
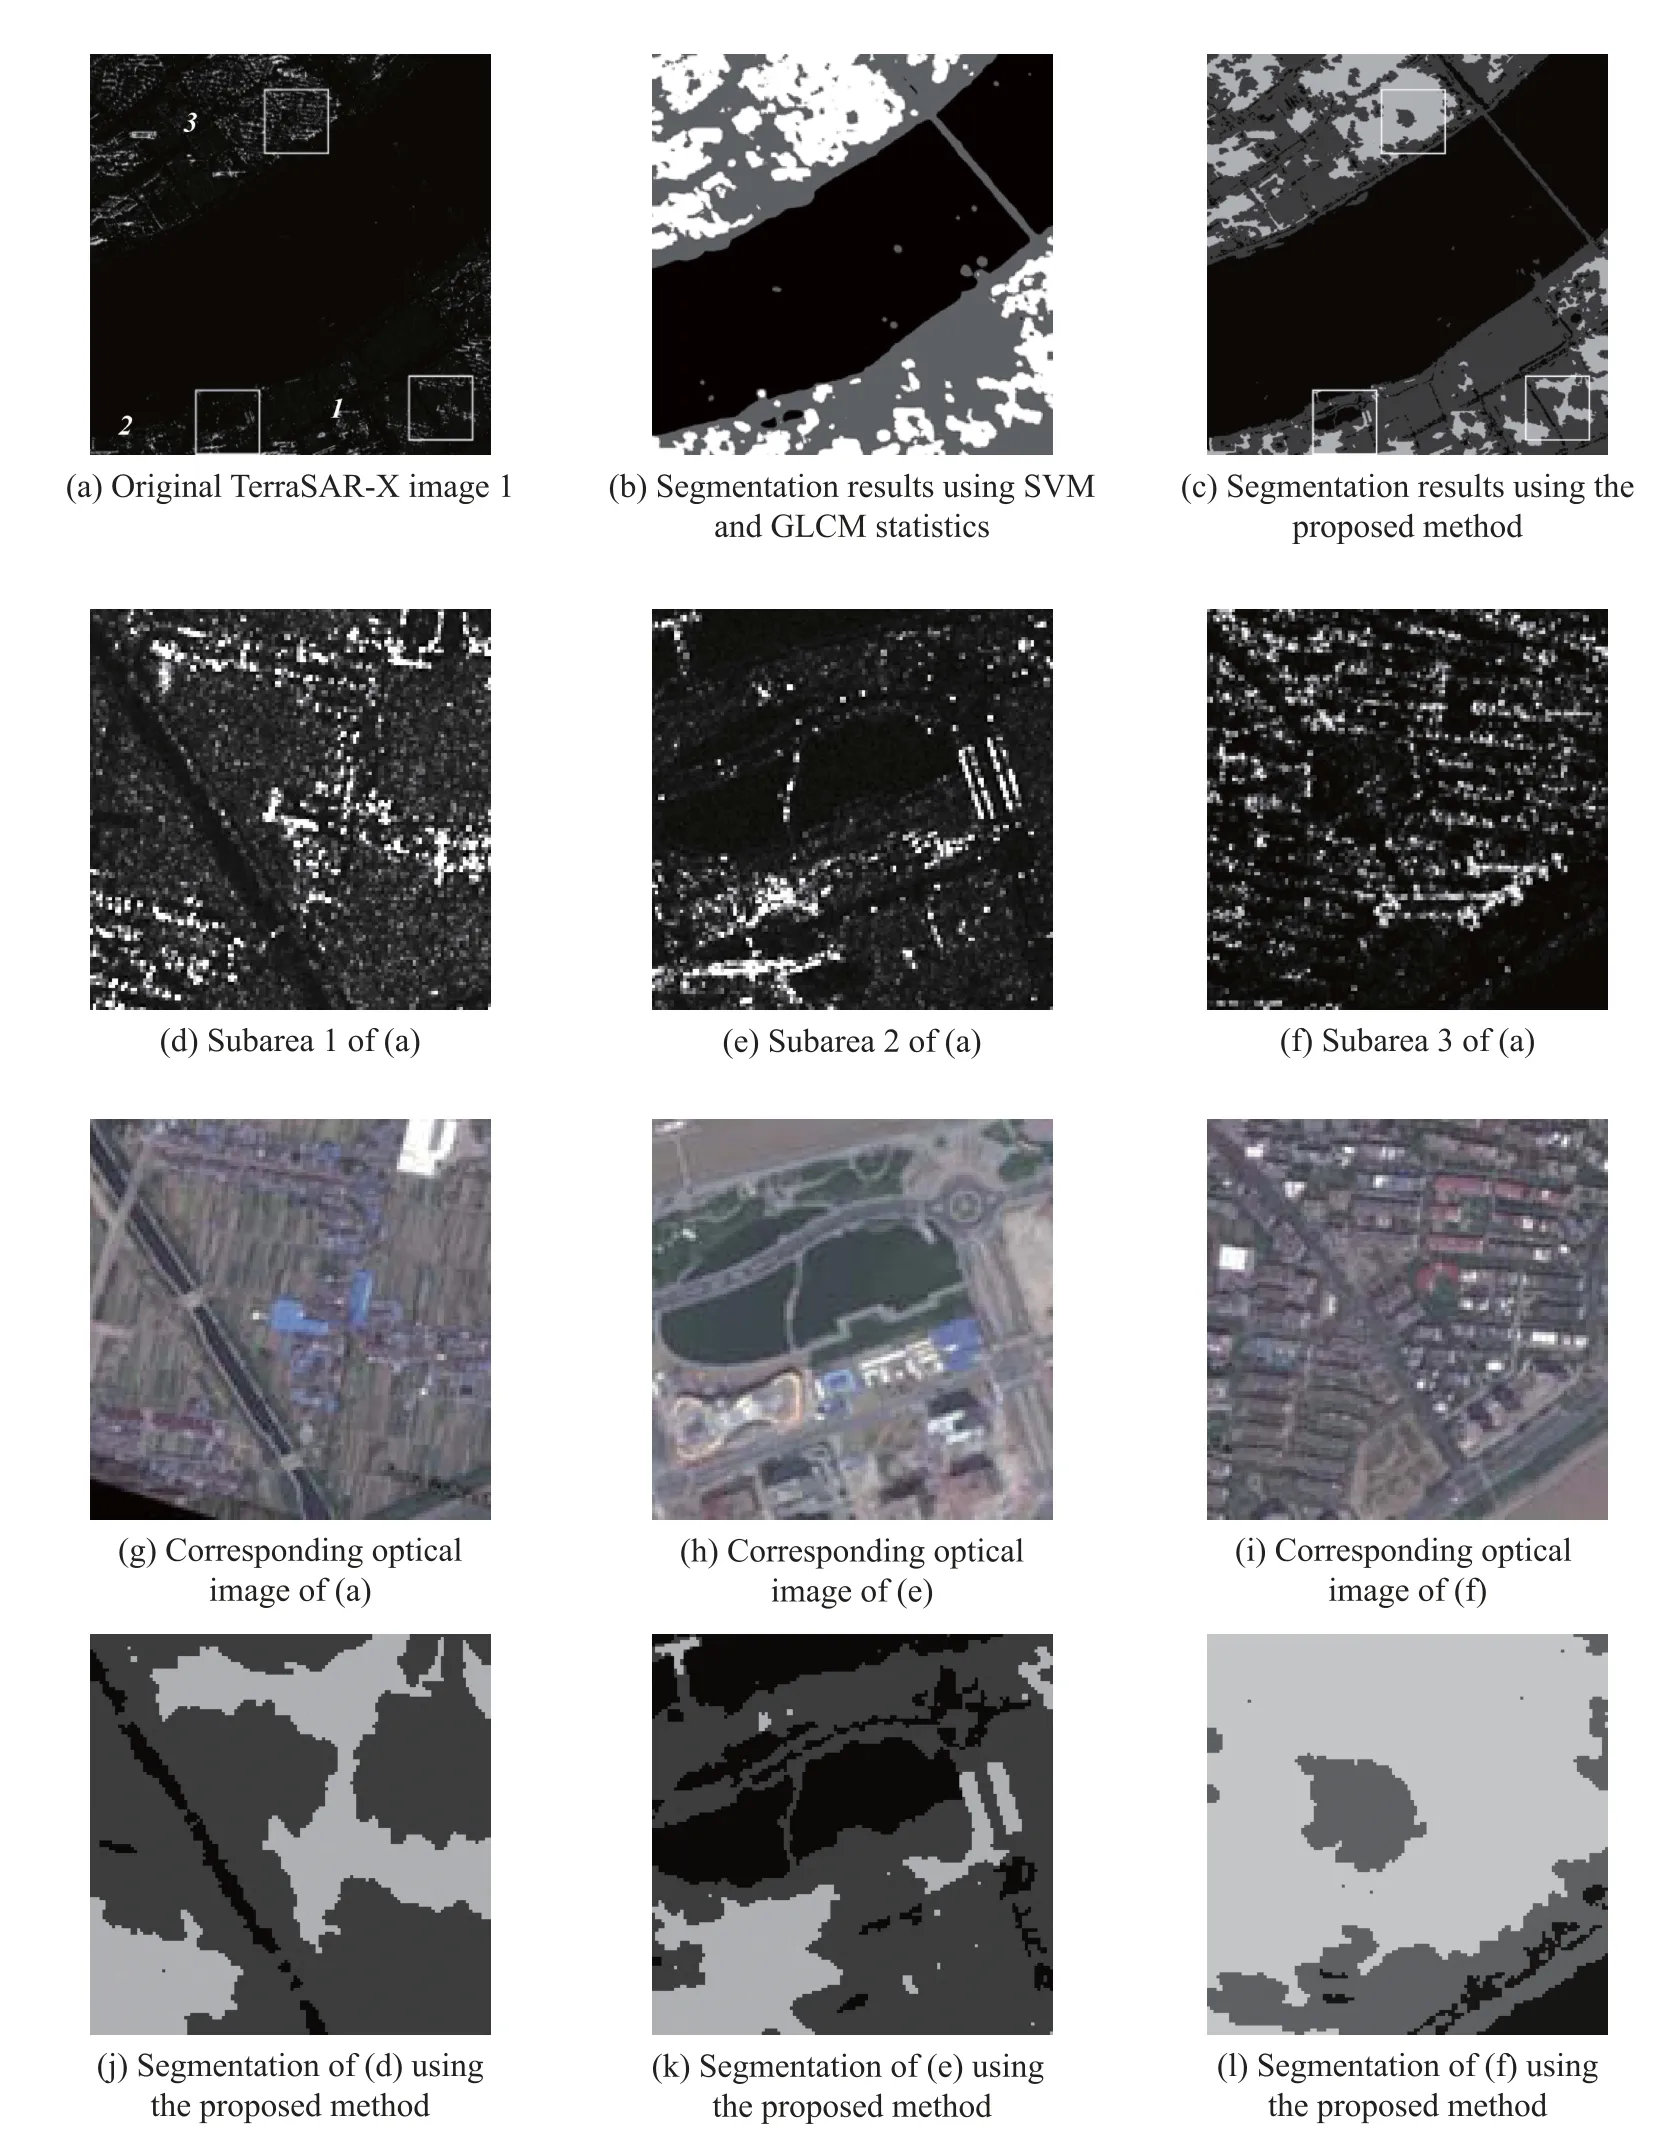
Fig.3 Exprimental results of SAR images
The RGAC based method has been applied widely in image segmentation.However,several drawbacks need to be overcome when applying GAC to segmentation of HR spaceborne SAR imagery.In this paper,an SVM classifer is integrated with the CV model.An initial segmentation is obtained by using the SVM classifer and GLCM statistics.Then two items are derived from the initial result and added to the CV model. The frst item is a likelihood measurement of being inside and outside regions.It is derived by using the histogram of GLCM statistics for each region.The second one is the distance between the evolving contour and the initial segmentation.The result demonstrates that the frst item can introduce the texture feature into the RGAC model successfully and the second item can control the evolution procedure to get a meaningful result.
[1]A.Danklmayer,B.J.D¨oring,M.Schwerdt,et al.Assessment of atmospheric propagation Effects in SAR images.IEEE Trans.on Geoscience and Remote Sensing,2009,47(10): 3507–3518.
[2]T.Chan,L.Vese.Active contours Without Edges.IEEE Trans. on Image Processing,2001,10(2):266–277.
[3]I.Ayed,A.Mitiche,Z.Belhadj.Multiregion level-set partitioning of synthetic aperture radar images.IEEE Trans.on Pattern Analysis and Machine Intelligence,2005,27(5):793–800.
[4]Y.Shuai,H.Sun.SAR image segmentation based on level set with stationary global minimum.IEEE Geoscience and Remote Sensing Letters,2008,5(4):644–648.
[5]M.Silveira,S.heleno.Separation between water and land in SAR images using region-based level Sets.IEEE Geoscience and Remote Sensing Letters,2009,6(3):471–475.
[6]R.Marques,F.Medeiros,J.Nobre.SAR image segmentation based on level set approach and GA0 Model.IEEE Trans. on Pattern Analysis and Machine Intelligence,2012,34(10): 2046–2057.
[7]B.Xiong,Z.He,C.Hu,et al.A method of acquiring tie points based on closed regions in SAR images.Proc.of the IEEE International Symposium on Geoscience and Remote Sensing, 2012:2121–2124.
[8]C.Li,C.Xu,C.Gui.Level set evolution without reinitialization:a new variational formulation.Proc.of the IEEE Computer Society Conference on Computer Vision and Pattern Recognition,2015:430–436.
[9]C.Li,C.Kao,J.Gore.Minimization of region-scalable ftting energy for image segmentation.IEEE Trans.on Image Processing,2008,17(12):1940–1949.
[10]S.Lankton,A.Tannenbaum.Localizing region-based active contours.IEEE Trans.on Image Processing,2008,17(11): 2029–2039.
[11]K.Huang,J.Zhang.A coastline detection method using SAR images based on the local statistical active contour model. Journal of Remote Sensing,2011,15(4):737–749.
[12]Y.Jing,J.An,Z.Liu.A novel edge detection algorithm based on global minimization active contour model for oil slick infrared aerial image.IEEE Trans.on Geoscience and Remote Sensing,2011,49(6):2005–2013.
[13]S.Osher,R.P.Fedkiw.Level set methods and dynamic implicit surfaces.New York:Springer-Verlag,2003.
[14]G.Aubert,P.Kornprobst.Mathematical problems in image processing:partial differential equations and the calculus of variations.New York:Springer–Verlag,2002.
[15]R.Mansouri,A.Mitiche,C.Vazquez.Multiregion competition:a level set extension of region competition to multiple region image partitioning.Computer Vision and Image Understanding,2006,101:137–150.
Biographies

Shaoming Zhang was born in 1979.He received his B.S.degree in School of Electronics Engineering from Tianjin University in 2002.He received his M.S.degree from The 14th Institute of China Electronics Technology Group Corporation in 2005 and Ph.D.degree in photogrammetry and remote sensing from Tongji University in 2005.He is currently working at College of Surveying,Mapping and Geo-Informatics,Tongji University.His research interests include computer vision and machine learning.
E-mail:zhangshaoming@tongji.edu.cn

Fang He was born in 1990.He received his B.E. degree in marine technology from Shanghai Ocean University.He is currently pursuing his M.S.degree at Tongji University,China.He is a graduate student at College of Surveying,Mapping and Geo-Informatics,Tongji University.His research interests include computer vision and machine learning. E-mail:hefang331@outlook.com

Yunling Zhang was born in 1984.She graduated from College of Surveying,Mopping and Geoinformatics,Tongji University.She has been a Ph.D. candidate in GIS at the Institute of Remote Sensing and Digital Earth(RADI),Chinese Academy of Sciences(CAS),since 2012.Her research areas include feature extraction from high-resolution image,3D laser scanning and transportation planning.
E-mail:shrek0@163.com

Jianmei Wang received her B.S.degree in surveying and mapping engineering from Tongji University,China,in 1994,M.S.degree in cartography and geographic information system engineering from Tongji University,China,in 1997,and Ph.D.degree in photogrammetry and remote sensing from Wuhan University,China,in 2007.She is currently working at College of Surveying,Mapping and Geo-Informatics,Tongji University.Her research interests include remote sensing image processing and spatial data mining.
E-mail:jianmeiw@tongji.edu.cn

Xiao Mei is a student of Tongji University,Shanghai.Now his current research focuses primarily on pedestrian detection,ship detection and DPM acceleration using GPU.
E-mail:mxmxlwlw@gmail.com

Tiantian Feng received her B.S.degree and Ph.D. degree in photogrammetry and remote sensing from Wuhan University,Wuhan,China,in 2004 and 2010,respectively.She has been working in College of Surveying,Mapping and Geo-Informatics, Tongji University,Shanghai,China,since 2010.Her research interests include multispectral remote sensing image processing,pattern recognition,and remote sensing applications in urban studies. E-mail:fengtiantian@tongji.edu.cn
10.1109/JSEE.2015.00010
Manuscript received November 02,2013.
*Corresponding author.
This work was supported by the National Natural Science Foundation of China(41171327;41301361),the National Key Basic Research Program of China(973 Program)(2012CB719903),the Science and Technology Project of Ministry of Transport of People’s Republic of China (2012-364-X11-803)and the Shanghai Municipal Natural Science Foundation(12ZR1433200).
 Journal of Systems Engineering and Electronics2015年1期
- Journal of Systems Engineering and Electronics的其它文章
- Dynamic channel reservation scheme based on priorities in LEO satellite systems
- Adaptive beamforming and phase bias compensation for GNSS receiver
- Novel dual-band antenna for multi-mode GNSS applications
- Nonparametric TOA estimators for low-resolution IR-UWB digital receiver
- Effcient hybrid method for time reversal superresolution imaging
- Adaptive detection in the presence of signal mismatch
