
Efcient Near-Infrared Quantum Cutting in Tm3+/Yb3+Codoped LiYF4Single Crystals for Solar Photovoltaic
2015-01-13 02:25:42LiFuHipingXiYnmingDongShnshnLiXuemeiGuJinliZhngDongjieWngHohunJingBojiuChen
Li FuHi-ping XiYn-ming DongShn-shn LiXue-mei GuJin-li ZhngDong-jie WngHo-hun JingBo-jiu Chen
a.Key laboratory of Photoelectronic Materials,Ningbo University,Ningbo 315211,China
b.Ningbo Institute of Materials Technology and Engineering,the Chinese Academy of Sciences,Ningbo 315211,China
c.Department of Physics,Dalian Maritime University,Dalian 116026,China
Efcient Near-Infrared Quantum Cutting in Tm3+/Yb3+Codoped LiYF4Single Crystals for Solar Photovoltaic
Li Fua,Hai-ping Xiaa∗,Yan-ming Donga,Shan-shan Lia,Xue-mei Gua,Jian-li Zhanga,Dong-jie Wanga,Hao-chuan Jiangb,Bao-jiu Chenc
a.Key laboratory of Photoelectronic Materials,Ningbo University,Ningbo 315211,China
b.Ningbo Institute of Materials Technology and Engineering,the Chinese Academy of Sciences,Ningbo 315211,China
c.Department of Physics,Dalian Maritime University,Dalian 116026,China
Downconversion(DC)with emission of two near-infrared photons about 1000 nm for each blue photon absorbed was obtained in thulium(Tm3+)and ytterbium(Yb3+)codoped yttrium lithium fuoride(LiYF4)single crystals grown by an improved Bridgman method.The luminescent properties of the crystals were measured through photoluminescence excitation, emission spectra and decay curves.Luminescence between 960 and 1050 nm from Yb3+∶2F5/2→2F7/2transition,which was originated from the DC from Tm3+ions to Yb3+ions, was observed under the excitation of blue photon at 465 nm.Moreover,the energy transfer processes were studied based on the Inokuti-Hirayama model,and the results indicated that the energy transfer from Tm3+to Yb3+was an electric dipole-dipole interaction.The maximum quantum cutting efciency approached up to 167.5%in LiYF4single crystal codoped with 0.49mol%Tm3+and 5.99mol%Yb3+.Application of this crystal has prospects for increasing the energy efciency of crystalline Si solar cells by photon doubling of the high energy part of the solar spectrum.
Quantum cutting,Energy transfer,LiYF4single crystals,Tm3+/Yb3+
I.INTRODUCTION
In recent decades,quantum cutting downconversion, which is based on the principle that it is theoretically possible to divide one high energy ultraviolet (UV)photon into two near-infrared photons[1],has attracted great attention as potential application in photovoltaic solar cells.Downconversion has been realized in many rare earths ion couples such as Tb3+/Yb3+, Pr3+/Yb3+,and Nd3+/Yb3+to convert visible photons into near-infrared photons[1−6],which can modify the solar spectrum to increase the conversion efciency of sunlight to electricity.The theoretically optical quantum efciency can be close to 200%.
Downconversion of Tm3+/Yb3+ions has also been experimentally realized for a cooperative energy transfer(ET)from Tm3+(1G4→3H5)to two Yb3+(2F7/2→2F5/2)ions in GdAl3(BO3)4by Zhanget al. in 2007[2].Due to abundant energy levels of Tm3+in the range of UV-visible and good energy match between Tm3+(1G4→3H5)and Yb3+(2F7/2→2F5/2),it is easy to realize the downconversion for Tm3+/Yb3+codoped solid materials.After that,downconversion has been experimentally realized from many Tm3+/Yb3+couples codoped in powders,micro-crystals or glasses [8−11].
The downconversion of Tm3+/Yb3+couples is also dependent on the host material.However,because of adversity of light scattering for the powders and the low luminous efciency of rare earth ions and low chemical stability,glasses are defcient to be applied efectively in solar cells and other optical devices[5,12].As host matrix of downconversion materials,the single crystal has the advantage of excellent comprehensive properties.The LiYF4single crystals are excellently favorable as the host materials for practical applications in optical devices due to their low phonon energy,relatively high optical damage threshold,and good thermal,mechanical,and excellent chemical stability[5].
In this work,we chose LiYF4single crystal as matrix for Tm3+and Yb3+ions because of the very near ionic radii between Tm3+(0.87˚A)and Y3+(0.893˚A),and Yb3+(0.858˚A)and Y3+.It is expected that a moderately homogenous distribution for Tm3+and Yb3+in LiYF4single crystal can be obtained.The inhomogenous concentration of rare earths ions resulting from their distribution phenomenon in single crystal strongly infuences the quality of crystal and practical applications.
Generally,the rare earth ions are dispersed in the network of glass.Unlike in glass matrix,the rare earth ions Tm3+and Yb3+substitute Y3+ions in a non-centersymmetrical site,and they have undergone a strong interaction from the crystal feld of LiYF4,which exerts an efective infuence on the optical spectra and quantum cutting for rare earths.However,the quantum cutting optical properties of Tm3+/Yb3+codoped LiYF4single crystals are not known well yet.
We have reported the absorption and fuorescence spectra of Pr3+/Yb3+and Tb3+/Yb3+codoped LiYF4single crystal grown by Bridgman method,in which the maximum downconversions were 168.4%and 166.7%, respectively[2,5].In this work,we examines the doping concentration efects on quantum efciency from the VIS and near-infrared emissions and decay lifetimes data.An efcient near-infrared emission quantum cutting downconversion and quantum efciency from the Tm3+/Yb3+codoped LiYF4single crystals were determined.
II.EXPERIMENTS
The feed materials for Tm3+/Yb3+∶LiYF4crystals were synthesized with molar compositions of 0.515LiF-0.005TmF3-(0.48−x)YF3-xYbF3(x=0.00,0.02,0.04, 0.06,0.08,and 0.10).The raw materials(YF3,LiF, TmF3,and YbF3powders)with 99.999%of purity were weighed according to formula LiY0.995−xTm0.005YbxF4. In this work,Tm3+/Yb3+∶LiYF4crystals were grown with a modifed Bridgman method and the particular process of this method has been reported in our previous work[5].In order to obtain high quality single crystals, feed materials for crystals growth were prepared with a slight excess of LiF.
Tm3+/Yb3+codoped LiYF4single crystals with high quality grown by Bridgman method were about 10 mm in diameter and 105 mm in length as shown in the left of Fig.1.These crystals were transparent and favescent.It is obvious that the color changed slightly along the growth direction.The top of the crystals are dark yellow and lighttight due to the constituent of other impurities and redundant LiF.In order to measure the optical features conveniently,the crystals were cut into small pieces and polished on both sides to about 2.3 mm thickness,as shown in the right of Fig.1.
The structures of the crystals were investigated by X-ray difraction(XRD)using a XD-98X difractometer(XD-3,Beijing).The absorption spectra of Tm3+/Yb3+ions were measured in 300−1300 nm interval using a Cary 5000 UV/VIS/NIR spectrophotometer(Agilent Co.,America).The excitation and emission spectra and decay curves were obtained with a FLSP 920 type spectrometer(Edinburgh Co.,England). Moreover,the concentrations of Tm3+/Yb3+ions in the LiYF4single crystals were measured by inductively coupled plasma atomic emission spectroscopy(ICP-AES, PerkinElmer lnc.,Optima 3000).The concentration of diferent samples are shown in Table I.The samples with diferent Tm3+and Yb3+concentrations were designated TY0,TY1,TY2,TY3,TY4,and TY5,respectively.All of the measurements were performed at room temperature.

FIG.1 Tm3+/Yb3+codoped LiYF4single crystal(left)and polished crystal(right).

TABLE I Concentrations of Tm3+ions and Yb3+ions in the single crystals.
III.RESULTS AND DISCUSSION
The XRD pattern and the established cell parameters for LiYF4sample codoped with 0.49mol%Tm3+and 5.99mol%Yb3+are shown in Fig.2(a).For comparison,the peak positions and the cell parameters of LiYF4in JCPD 77-0816 are displayed in Fig.2(b),one can confrm that the current doping level does not cause any obvious peak shift or second phase and the crystal is pure orthorhombic phase.In Fig.2(a),the crystal cell parameters are computed from the XRD spectrum.The result displays that the variable of cell volume is only 0.004 nm and cell volume negligible change is 1.38%.It authenticates that LiYF4single crystals do not occur any obvious transform in structure when those ions are doped.The similar XRD patterns we obtained from 0.5mol%Tm3+and diferent Yb3+doping concentrations suggest that most samples have been crystallized into the pure orthorhombic phase.Moreover,it can also be ensured that the Y3+ions sites of LiYF4single crystals were substituted by Tm3+and Yb3+ions.
The absorption coefcient spectra of sample TY0 and TY1 in region of 300−1300 nm are presented in Fig.3. The absorption spectrum of LiYF4crystal has no visible absorption bands in this region[2].The most obvious absorption band of TY1 from 910 nm to 1030 nm, which is diferent from TY0,attributed to the transition2F7/2→2F5/2of Yb3+in LiYF4crystal.Meanwhile,a strong absorption peak at 465 nm is attributed to the transition Tm3+∶3H6→1G4.One can be convinced that these single crystals can be pumped efciently by a 465 nm light.It is coincident that the wavelength at465 nm is half of the mated wavelength with transition of Yb3+∶2F7/2→2F5/2.Moreover,others absorption bands centered at 357,658,687,791,and 1211 nm correspond to the transitions of Tm3+from the ground state(3H6)to1D2,3F2,3F3,3H4,and3H5,respectively.
Figure 4 presents the excitation and emission spectra of all samples.In the photoluminescence excitation spectra of 0.48mol%Tm3+and 1.96mol%Yb3+codoped LiYF4sample,strong excitation bands at 465 nm are detected by monitoring both the Tm3+∶1G4→3F4transition at 646 nm and Yb3+∶2F5/2→2F7/2transition at 980 nm.The excitation appearances indicate the occurrence of energy transfer from Tm3+to Yb3+because that the incident light at 465 nm can not be absorbed by the spectral mismatched Yb3+ions. Furthermore,the photoluminescence spectra for samples with the concentrations of Yb3+ions varying from 0mol%to 9.98mol%,are collected under blue light excitation at 465 nm laser diode corresponding to the Tm3+∶3H6→1G4transition.The most intense emission peak is at 646 nm,corresponding to1G4→3F4transition of Tm3+ions[13].Other assigned bands about 696 nm(3F3→3H6),787 nm(1G4→3H5),808 nm (3H4→3H6),and 1171 nm(1G4→3H4)are also checked in every sample[13].Those emission bands are multiple and sharp due to the energy splitting in crystal [2].And an intense emission band in the region from 960 nm to 1050 nm can be observed when Yb3+ions are codoped into Tm3+-LiYF4crystal.This emission band around 1000 nm is attributed to the transitions from the stark level2F5/2multiplet of Yb3+to the stark level2F7/2multiplet appearances.When the concentrations of Yb3+are improved from 0mol%to 9.98mol%, the Tm3+concentration is held approximately to about 0.49mol%,the emission of Tm3+decreases monotonically.Moreover,the NIR emissions of Yb3+frst intensify signifcantly and then attenuate in pace with increased concentration of Yb3+.And the decrease in the near-infrared emission has been clearly observed as a result of concentration quenching[3].The emission intensity reaches a maximum when the Yb3+concentration is 5.99mol%.In addition,only Tm3+ions can absorb the excitation light at 465 nm to jump to the excited state from the ground state in the Tm3+/Yb3+codoped LiYF4crystal.Meanwhile,the observation for both the emissions from transitions of Tm3+and Yb3+ions upon excitation at 465 nm,further confrms the occurrence of ET from Tm3+to Yb3+.

FIG.2(a)Powder XRD pattern of the LiYF4:Tm3+/Yb3+crystal,a=0.5153 nm,b=0.5153 nm,c=1.0674 nm.(b)The standard line pattern of orthorhombic phase LiYF4(JCPD 77-0816),a=0.5171 nm,b=0.5171 nm,c=1.0748 nm.
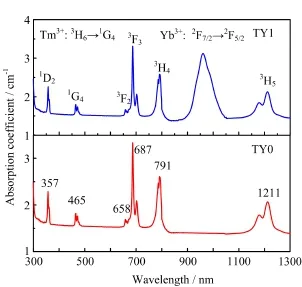
FIG.3 Absorption coefcient spectra of the Tm3+doped crystal(TY0)and Tm3+/Yb3+codoped crystal(TY1).
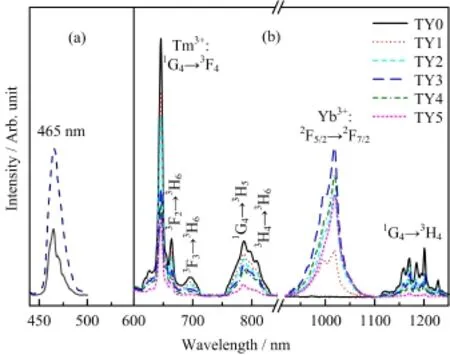
FIG.4(a)Photoluminescence excitation spectra of Tm3+646 nm emission(dash line)and Yb3+980 nm emission (solid line)in sample TY1.(b)Emission spectra upon excitation of 465 nm in all samples.
In order to illustrate the quantum cutting downconversion process in Tm3+/Yb3+codoped LiYF4defnitely,the schematic energy level diagram with involvedcooperative energy transfer process between Tm3+ions and Yb3+ions is depicted in Fig.5.One Tm3+ion can transfer its energy to two Yb3+ions or radiate to the lower energy states with emissions under the excitation of 465 nm light since the1G4level of Tm3+is located approximately twice the energy for2F5/2of Yb3+as shown in Fig.5.We can express the cooperative downconversion mechanism with a process∶Tm3+(1G4)+2Yb3+(2F7/2)→Tm3+(3H6)+ 2Yb3+(2F5/2).One Tm3+ion radiates with the emissions at the range from 600 nm to 900 nm and around 1171 nm as shown in Fig.4 or transfers its energy to two Yb3+ions,under irradiation at 465 nm.Moreover,it is not possible that resonant energy transfer is from a Tm3+∶1G4state to one Yb3+,since the Yb3+ion has only one excited state around 1000 nm and no transition from Tm3+∶1G4is suitable to match the gap of it. So little phonon energy about 425 cm−1of the LiYF4single crystal compared with the energy diference between1G4state of Tm3+and2F5/2state of Yb3+about 10974 cm−1that the phonon assisted energy transfer process is almost excluded.Then the cooperative quantum cutting downconversion process from one Tm3+ion to two Yb3+ions to explain this energy transfer process is reasonable.In this quantum cutting process,the quantum efciency up to 200%is possible theoretically, because the energy of a visible photon absorbed about 21505.4 cm−1is more than twice that of a near-infrared photon emission about 9813.5 cm−1from Yb3+ions.
The decay curves of the Tm3+∶1G4→3F4luminescence at 646 nm in Tm3+/Yb3+codoped LiYF4single crystals are plotted in Fig.6.And the solid lines are the stretched exponential ftting for the decays.As Table II shows,the decay curve of 0.49mol%Tm3+singly doped LiYF4sample is close to single exponential.However,the decay lifetimes decrease rapidly from 344µs to 72.1µs with an increase in the Yb3+concentrations from 0mol%to 9.98mol%.Meanwhile,the energy transfer from Tm3+to Yb3+appearances and the decay curves become non-exponential.For the nonexponential emission decay of these samples,the mean decay lifetime(τm)is calculated by[4]∶
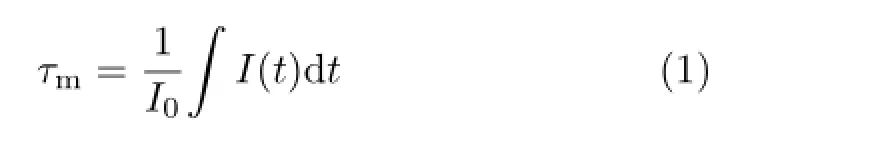

FIG.5 Partial energy level diagram of Tm3+and Yb3+ions and the cooperative transfer mechanism of Tm3+(1G4)→Yb3+(2F7/2)in Tm3+and Yb3+ions codoped LiYF4crystals are indicated by dash curve lines.
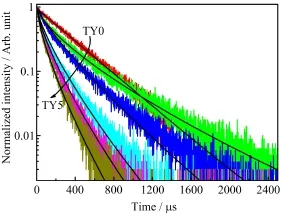
FIG.6 Decay curves of the Tm3+/Yb3+codoped LiYF4crystal samples are monitored at 646 nm under the 465 nm excitation.The black solid lines are the stretched exponential fts for the decays.

TABLE II Luminescence decay parameters,mean decay lifetimeτm,energy transfer efciencyηETE,and quantum efciencyηQEfor Tm3+and Yb3+codoped in LiYF4single crystal samples(TY0-TY5).
whereI(t)is the recorded luminescence intensity as a function of timet,andI0represents the maximum ofI(t)which occurs at the initial timet0.Moreover,the decay curves are well described by the stretched exponential function(often called a Kohlrausch function) shown below[5,14]∶
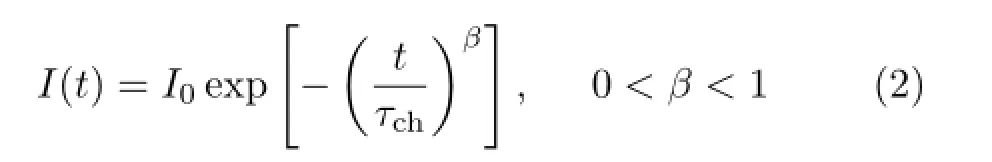
whereI(t)is equal toI0att=0,the parametersτchandβdepend on the material and can be a function of external variables like temperature[14].In this work,τchgives a characteristic lifetime for the decay of the excited states of Tm ions.Theβparameter is the degree to which the measured decay difers from a purelyexponential decay.The obtained parametersτchandβare also listed in Table II.It is clear that both parametersτchandβare reduced with increasing of Yb3+concentration when the concentration of Tm3+is held constant at~0.49mol%.One can confrm the energy transfer from Tm3+to Yb3+ions existence in these samples.
The energy transfer efciency(ηETE)is defned as the ratio of donors that are depopulated by energy transfer to the acceptors over the total number of donors being excited.Here,Tm3+acts as the donor and Yb3+as the acceptor.TheηETEis obtained as a function of the Yb3+concentration as follows∶
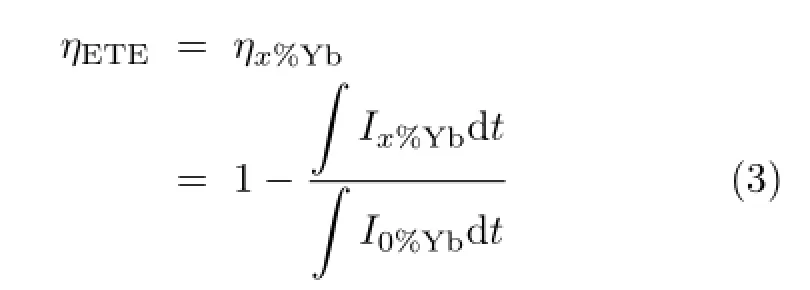
whereIstands for the decay intensity of 646 nm at timetandx%Yb denotes the Yb3+content.Additionally, the total quantum efciency(ηQT)can be defned as the ratio of the emitted photons to the photons that are absorbed,assuming that all excited Yb3+ions decay radiatively.This assumption leads to an upper limit of the quantum efciency,and the actual quantum effciency may be lower due to concentration quenching [4].The relation betweenηETEandηQEis linear and defned as[9],

whereηQEis the quantum efciency for the Tm3+ions. Giving no consideration to the nonradiative energy loss by defects and impurities,ηTmis set to 1[1,3].The values ofηETEandηQEare also summarized in Table II.
It can be confrmed from Table II,when concentration of Tm3+is held about 0.49mol%,bothηETEandηQEare monotonously increasing from 23.6%to 79.1% and 123.6%to 179.1%,respectively,with the increase of Yb3+concentration from 1.96mol%to 9.98mol%.However,taking into account the concentration quenching of Yb3+,the actual QE would be lower[3].Since quantum efciency and the 0.49mol%Tm3+/5.99mol%Yb3+codoped LiYF4crystal reach near-infrared emission maximum intensity,the maximum quantum efciency should be 167.5%in all samples.
In order to research the energy transfer mechanism, we use the Inokuti-Hirayama model to commentate the energy transfer mechanism of the non-exponential fuorescent decay.This model can express the decay curves as[2,15]∶
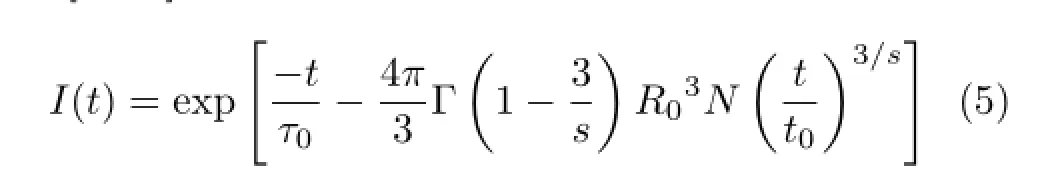
whereτ0is the intrinsic radiation lifetime,R0is the critical transfer distance,Ndenotes the concentration,and Γ(1−3/s)is a Gamma function.Here,the parameters=6,8,and 10,respectively,denote the electric dipoledipole,dipole-quadrupole,and quadrupole-quadrupole interactions between luminescent centers[2,5,15].The Γ(1−3/s)will be 1.77,1.43,and 1.30 whens=6,8, and 10,respectively.The ftting curves are shown in Fig.7.The values ofτ0decrease rapidly with the increase of Yb3+concentration,implying a fast energy transfer from Tm3+to Yb3+since the interaction of Yb3+and Tm3+changes from long to short distance. However,theτ0from the data ftting withs≈6 consistently means the energy transfer of electric dipole-dipole interaction from Tm3+to Yb3+in LiYF4single crystal.

FIG.7 Decay curves of the Tm3+/Yb3+ions codoped LiYF4crystal samples are monitored at 646 nm under the 465 nm excitation.The black solid lines are the Inokuti-Hirayama model ftting results for the decays.
IV.CONCLUSION
Our experiments demonstrate that there is a distinct near-infrared emission about 1000 nm from Tm3+/Yb3+codoped LiYF4single crystal prepared by Bridgman techniques excited by a 465 nm light.A high energy transfer efciency from Tm3+to Yb3+ions in LiYF4crystal is confrmed from recorded absorption,luminescence spectra(excitation and emission),and luminescence decay curves.The Yb3+ions emit two near-infrared photons about 1000 nm through energy transfer from Tm3+to Yb3+,with maximum quantum efciency as high as 167.5%for LiYF4∶0.49mol%Tm3+/5.99mol%Yb3+sample,under excitation of blue photon at 465 nm.These Tm3+/Yb3+codoped LiYF4single crystals are promising materials for applications in solar cells since the advantages of better optical properties,efcient near-infrared quantum cutting,and stable chemical properties.
V.ACKNOWLEDGMENTS
This work was supported by the National Natural Science Foundation of China(No.51472125 andNo.51272109)and K.C.Wong Magna Fund in Ningbo University.
[1]L.Fu,H.Xia,Y.Dong,S.Li,H.Jiang,and B.Chen, IEEE Photon.J.6,2600209(2014).
[2]Q.Y.Zhang,G.F.Yang,and Z.H.Jiang,Appl.Phys. Lett.91,051903(2007).
[3]Q.Y.Zhang,C.H.Yang,Z.H.Jiang,and X.H.Jiang, Appl.Phys.Lett.90,061914(2007).
[4]G.Lakshminarayana and J.Qiu,J.Alloy Compd.481, 582(2009).
[5]J.Hu,H.Xia,H.Hu,Y.Zhang,H.Jiang,and B.Chen, J.Appl.Phys.112,073518(2012).
[6]J.Sun,Y.Sun,Z.Xia,and H.Du,Appl.Phys.B111, 367(2013).
[7]D.L.Dexter,Phys Rev.108,630(1957).
[8]Q.Y.Zhang and X.F.Liang,J.Soc.Inform.Display.16,755(2008).
[9]L.Xie,Y.Wang,and H.Zhang,Appl.Phys.Lett.94, 061905(2009).
[10]G.Lakshminarayana,H.C.Yang,S.Ye,Y.Liu,and J. R.Qiu,J.Phys.D4,175111(2008).
[11]S.Ye,B.Zhu,J.Luo,J.X.Chen,G.Lakshminarayana, and J.R.Qiu,Opt.Exp.16,8989(2008).
[12]Q.Wang,B.Yang,Y.Zhang,H.Xia,T.Zhao,and H. J iang,J.Alloy Compd.581,801(2013).
[13]T.Tsuboi,H.Murayama,and K.Shimamura,J.Alloy Compd.408/412,776(2006).
[14]J.Klafter and M.F.Shlesinger,Proc.Natl.Acad.Sci. USA83,848(1986).
[15]M.Inokuti and F.Hirayama,J.Chem.Phys.43,1978 (1965).
10.1063/1674-0068/28/cjcp1407115
∗Author to whom correspondence should be addressed.E-mail:hpxcm@nbu.edu.cn
(Dated:Received on July 16,2014;Accepted on January 11,2015)
 CHINESE JOURNAL OF CHEMICAL PHYSICS2015年1期
- CHINESE JOURNAL OF CHEMICAL PHYSICS的其它文章
- Nanosecond Rapid Crystallization of Water Induced by Quartz Glass under Dynamic Compression
- Benzene and Toluene Levels Measured with DOAS During Vehicular Restrictions in Beijing
- Antimicrobial Expanded Polytetrafuoroethylene Film Prepared byγ-ray Radiation Induced Grafting of Poly(acrylic acid)
- Aromatic Compounds Production from Sorbitol by Aqueous Catalytic Reforming
- Synthesis of Hierarchically Porous CaFe2O4/Carbon Fiber Hybrids and Microwave Induced Catalytic Activity
- Infuence of Triarylamine and Indoline as Donor on Photovoltaic Performance of Dye-Sensitized Solar Cells Employing Cobalt Redox Shuttle