
Uncertainties in Quantitatively Estimating the Atmospheric Heat Source over the Tibetan Plateau
2014-12-08 07:33:52DUANAnMinWANGMeiRongandXIAOZhiXiang
DUAN An-Min , WANG Mei-Rong , and XIAO Zhi-Xiang
1 State Key Laboratory of Numerical Modeling for Atmospheric Science and Geophysical Fluid Dynamics, Institute of Atmospheric Physics, Chinese Academy of Sciences, Beijing 100029, China
2 University of Chinese Academy of Sciences, Beijing 100049, China
3 Nanjing University of Information Science & Technology, Nanjing 210044, China
1 Introduction
The Tibetan Plateau (TP), located in the subtropical central and eastern Eurasian continent, acts as a huge,elevated atmospheric heat source (AHS) in spring and summer (Flohn, 1957; Ye and Gao, 1979, Wu et al.,2012). Results based on both data analysis and numerical simulation have revealed that the thermal forcing of the TP facilitates an early monsoon onset with strong East Asian summer monsoon circulation to its east and a dry and hot climate in mid-Asia to its west (Duan and Wu,2005; Duan et al., 2013). In interannual variability, strong diabatic heating over the TP generally leads to abovenormal precipitation in the Yangtze and Huaihe River basins (Zhao and Chen, 2001; Duan and Wu, 2004; Wang et al., 2013). During recent years, increasing attention has been paid to the decadal change or long-term trend in AHS over the TP and its possible impact on the Asian summer monsoon and climate change in the surrounding areas (Zhu et al., 2007; Liu et al., 2012; Duan et al.,2013). Results suggest that the overall southward retreat of the rainfall belt of the East Asia summer monsoon is closely related to the weakened AHS over the plateau.
Due to rare observational records and inhomogeneous distribution of meteorological stations, many previous studies have estimated the intensity and trend in AHS over the plateau by using reanalysis data. By the adopting reverse computation method, for example, Zhu et al.(2007) calculated the trend in AHS over the TP by using National Centers for Environmental Prediction/National Center for Atmospheric Research (NCEP/NCAR) reanalysis from 1960 to 2004. Their results show that the AHS over the TP underwent a persistent downward trend in spring and summer, particularly during the most recent 20 years. However, results from different reanalysis datasets are not completely consistent, with some even showing opposite signals. Wang et al. (2012) compared the trends of AHS over the TP during 1980–2008 in three reanalysis datasets. They identified decreasing trends in NCEP/NCAR and NCEP/Department of Energy (DOE)and an increasing trend in Japanese 25-year Reanalysis(JRA-25).
On the basis of station observations and satellite data from the International Satellite Cloud Climatology Project(ISCCP), Duan and Wu (2008) revealed a persistent weakening trend in AHS, particularly in the spring sensible heat flux (SHF) over the TP since 1980s. Yang et al.(2011a, b) argued that the effect of the heat exchange and biases of the surface net radiation in satellite data and in the China Meteorological Administration (CMA) gaugemeasured precipitation loss may influence the trend in AHS. Their result of the trend in AHS over the entire TP during 1984–2006 was –7 W m–2per decade, which is much weaker than that reported by Duan and Wu (2008)at –12 W m–2per decade during 1984–2003. Therefore,uncertainties are apparent in the accurate estimation of the AHS over the TP. The aim of the study is to provide a comprehensive discussion on this topic by comparing the results from a variety of data sources and methods.
2 Data and methods
The data used in this study include the following sources:
1) Regular surface meteorological observations with an initial quality control provided by CMA. Data were gathered four times daily at 2:00, 8:00, 14:00, and 20:00 Beijing time (BJT). Variables include surface air temperature(Ta), ground surface temperature (Ts), wind speed at 10 m above the surface (V), and daily accumulated precipitation(Pr).
2) ISCCP (http://isccp.giss.nasa.gov/projects/flux.html)and the Global Energy and Water Cycle Experiment-Surface Radiation Budget (GEWEX-SRB, http://eosweb.larc.nasa.gov/PRODOCS/srb/table_srb.html) satellite radiation data. Radiation fluxes include downward and upward shortwave and longwave fluxes at the top of the atmosphere and at the surface. Both datasets are from 1984 to 2007, with horizontal resolutions of 2.5° × 2.5°and 1° × 1°.
3) Daily mean diabatic heating data from three reanalysis products of NCEP/DOE (Kanamitsu et al., 2002),JRA-25 (Kazutoshi et al., 2007), and ERA-Interim produced by the European Centre for Medium Range Weather Forecasts (Dee et al., 2011). The horizontal resolution was 1.875° ´ 1.88° for NCEP/DOE, 1.125° ´ 1.12°for JRA-25, and 1.5° ´ 1.5° for ERA-Interim. The numerical prediction models, assimilation programs, and observing systems from NCEP/DOE are nearly the same as those from NCEP/NCAR; some errors in the latter were corrected, and some improvements are primarily reflected in surface temperature, radiation flux, surface water balance, and other surface fluxes. In particular, the rainfall data assimilation significantly improved model simulation of soil moisture (Zhao et al., 2010). Therefore,the NCEP/DOE reanalysis dataset may be considered as an updated version of NCEP/NCAR (Zhao et al., 2010,Zhao and Fu, 2006; Kanamitsu et al., 2002).
Because both ISCCP and GEWEX-SRB data are available during 1984–2007, to convenient compare AHS in terms of intensity and trend between station-derived results and reanalysis data, we chose this period for all datasets. Moreover, the most significant trend in AHS over the plateau that occurred in spring (March–May)during the last decades (Duan and Wu, 2008; Wang et al.,2012; Zhu et al., 2012), the spring mean AHS, and each component were selected for discussion.
For a given region, the AHS (sink) is defined by air column heat gain (loss) and can be expressed as

where SHF represents the local surface sensible heat transfer, LH is the latent heat released to the atmosphere due to condensation, and RC is the net radiation flux of the air column.
For calculation of SHF, the bulk aerodynamic method is widely used:
where Cp=1005 J kg–1K–1is the specific heat of dry air at constant pressure, ρais air density that decreases exponentially with elevation, and CDHis the (dimensionless)drag coefficient for heat that generally increases with land surface roughness.
LH can be roughly calculated by precipitation by

where Lw= 2.5×10⁶J kg–1is the condensation heat coefficient, and ρwdenotes water density, and the subscript w refers the water.
where R∞and R0are the net radiation values at the top of the atmosphere and at the Earth’s surface, respectively. S and F denote shortwave and longwave radiation fluxes,respectively; ∞ and 0 denote the top of the atmosphere and the ground surface, respectively; and ↓ and ↑ represent downward and upward transfer, respectively.
3 Results
3.1 Uncertainties in SHF and LH based on station distribution
Limited by the remote location, inclement climate, and sparse population, significantly fewer routine meteorological stations are situated over the TP than those in other regions of China. The density of surface meteorological stations within the TP domain is only 34 per million km2,which is significantly lower than the average of 260 per million km2over China. Although researchers investigating the AHS over the TP often adopt records from 73 stations, the spatial distribution is remarkably inhomogeneous. As shown in Fig. 1a, most of the stations are located in the central and eastern TP, east of 85°E, whereas only two are located in the western TP, west of 85°E. Therefore, because the AHS derived by station observations can effectively represent actual conditions only in the central and eastern TP, most of the existing studies based on station observations focus mainly on this area.
In addition to the spatial inhomogeneity, altitude positions of meteorological stations may also induce uncertainty in estimating the AHS. Table 1 shows that grids with elevations higher than 5000 m above sea level over and around the TP domain (25–40°N, 75–105°E) account for 31% of the total; those between 4000 m and 5000 m account for 33%; those between 3000 m and 4000 m account for 19%; and those between 2000 m and 3000 m accounts for 17%. However, no stations have elevations above 5000 m. In fact, there are only 17 stations above 4000 m, 29 with elevations between 3000 m and 4000 m,and 27 between 2000 m and 3000 m, accounting for 23%,40%, and 37%, respectively. Thus, station data can depict the meteorological variables only below 5000 m; records above 5000 m are incomplete for nearly one-third of the TP.
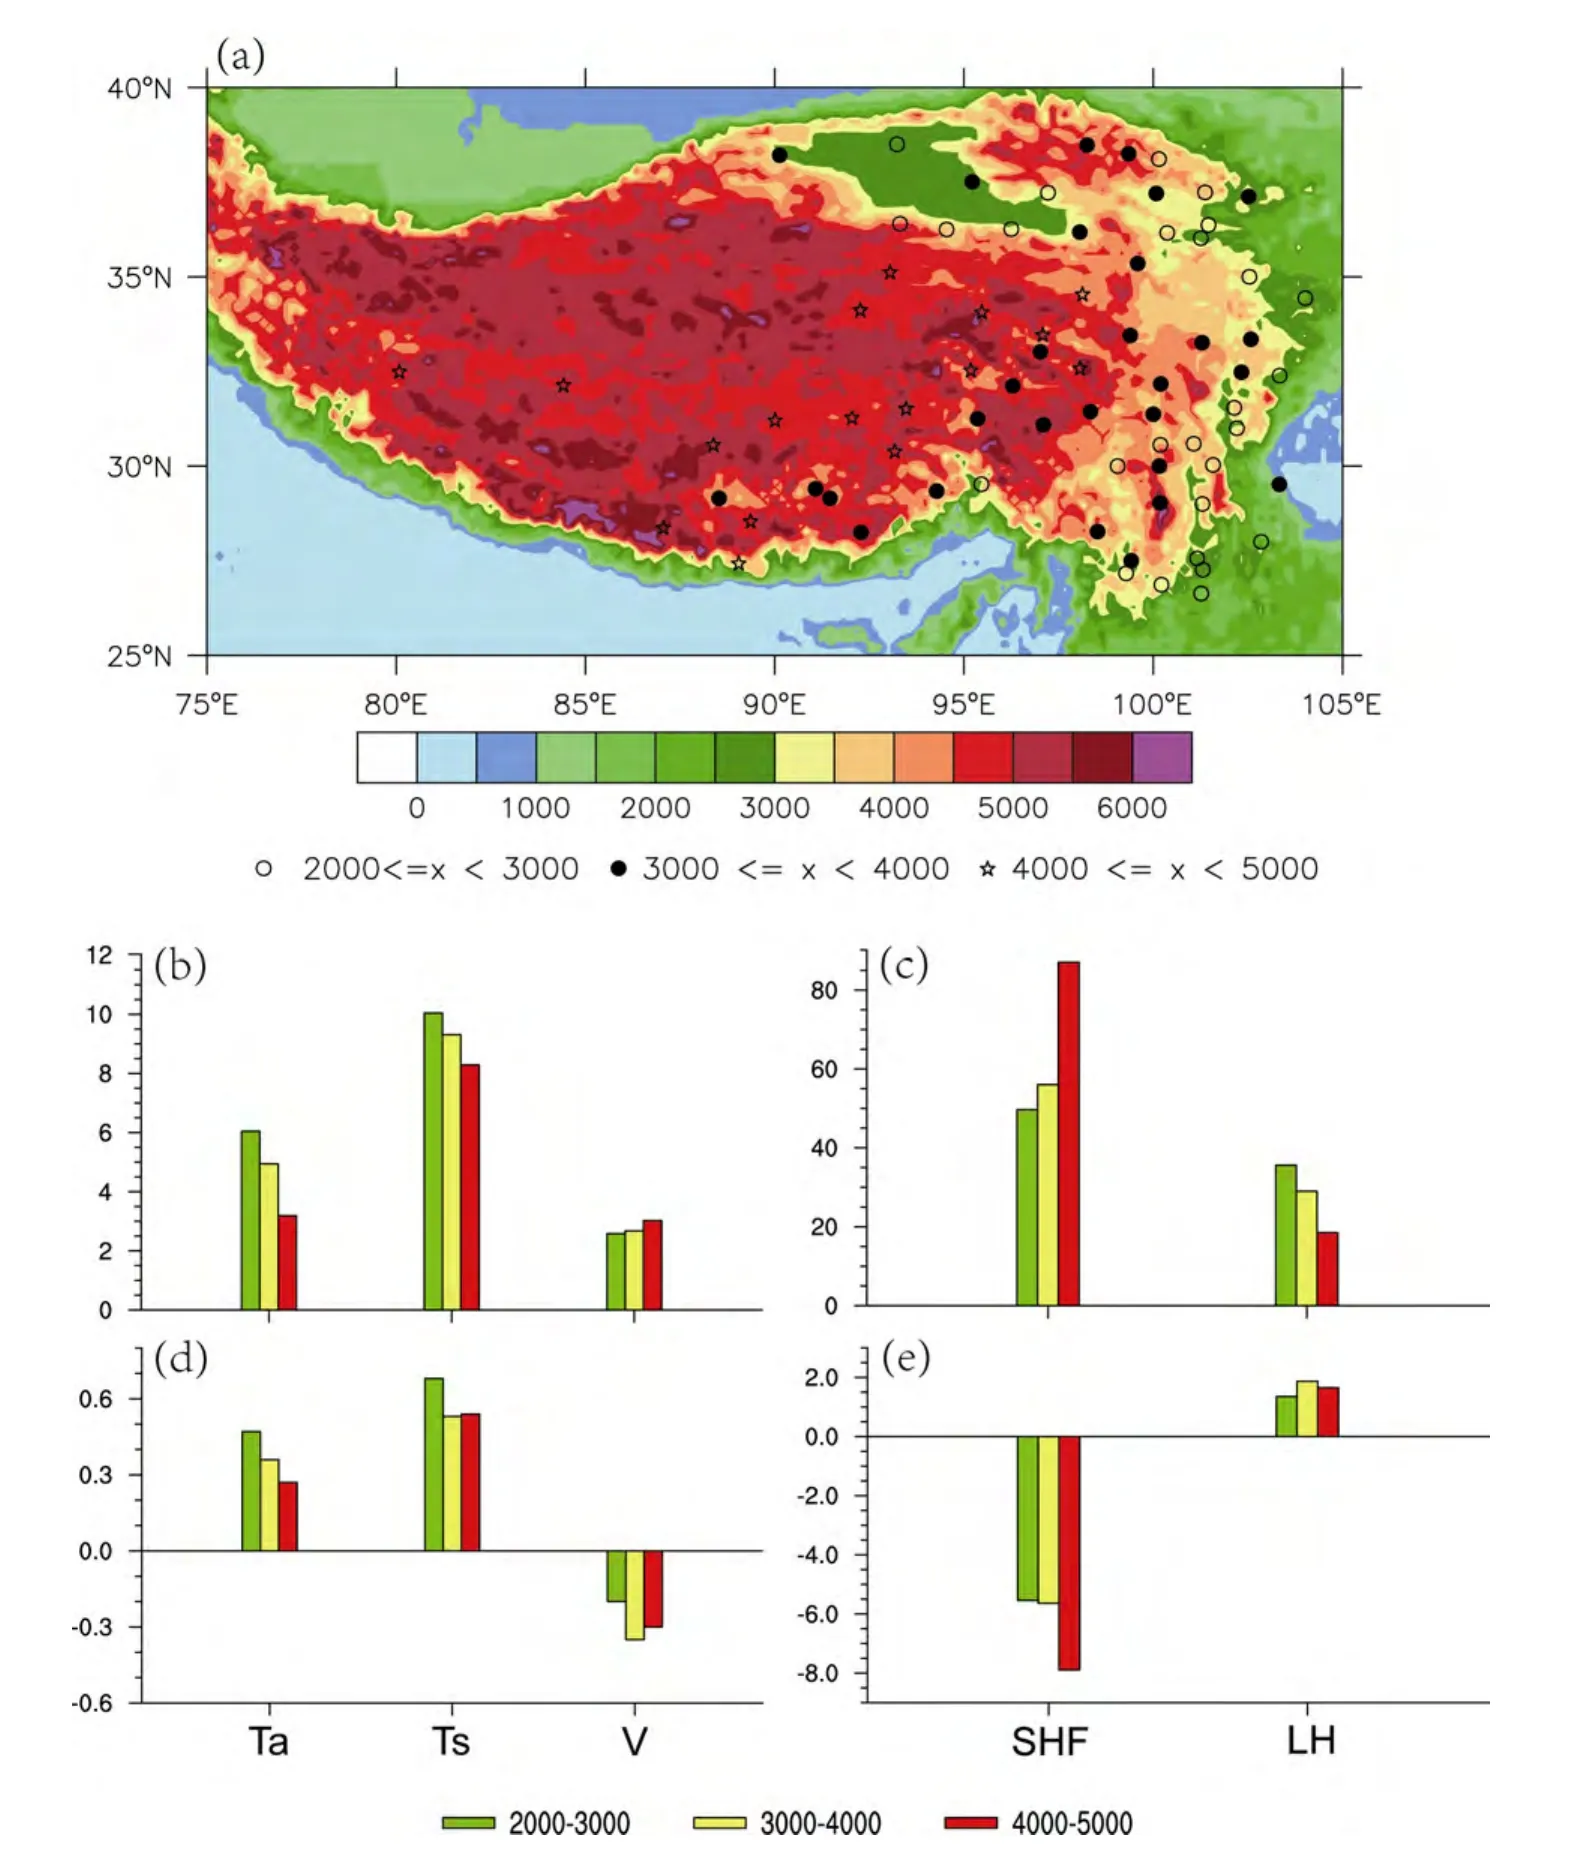
Figure 1 (a) Terrain height (units: m) over and around the Tibetan Plateau (TP) and the locations of 73 meteorological stations across the plateau.Open circles, solid circles, and stars denote the stations with elevations at 2000–3000 m, 3000–4000 m, and 4000–5000 m, respectively. Elevation dependence of (b, c) spring mean and (d, e) linear trend of the Ta (units: °C and °C per decade), Ts (units: °C and °C per decade), V (units: m s–1 and m s–1 per decade), local surface sensible heat transfer (SHF) (units: W m–2 and W m–2 per decade), and latent heat released to the atmosphere due to condensation (LH) (units: W m–2 and W m–2 per decade) during 1984–2007 are averaged by 71 stations over the central and eastern TP.

Table 1 Numbers and proportions of routine meteorological stations and grid points at various classifications according to the elevation over the TP.
We plotted the spring mean and linear trends in Ta, Ts,V, SHF, and LH during 1984–2007 over the central and eastern TP, which were sorted by elevation, in Figs. 1b–e.The climatology characteristics of Ta, Ts, and LH decreased with an increase in elevation, whereas the opposite case occurred in V and SHF. For climate change, a robust upward trend occurred in Taand Tsat all stations.The warming amplitude in Tapresents a clear elevation-dependent feature such that it decreased gradually with elevation ascent. The case for Tsdiffered somewhat;the largest trend appeared within 2000–3000 m but no clear difference was detected at 3000–4000 m and 4000–5000 m. For the annual mean and winter mean in Ts, previous studies (Liu and Chen, 2000; Qin et al., 2009) reported a tendency for the warming trend to increase with the elevation in the TP and its surrounding areas. Our results were similar. We detected a warming rate increase from 3000 m to 5000 m above sea level, whereas the warming trend in Tsbelow 2000 m was nearly equal to that above 4000 m. Given the differences in the period,data, and season for research, the results may vary to some degree. The near surface wind speed V decelerated systematically with the largest amplitude appearing within 3000–4000 m and again at 4000–5000 m. The results of the two components of the AHS, i.e., SHF and LH, differed completely, with the former showing a clear weak-ening trend and the latter showing an increasing trend.The amplitude in the SHF change is obviously larger than that in LH and was enhanced with height increase; this feature was particularly significant at 4000–5000 m. Considering the fact that no observation exits above 5000 m and the station proportion with elevations between 4000 m and 5000 m is much less than that lower than 4000 m,both the intensity and trend in SHF over the TP might be underestimated by using station observations. Moreover,the region higher than 5000 m above sea level is largely covered by glaciers and snow, which may also cause large uncertainties in evaluating the intensity and trend in the all of the studied parameters.
In addition to data coverage, the bulk formula in Eq.(2) includes further bias in calculating SHF because direct SHF observation is absent in most routine stations. A definitive method for determining the CDHvalue over the TP has not been reported. Ye and Gao (1979) synthesized previous results to give the mean value of CDHas 8×10⁻³over the TP. On the basis of data from the Qinghai-Xizang Plateau Meteorological Sciences Experiment (QXPMEX),Chen and Wong (1984) put forward a ten-day averaged CDHparameterized scheme. Afterward, Chen et al. (1985)obtained a smaller value of 4×10⁻³by using this parameterized scheme. On the basis of data from two (four) sets of automatic weather stations over the western (central and eastern) TP from July 1993 to March 1999, Li et al.(2000, 2001) estimated the CDHvalue by using the flux-profile relationship, with results of 6–6.4 × 10⁻³at the western TP and 4.8 × 10⁻³at the central and eastern TP. Recently, Yang et al. (2011b) discussed the differences between methods for estimating the trend in SHF over the TP for the period 1984–2006. Their results indicated that CDHdepends on atmospheric stability and thermal roughness length and varies in both temporal and spatial domains. Assuming CDHis a constant value or a simple function of wind speed will induce bias in the trend of SHF, although the climatology is nearly same.
Furthermore, real LH intensity obtained by using Eq.(3) with precipitation data may be underestimated systematically at all stations for the precipitation loss in measurement due to wind-induced undercatch, wetting loss, and trace amounts of precipitation (Ye et al., 2004).Wind-induced gauge undercatch was determined to cause the greatest error in most regions, whereas the latter two aspects of are important in low-precipitation regions in northwestern China (Ye et al., 2004).
3.2 Uncertainties in RC induced by satellite data retrieval
Because there is a lack of ground-based radiation flux data at the top of atmosphere and the data quality of station-observed surface long wave radiation flux is questionable, one component of the AHS, i.e., RC, is typically derived by satellite remote sensing data. Relative to SHF and LH, the uncertainties of RC in terms of intensity and trend are comparable. To demonstrate this point, we plotted in Fig. 2 the temporal evolution and liner trend in RC in spring during 1984–2007 over the central and eastern TP in both GEWEX-SRB and ISCCP data. RC in GEWEX-SRB was approximately 10 W m–2less than that in ISCCP in many years. Moreover, the trend between the two shows a large difference in amplitude. The trend in RC during 1984–2007 was –4.9 W m–2per decade and–2.1 W m–2per decade in ISCCP and GEWEX-SRB, respectively. As documented by many authors, this discrepancy is induced mainly by the uncertainty in net radiation fluxes at the ground surface because retrieval of the surface radiation budget is more difficult than that at the top of the atmosphere (Yang et al., 2011a; Wang et al.,2012).
3.3 Uncertainties in AHS in reanalysis data
Figure 3 a shows the spring mean AHS and each component over the central and eastern TP during 1984–2007 determined on the basis of observation and three reanalysis datasets. The average AHS, SHF, LH, and RC from 71 stations was 37 W m–2, 60 W m–2, 29 W m–2, and –52 W m–2, respectively, denoting the dominant contribution of SHF to the overall intensity of AHS before the rainfall season. However, both LH intensity and its contribution in reanalysis data, particularly in ERA-Interim, were larger than those in the station data. In addition, the observed intensity in RC and SHF was stronger in observation than that in all three reanalysis datasets to a different degree.Therefore, the overall intensity of AHS in JRA-25 is nearly twice of observation-based results at 71 stations.
Figure 3 b shows the linear trend and error estimation in AHS during this period. Relative to climatology, changes in AHS over the TP present a larger discrepancy with a higher uncertainty. The sign in SHF change in all reanalysis datasets corresponded with station-based results;however, similar amplitude was detected in only JRA-25.Generally, no significant trend exited in all terms of diabatic heating and in the total AHS in ERA-Interim. In JRA-25, the large positive trend in LH compensated for the sum of negative trends in SHF and RC and led to an opposite change signal in AHS. In NCEP/DOE, changes in LH and RC were very weak, thereby causing the significant negative trend in SHF to result in a weakened spring AHS. Overall, NCEP/DOE provided the most similar change in AHS to observation-based results over the central and eastern TP but had nearly twice the amplitude. Therefore, uncertainties in trends in diabatic heating are larger than those in climatology over the TP. More remarkably, uncertainties in observation-based results also exist, particularly for trends in AHS and RC. Hence, adequate observation covering more areas is imperative for obtaining a deeper understanding of the role of thermal forcing of the TP in climate regime and variability.
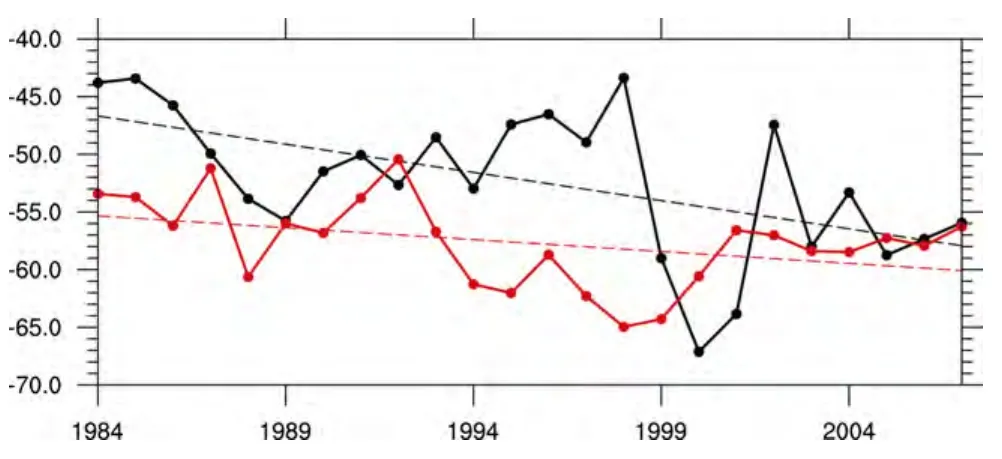
Figure 2 Temporal evolutions of spring mean air column net radiation flux (net radiation flux of the air column (RC), units: W m–2) over the central and eastern TP (28–38°N, 85–105°E) from datasets of the International Satellite Cloud Climatology Project (ISCCP; black line) and Surface Radiation Budget (SRB; red line) recorded during 1984–2007.

Figure 3 (a) Spring mean and (b) linear trend in atmospheric heat source (AHS), LH, RC, and SHF over central and eastern TP during 1984–2007 determined on the basis of observational data and three reanalysis datasets. Units for climate mean and trend are W m–2 and W m–2 per decade, respectively. Bars indicate uncertainty at the 95% confidence level based on standard deviation. All results in reanalysis data have been interpolated onto the locations of 71 stations and ISCCP radiation flux data to estimate RC at the stations.
4 Concluding remarks
Diabatic heating fields over the TP show multi-scale variation in both space and time. In this work, we presented a comprehensive discussion on the uncertainties in accurate estimation of the AHS over the TP in terms of intensity and trend. The factors related to these uncertainties arise primarily from the absence of sufficient observational records; imperfect theories, methods, and models further aggravate the situation. Two components of AHS,i.e., SHF and LH, can be calculated directly from historical records at routine meteorological stations. Bias in the former appears to be larger than that in the latter due to the absence of actual SHF observation. Researchers calculating SHF by the bulk formula with Ts– Taand V generally choose the drag coefficient for heat, CDH, as an empirical constant without considering atmospheric stability and thermal roughness length, which results in further uncertainty, particularly in the trend of SHF. Nevertheless,observation-based results indicate that both intensity and trend in SHF over the TP are enhanced with elevation increase. Because no routine stations exist above 5000 m,the contribution of SHF to the total heat source may be underestimated, according to the existing outcomes based on observation. RC can be determined thus far only by satellite remote sensing data. The uncertainty in RC over the TP is by no means less than SHF or LH due to short length limitations and the evident discrepancy among various data sources induced by algorithms in data inversion and complex terrain.
In reanalysis data, rare observational records for data assimilation and model bias in physical processes also induce many errors in producing the diabatic heating fields over the TP. Moreover, further uncertainties in estimating the atmospheric apparent heat source/sink occur in the adoption of the reverse computation method for the error in vertical velocity (Wang et al., 2012) induced by extremely inhomogeneous topography (Yanai and Tomita,1998; Wang and Zeng, 2012).
In the future, it is necessary to established more routine and automatic meteorological stations over the TP, particularly for regions in the northwest and at high elevations. Observation in surface heat fluxes should be included at more stations. In addition, calibration of satellite-derived radiation flux data is essential for obtaining accurate AHS in terms of both intensity and variation.
Acknowledgements.We sincerely thank the two anonymous reviews for their helpful comments and suggestions on the manuscript. This work is jointly supported by the the National Natural Science Foundation of China (Grants 91337216 and 41175070) and the Open Project of the Key Laboratory of Meteorological Disaster of Ministry of Education (Grant KLME1309).
Chen, L. X., E. R. Reiter, and Z. Q. Feng, 1985: The atmospheric heat source over the Tibetan Plateau: May–August 1979, Mon.Wea. Rev., 113, 1771–1790.
Chen, W. L., and D. M. Wong, 1984: Preliminary study about computing methods of sensible heat and latent heat total quantity in ten-day period over Qinghai-Xizang plateau, in: Meteorology Scientific Experiment Treatises about Qinghai-Xizang Plateau(2), Science Press, Beijing, 35–45.
Dee, D. P., S. M. Uppala, A. J. Simmons, et al., 2011: The ERAInterim reanalysis: Configuration and performance of the data assimilation system, Quart. J. Roy. Meteor. Soc., 137, 553–597.
Duan, A. M., M. R. Wang, Y. H. Lei, et al., 2013: Trends in summer rainfall over China associated with the Tibetan Plateau sensible heat source during 1980–2008, J. Climate, 26, 261–275.
Duan, A. M., and G. X. Wu, 2004: Heating modes over the Tibetan Plateau in July and the correlation patterns of circulation and precipitation over east Asia, Climate Dyn., 18(2), 167–178.
Duan, A. M., and G. X. Wu, 2005: Role of the Tibetan Plateau thermal forcing in the summer climate patterns over subtropical Asia, Climate Dyn., 24, 793–807
Duan, A. M., and G. X. Wu, 2008: Weakening trend in the atmospheric heat source over the Tibetan Plateau during recent decades. Part I: Observations, J. Climate, 21, 3149–3164.
Flohn, H., 1957: Large-scale aspects of the summer monsoon in South and East Asia, J. Meteor. Soc. Japan, 35, 180–186.
Kanamitsu, M., W. Ebisuzaki, and J. Woollen, et al., 2002: NCEPDOE AMIP-II reanalysis (R-2), Bull. Amer. Meteor. Soc., 83,1631–1643.
Kazutoshi, O., T. Junichi, K. Hiroshi, et al., 2007: The JRA-25 reanalysis, J. Meteor. Soc. Japan, 85, 369–432.
Li, G. P., Y. Y. Duan, and Y. F. Gong, 2000: The bulk transfer coefficients and surface fluxes on the western Tibetan Plateau,Chinese Sci. Bull. (in Chinese), 45, 865–869.
Li, G. P., T. Duan, Y. Gong, et al., 2001: Estimates of the bulk transfer coefficients and surface fluxes over the Tibetan Plateau using AWS data, J. Meteor. Soc. Japan, 79, 625–635.
Liu, X. D., and B. D. Chen, 2000: Climatic warming in the Tibetan Plateau during recent dedades, Int. J .Climatol., 20, 1729–1742.
Liu, Y. M., G. X. Wu, and J. L. Hong, et al., 2012: Revisiting Asian monsoon formation and change associated with Tibetan Plateau forcing: II. Change, Climate Dyn., 39(5), 1183–1195.
Qin, J., K. Yang, S. L. Liang, et al., 2009: The altitudinal dependence of recent rapid warming over the Tibetan Plateau,Climatic Change, 97, 321–327.
Wang, A. H., and X. B. Zeng, 2012: Evaluation of multireanalysis products with in situ observations over the Tibetan Plateau, J.Geophys. Res., 117(D05102), doi:10.1029/2011JD016553.
Wang, M. R., S. W. Zhou, and A. M. Duan, 2012: Trend in the atmospheric heat source over the central and eastern Tibetan Plateau during recent decades: Comparison of observations and reanalysis data, Chinese Sci. Bull., 57, 548–557, doi:10.1007/s11434-011-4838-8.
Wang, Z. Q., A. M. Duan, and G. X. Wu, 2013: Time-lagged impact of spring sensible heat over the Tibetan Plateau on the summer rainfall anomaly in East China: Case studies using the WRF model, Climate Dyn, doi:10.1007/s00382-013-1800-2.
Wu, G. X., Y. M. Liu, J. L. Hong, et al., 2012: Revisiting Asian monsoon formation and change associated with Tibetan Plateau forcing: I. Formation, Climate Dyn., 39, 1183–1195.
Yanai, M., and T. Tomita, 1998: Seasonal and interannual variability of atmospheric heat sources and moisture sinks as determined from NCEP-NCAR reanalysis, J. Climate, 11, 463–482.
Yang, K., X. F. Guo, H. Jie, et al., 2011a: On the climatology and trend of the atmospheric heat source over the Tibetan Plateau: Anexperiments-supported revisit, J. Climate, 24, 1525–1541.
Yang, K., X. F. Guo, and B. Y. Wu, 2011b: Recent trends in surface sensible heat flux on the Tibetan Plateau, Sci. China Ser. D-Earth Sci., 54, 19–28.
Ye, B. S., D. Q. Yang, Y. J. Ding, et al., 2004: A bias-corrected precipitation climatology for China, J. Hydrometeorol., 5,1147–1160.
Ye, D. Z., and Y. X. Gao, 1979: Meteorology of the Qinghai-Xizang(Tibet) Plateau, Science Press, Beijing, 278pp.
Zhao, P., and L. X. Chen, 2001: The climate characteristics of the atmospheric heat source over the Tibetan Plateau in past 35 years and its relationship with rainfall in China, Sci. China Ser.D-Earth Sci. (in Chinese), 31, 327–332.
Zhao, T. B., and C. B. Fu, 2006: Preliminary comparison and analysis between ERA-40, NCEP-2 reanalysis and observations over China, Climate Envion. Res. (in Chinese), 11, 14–32.
Zhao, T. B., C. B. Fu, Z. J. Ke, et al., 2010: Global atmospheric reanalysis datasets: Current status and recent advances, Adv.Earth Sci. (in Chinese), 25, 242–254.
Zhu, X. Y., Y. M. Liu, and G. X. Wu, 2012: An assessment of summer sensible heat flux on the Tibetan Plateau from eight data sets, Sci. China Ser. D-Earth Sci., 55, 779–786, doi:10.1007/s11430-012-4379-2.
Zhu, Y. X., Y. H. Ding, and H. G. Xu, 2007: The decadal relationship between atmospheric heat source of winter and spring snow over Tibetan Plateau and rainfall in east China, Acta Meteor. Sinica(in Chinese), 65, 946–958.
 Atmospheric and Oceanic Science Letters2014年1期
- Atmospheric and Oceanic Science Letters的其它文章
- Interdecadal Variability in Large and Small Warm Pools in Western Pacific and Their Association with Rainfall Anomalies
- Evaluation of Reanalysis Products with in situ GPS Sounding Observations in the Eastern Himalayas
- Sensitivity of Precipitation in Aqua-Planet Experiments with an AGCM
- Real-Time Observation on Water-Soluble Ions of PM2.5 in Beijing under the Influences of Different Air Masses in Summer
- Aerosol Direct Radiative Forcing over Shandong Peninsula in East Asia from 2004 to 2011
- Robustness of Precipitation Projections in China: Comparison between CMIP5 and CMIP3 Models