Classification of Diabetic Macular Edema and Its Stages Using Color Fundus Image
Muhammad Zubair, Shoab A.Khan, and Ubaid Ullah Yasin
1.Introduction
Diabetes mellitus (DM) is a very common disease;every one out of ten people are affected[1].According to World Health Organization, this number is expected to rise to epidemic level up to 2020 due to extended life expectancy and changing lifestyle[2].Pakistan stands at number seven recently and if this ratio remains constant, in 2025 it will be at the fifth position in record of the top countries having diabetic patients, an estimate by International Diabetic Federation (IDF)[3].DM affects different body organs through molecular and biochemical changes leading to structural and micro-vascular abnormalities.The ocular diseases due to diabetes are diabetic retinopathy (DR), diabetic macular edema (DME),retinal detachment (RD), cataracts, and glaucoma.Diabetic retinopathy and macular edema remain the leading causes of visual compromise in working-age groups with 135 million individuals affected across the world.29% of people who are affected by DME are those having diabetes duration of 20 years or more[4].The Pakistan national blindness and visual impairment survey 2004 reveals that among 1.5 million blind people, 0.5 million people were affected by diabetes[5].This percentage is increasing with time due to the increase of diabetic patients and abrupt population increase.However, the available health care professionals, resources, and the equipment are not enough for the present population.To control the disease rate a screening tool is required for timely diagnosis which is often delayed due to sparse and inaccessible medical resources.
The pathogenesis of DME is multi-factorial; breakdown of blood retinal barrier, vascular leakage, and lipid deposition within retinal layers lead to retinal thickening and exudates formation in macular region[6].Ophthalmologists diagnose DME by examining the retina of patient through fundoscopy, retinal images are acquired by fundus fluorescein angiography (FFA), as seen in Fig.1, and optical coherence tomography (OCT).These image acquiring processes help doctor identifying any disease as well as its stage, type, and severity.Some of the previously proposed techniques for the classification of DME are discussed.

Fig.1.Right-eye colored fundus image.
Aquino et al.[7]gave a technique based on morphological operations and edge detection of the optic disc while using circular Hough transform for boundary estimation.Gardner et al.[8]used artificial neural network techniques for the automated classification of images having exudates or not.Nayak et al.[9]used artificial neural network to build a computerized intelligent diagnostic system for the grading of DR and the possibility of diabetic DME.Sánchez et al.[10]proposed a thresholding technique for the segmentation of hard exudates.The algorithm used dynamic thresholding for the segmentation of exudates from the background.García et al.[11]detected hard exudates by using neural network.Local characteristics of exudates were used by combining the global and adaptive histogram thresholding method.Archarya et al.[12]detected exudates by using morphological operations to generate fine contrast between the background area and the foreground present exudates.The early detection of exudates was carried out by Sopharak et al.from low contrast digital fundus images by using a fuzzy C-means(FCM) clustering technique in [13].Lim et al.[14]used a marker-controlled watershed segmentation technique.A contrast adjustment was carried out as a preprocessing step by using an averaging filter.In [15], Siddalingaswamy and Prabhu classified the diabetic maculopathy stages on the basis of difference of intensity value.
2.Data and Proposed Method
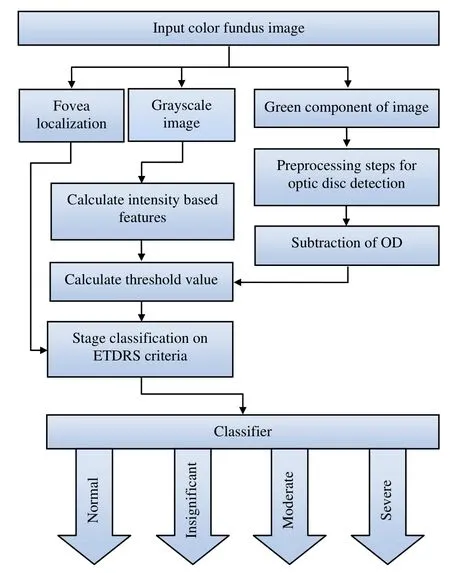
In the proposed work, first the optic disc is detected and eliminated from the image after exudates are identified by using a classifier.Stage classification is done on the basis of an early treatment diabetic retinopathy study (ETDRS)standard criteria.The results are classified as normal, less significant, moderate, and severe case.Fig.2 shows the flow chart of the proposed technique.
2.1 Image Database
The image dataset is taken from publically available database MESSIDOR (http://messidor.crihan.fr).
2.2 Optic Disc Detection and Elimination
Preprocessing steps are performed for the enhancement of the optic disc which involves adaptive histogram equalization and contrast stretching transformation.The detected optic disc is then subtracted from the original image to get an optic disc (OD) free image.
2.3 Exudates Segmentation
As exudates are the only bright regions in the image after the optic disc removal, the exudates are detected in the image by using a segmentation technique.Segmentation is done by using a dynamic thresholding.As the intensity of each individual image varies the threshold value is determined by using information of the intensity features of the image.

Fig.2.Flow chart of proposed technique.
2.4 Staging of Macular Edema
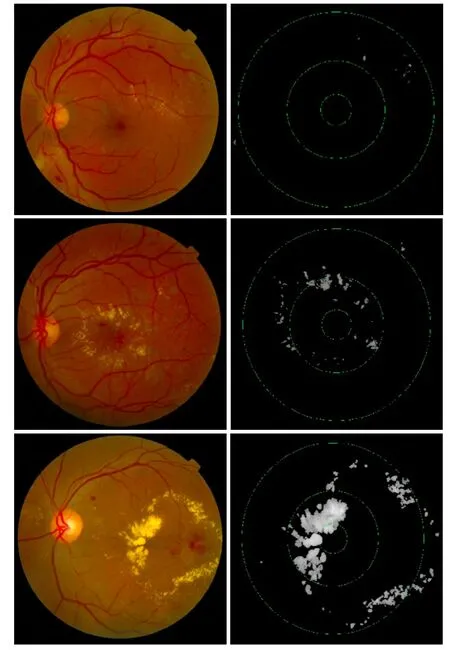
The stage classification was based on the standard criteria set by ETDRS[16].The severe stage is declared when the abnormality is found within 1/3DD or 0.5 mm of circular radius from the fovea.The moderate stage occurs if exudates are found within 1DD or 1.5 mm circular radius from the fovea region but out of the 1/3DD of circle.A less significant stage is announced if the abnormality is found beyond the 1DD circular boundary but within a circular radius of 2DD or 3 mm from the center.However, if no abnormality is found in any of these circles the case is declared as normal.
Fig.3 shows the results where the 1st row shows the less significant stage of disease, the 2nd row is the case of moderate stage of disease while the 3rd row shows a severe stage.
3.Experimental Results and Analysis
The proposed technique was tested on 1200 images having different intensity levels from MESSIDOR database.The dataset covers a variety of disease cases that can occur in the classification of DME.A performance comparison in terms of sensitivity, specificity, and accuracy of the proposed system with previously suggested techniques can be seen in Table 1.

Table 1: Performance comparison of different techniques

Fig.3.Column 1 shows the original image and Column 2 shows the classification on the basis of detected exudates.
4.Conclusions and Future Works
This automated system helps ophthalmologists in diagnosis and classification of the disease with a reasonable accuracy by saving their time, effort, and resources.
The system can further be improved by categorizing the detected abnormalities on the base of their size.The intensity value and the edge information of the detected exudates can be used to differentiate between hard and soft exudates.
[1]J.G.Cunha-Vaz.(1998).Diabetic macular edema.[Online].Available: http://hdl.handle.net/10400.4/845
[2]H.King, R.E.Aubert, and W.H.Herman, “Global burden of diabetes, 1995-2025: Prevalence, numerical estimates,and projections,” Diabetes Care, vol.21, no.9, pp.1414-1431, 1998.
[3]International Diabetic Federation Atlas.(2012).Prevalence of Diabetes in 2007 and Future Projection for 2025.[Online].Available: http://www.idf.org/diabetesatlas
[4]R.Klein, B.Klein, S.Moss, M.Davis, and D.DeMets, “The Wisconsin epidemiologic study of diabetic retinopathy: II.prevalence and risk of diabetic retinopathy when age at diagnosis is less than 30 years,” Journal of Archives of Ophthalmology, vol.102, no.4, pp.520-526, 1984.
[5]M.Z.Jadoon, B.Dineen, R.R.Bourne, S.P.Shah, M.A.Khan, G.J.Johnson, et al., “Prevalence of blindness and visual impairment in Pakistan: The Pakistan national blindness and visual impairment survey,” Ⅰnvest Opthalmol Vis Sci., vol.47, no.11, pp.4749-4755, 2006.
[6]D.A.Antonetti, E.Lieth, A.J.Barber, and T.W.Gardner,“Molecular mechanisms of vascular permeability in diabetic retinopathy,” Seminars in Ophthalmology, vol.14, no.4, pp.240-248, 1999.
[7]A.Aquino, M.E.Gegúndez, and D.Marín, “Detecting the optic disc boundary in digital fundus images using morphological, edge detection, and feature extraction techniques,” ⅠEEE Trans.on Med.Ⅰmag., vol.29, pp.1860-1869, Nov.2010.
[8]G.Gardner, D.Keating, T.H.Williamson, and A.T.Elliot,“Automatic detection of diabetic retinopathy using an artificial neural network: A screening tool,” British Journal of Ophthalmology, vol.80, no.11, pp.940-944, 1996.
[9]J.Nayak, P.S.Bhat, and U.R.Acharya, “Automatic identification of diabetic maculopathy stages using fundus images,” Journal of Medical Engineering &Technology, vol.33, no.12, pp.119-129, 2009.
[10]C.I.Sánchez, M.García, A.Mayo, M.I.López, and R.Hornero, “Retinal image analysis based on mixture models to detect hard exudates,” Med.Ⅰmag.Anal., vol.13, pp.650-658, May 2009
[11]M.García, C.I.Sánchez, M.I.López, D.Abásolo, and R.Hornero, “Neural network based detection of hard exudates in retinal images,” Comput.Meth.Prog.Bio., vol.93, pp.9-19, Jul.2008.
[12]U.R.Archarya, C.M.Lim, E.Y.K.Ng, C.Chee, and T.Tamura, “Computer–based detection of diabetes retinopathy stages using digital fundus images,” Proc.Ⅰnst.Mech.Eng.H.vol.223, pp.545-553, Feb.2009.
[13]A.Sopharak, B.Uyyanonvara, and S.Barman, “Automatic exudates detection from non-dilated diabetic retinopathy retinal images using fuzzy c-means clustering,” Sensors, vol.9, pp.2148-2161, Mar.2009.
[14]S.T Lim, W.M.D.W.Zaki, A.Hussain, S.L.Lim, and S.Kusalavan, “Automatic classification of diabetic macular edema in digital fundus images,” in Proc.of ⅠEEE Conf.Colloquium on Humanities, Science and Engineering Research, Penang, 2011, pp.265-269.
[15]P.C.Siddalingaswamy and K.G.Prabhu, “Automatic grading of dabetic maculopathy severity levels,” in Proc.ofⅠnt.Conf.on Systems in Medicine and Biology, Kharagpur,2010, pp.331-334.
[16]E.Y.Chew, M.L.Klein, F.L.Ferris III, N.A.Remaley, R.P.Murphy, K.Chantry, B.J.Hoogwerf, and D.Miller,“Association of elevated serum lipid levels with retinal hard exudate in diabetic retinopathy: Early treatment diabetic retinopathy study (ETDRS) report 22,” Arch.Ophthalmol.,vol.114, no.9, 1079-1084, 1996.
 Journal of Electronic Science and Technology2014年2期
- Journal of Electronic Science and Technology的其它文章
- Decision Bayes Criteria for Optimal Classifier Based on Probabilistic Measures
- Call for Papers Journal of Electronic Science and Technology Special Section on Terahertz Technology and Applications
- Efficient Terahertz Photoconductive Emitters with Improved Electrode Structures
- Absorption Spectrum Studies on the RDX Crystals with Different Granularity in Terahertz Frequency Range
- Terahertz Time-Domain Spectroscopy and Its Applications
- Low Power Computing Paradigms Based on Emerging Non-Volatile Nanodevices
