Response to climate change of different tree species and NDVI variation since 1923 in the middle arid region of Ningxia, China
YaJun Wang , RuiJie Lu , YuZhen Ma , HongWei Meng , ShangYu Gao
1. College of Life Sciences, Beijing Normal University, Beijing 100875, China
2. Hebei University of Engineering, Handan, Hebei 056038, China
3. Key Laboratory of Environmental Change and Natural Disaster, Ministry of Education of China, Beijing Normal University,Beijing 100875, China
4. State Key Laboratory of Earth Surface Processes and Resource Ecology, Beijing Normal University, Beijing 100875, China
1 Introduction
The normalized difference vegetation index (NDVI),defined by near-infrared and red reflectance remote sensing images, reflects changes in land vegetation (Wanget al., 2005; Tanget al., 2006). It is considered to be the most effective index for monitoring regional and global vegetation coverage and ecological environmental change,with wide applications in vegetation remote sensing(Tuckeret al., 1986; Fanget al., 2004; Luoet al., 2009).However, this data, recorded since the 1980s, is unable to provide data about earlier environmental evolution.
Tree-ring data have been broadly used in the study of paleoclimate, allowing the reconstruction of precipitation(Treydteet al., 2006), temperature (Gurskayaet al.,2012), the Palmer Drought Severity Index (Cooket al.,2010), streamflow (Cook and Jacoby, 1983) and sea surface temperature (D’Arrigoet al., 1993). Studies on nat-ural disasters by tree-ring data, such as glacier fluctuation(Luckman, 1993), volcanic explosions (Briffa, 1998),earthquakes (Sheppard and White, 1995), and pest plagues (Swetnam and Lynch, 1993) have all achieved good results. High-resolution information about past environmental change can also be reconstructed from tree-ring data.
The Luoshan Mountains, surrounded by desertified land, lies in the middle arid region of the Ningxia Hui Autonomous Region, bordering the Tengger Desert and the Mu Us Desert. The ecological environment in this region is fragile and the vegetation growth is sensitive to climatic change. The reaction of tree radial growth to precipitation (Wanget al., 2010) and the Palmer Drought Severity Index (Wanget al., 2013)has been studied, but there are no reports on the reaction of different tree species growing in the same habitat to climate change and the relation between NDVI and tree-ring width. The present study explored the correlation between NDVI and ring width ofP. tabulaeformisandPicea crassifoliagrowing in the same habitat, and revealed past high-resolution NDVI changes by ring width ofP. crassifolia. This provides information for the study of environmental changes in this fragile area and regional response to global change, and offers material that may be beneficial to research on the dynamics of forest communities and vegetation renewal.
2 Materials and methods
2.1 Tree-ring data
The Luoshan Mountains (Figure 1) are located inland,far from the ocean, and the climate is dry. The main peak is 2,624.5 m a.s.l., with an average elevation of 1,065 m.The vertical distribution of the vegetation is distinctly zoned with increasing elevation, from desert grassland to shrubland, broadleaf forest, conifer/broadleaf forest, and conifer forest. The sampling site was in a semi-arid area with comparatively low precipitation.

Figure 1 Locations of study area and sampling site
The tree-ring cores were collected in the upper distribution limit ofP. tabulaeformis(37°18′N, 106°16′E;2,400 m) in the transition zone whereP. crassifoliafirst appears. These trees were 15–20 m in height, and the canopy ofP. tabulaeformisandP. crassifoliawas 0.6–0.8.Many plant species were present in the shrub layer and herb layer beneath the trees. The ground layer was well developed, with a small accumulation of pine needles.One or two cores were taken from each of 20P. tabulaeformisand 20P. crassifoliatrees on a partly shaded slope.
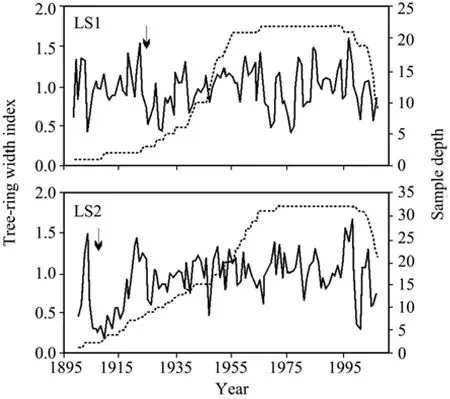
Following common procedures for tree-ring analysis(Stokes and Smiley, 1968), the cores were dried, fixed and polished, and their width measured by a LINTAB ring width measurement device with a precision of 0.01 mm. Cross-dating and measured results were tested using the COFECHA quality control program (Holmes, 1983).As a result, some cores were excluded due to low correlation coefficients compared to the main sequence,anomalous values, or short length. Chronologies were then established using the ARSTAN program (Cook and Holmes, 1986). Taking into account the background of tree growth trends produced by genetic characteristics, a negative exponential function (Fritts, 1976) was used to fit the tree growth trend and remove the trend. Finally, the standard chronologies for bothP. crassifolia(LS1) andP.tabulaeformis(LS2) were developed (Figure 2, Table 1).
Tree-ring theory generally posits that higher values of MS, CC, and EPS indicate that the tree growth is sensitive to the change of climate factors; the samples selected contain more population signals of tree growth.Although the core number of the LS1 chronology is just 22 cores, according to MS, CC, and other statistics the cores selected can better represent the growth characteristics ofP. crassifoliain the sampling site, and some information on environment change can be drawn from the LS1 chronology.

Figure 2 Ring width chronology and sample depth. The solid line represents the yearly value and the dotted line indicates the sample depth; the arrow indicates the year for which the coefficient of subsample signal strength (Csss) was >0.80
2.2 NDVI data
NOAA/AVHRR NDVI 15-day (maximum) composite data for August of 1981 to December of 2006 were downloaded from the Environmental and Ecological Science Data Center for West China, National Natural Science Foundation of China (http://westdc.westgis.ac.cn). The spatial resolution of the NDVI database was 8 km and the temporal resolution was 15 days.
The NDVI data used in this study were selected from the 0.5°×0.5° region containing the coring site. The regional NDVI was obtained by averaging the NDVI values of all the pixels in the selected region. The maximum of the two NDVI values in one month was selected as the monthly NDVI value.
2.3 Climate data
Data for the monthly average temperature and monthly total precipitation around the study area for 1981–2007 was retrieved from the Tongxin Meteorological Station (36°59′N, 105°54′E; 1,345 m). Annual precipitation was 267.0 mm; from June to August, it was 156.7 mm, or 58.7% of the annual precipitation, most of which fell in August. The average annual temperature was 9.5 °C; the highest temperatures occurred in July,averaging 23.3 °C.
2.4 Methods
A correlation analysis was performed to analyze the relation between NDVI, climate factors, and tree-ring width, and a regression analysis was carried out to develop the conversion equation between the tree-ring width and NDVI. The equation was cross-validated(Walpol and Myers, 1985; Liu and Shao, 2003) since the measured data spanned only 26 years.

Table 1 Sample site information and statistics for the chronologies
3 Results
3.1 NDVI change in one year
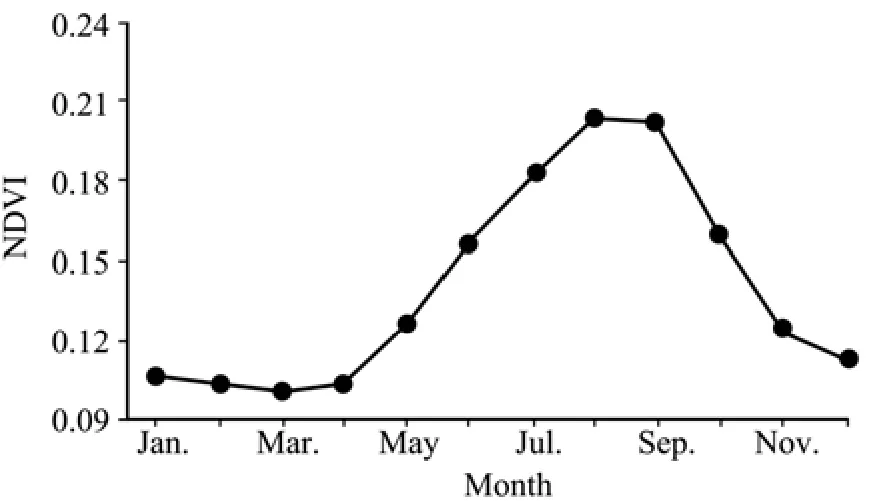
The annual change trend of NDVI (Figure 3) shows that the NDVI values in January, February, and March slightly decreased, and the minimum was in March. The April NDVI (0.1043) was slightly higher than that in March (0.1022), implying that the vegetation was beginning to grow; in May it increased more rapidly, and it began to show an obvious increase from June to August,when it reached its maximum value. From September the NDVI value gradually reduced as the vegetation was beginning to enter the wilted period. Most of the vegetation stopped growing in November, giving an NDVI close to that in May. The December and January NDVI values showed no measurable difference. The NDVI values from April to November were selected for the following analysis.
3.2 Correlations between NDVI and precipitation, and between NDVI and temperature
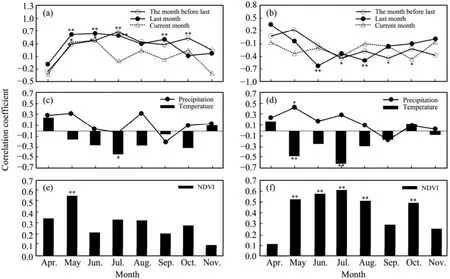
The correlations were analyzed between NDVI and monthly precipitation, and between NDVI and temperature, for the current month and for the previous two months. The correlations between NDVI and precipitation illustrated that NDVI correlated more significantly with precipitation in the last month and the month before the last than with precipitation in the current month.Vegetation growth has a lag response to precipitation:rain significantly affected vegetation coverage in the following month, and also had an obvious influence on coverage in the succeeding month. The correlation(Figure 4a) was clearly positive in most months except April, when NDVI negatively correlated with precipitation in February, March, and April. For example, significant positive correlation was found between the May NDVI and precipitation in March (p<0.01), April (p<0.01), and May (p<0.05); during the June NDVI and precipitation in April (p<0.01), May (p<0.01), and June (p<0.05); between the July NDVI and precipitation in May (p<0.01) and June (p<0.05); between the August NDVI and precipitation in July; and during both the September NDVI and October NDVI and precipitation in August (p<0.01).

Figure 3 Annual monthly NDVI
Due to the arid climate in this region, higher temperatures cause increased water consumption through evaporation and transpiration, and therefore less available moisture for vegetation growth and a lower NDVI due to the reduced growth rate. The results of correlations between NDVI and temperature (Figure 4b) showed that NDVI had a negative correlation with temperature in most months, reaching the 0.05 confidence level in July and October. NDVI negatively correlated with temperature in either one or two months earlier: for example, the NDVI in June correlated with temperature in May; the NDVI in August correlated with temperature in July (p<0.01); the NDVI in July correlated with temperature in May; and the NDVI in September correlated with temperature in July (p<0.05).
3.3 Correlations between tree-ring width and precipitation, and between tree-ring width and temperature
Neither the correlation between tree-ring widths forP.crassifoliaand precipitation nor temperature from April to November (Figure 4c) was statistically significant. The positive correlation coefficient with May precipitation was relatively high. Further analysis showed that tree-ring width correlated positively and significantly with spring precipitation. Wide rings develop when spring precipitation increases. The ring width correlated negatively with temperature in most months, approaching the 0.05 confidence level in July.
The correlation between tree-ring width ofP. tabulaeformisand precipitation, and between tree-ring width and temperature, from April to November (Figure 4d)showed that ring width correlated positively with precipitation in most months except September, and reached the 0.05 confidence level in May. Tree-ring width negatively correlated with temperature in most months, and significantly correlated with temperature in May (p<0.01) and July (p<0.01). It can be seen that more rain and lower temperatures in the growth season in the study area were advantageous to radial growth ofP. tabulaeformis.
In summary, radial growth ofP. tabulaeformisis more sensitive to precipitation and temperature change thanP. crassifoliais, namely, the hydrothermal conditions in this zone better meets the growth needs of the latter.P. crassifoliais probably the better of the two species for protecting the forest ecosystem and conserving water in the Luoshan desertification area.
3.4 Correlation between NDVI and tree-ring width
Tree-ring widths ofP. crassifoliahad a significantly positive correlation with NDVI (Figure 4e) in May (p<0.01); in particular, the correlation coefficient with average NDVI for April–May was maximal (r=0.641,p<0.001).
The correlation between the April–November NDVI and tree-ring width forP. tabulaeformiswas analyzed(Figure 4f). The positive correlations between ring width and NDVI in May, June, July, August, and October were at the 0.01 confidence level. Further analysis revealed that the correlation coefficient between ring width and average NDVI for April to August was 0.693 (p<0.001).
Tree-ring width forP. tabulaeformissignificantly correlated with NDVI during the peak growth period. ForP. crassifolia,tree-ring width correlated significantly with NDVI in the early growth season. Tree-ring widths ofP.tabulaeformisand NDVI for April–August all significantly correlated with precipitation for April–August,indicating that appreciable precipitation in the growth season is beneficial to vegetation growth, as might be expected.
Tree-ring widths ofP. crassifoliaand April–May NDVI all positively correlated with precipitation for April–May, indicating that wide rings and high NDVI values correspond to greater spring rainfall and provide a reasonable explanation for the significantly positive correlation between tree-ring width and April–May NDVI.
Despite the fact that the correlation between ring width ofP. crassifoliaand precipitation did not reach the significance level, correlation with July temperature was significant (r=-0.443,p<0.05), and the correlation coefficient between ring width and NDVI in April–May was high (r=0.641,p<0.001). No reconstruction by ring width ofP. crassifoliaand strong uniformity in the trend of tree-ring width and April–May NDVI make us to extract NDVI information from the change of ring width ofP.crassifolia. This also confirms the universality of applying tree-ring data to the reconstruction of past environmental conditions.
3.5 The establishment of a conversion equation between tree-ring width and NDVI
For the present study, the tree-ring widths ofP. crassifoliawere selected as the predictor for reconstructing April–May NDVI (NDVI4–5). The conversion equation is:

whereXis tree-ring width. The correlation coefficient of equation(1)isr= 0.641 (p<0.001); the explained variance is 41.1%; the adjusted explained variance is 38.6%;and the test valueF=16.07 (p<0.001), showing that the equation has a high significance. The reconstructed and the measured NDVI are shown in figure 5.
Cross-validation was applied to test the stability of the equation and reliability of the reconstruction using a number of test parameters. The reduction error (RE) is a reliable statistic that precisely examines the climate reconstruction, and is a more effective diagnostic tool than other test statistics (Wu, 1990). In this study RE=0.29,greater than 0, which shows that equation(1)is a feasible means of reconstructing NDVI4–5change.

Figure 4 Correlation coefficients between monthly NDVI and climate data and between monthly NDVI and tree-ring width: (a) NDVI and precipitation; (b) NDVI and temperature; (c) LS1 and precipitation, temperature; (d) LS2 and precipitation, temperature;(e) LS1 and NDVI; (f) LS2 and NDVI. ** refers to 0.01 confidence level; * refers to 0.05 confidence level

Figure 5 Contrast between the reconstructed and the measured NDVI
3.6 Analysis of reconstructed NDVI4–5
The year for the coefficient of the subsample signal strength (Wigleyet al., 1984), Csss >0.80, was selected as the beginning of the reconstruction. This study reconstructed the NDVI4–5from 1923 to 2007 (Figure 6).
Figure 6 shows that changes have obviously taken place since 1923 in the Luoshan Mountains. Points below the average NDVI represent a relatively low vegetation cover, and those above the average represent a relatively high vegetation cover. Thus, relatively high vegetation cover occurred in 1936–1939, 1944–1965, and 1979–1999, and there was relatively low vegetation cover in 1925–1935, 1940–1943, 1966–1978, and 2000–2005.The area experienced two significant periods of increasing vegetation: 1928–1961 and 1975–1986, and two of decreasing vegetation: 1962–1974 and 1987–2003.

Figure 6 Reconstruction of NDVI4–5 showing five-year moving averages. The thin line shows yearly value and the smooth line represents the five-year moving average. Horizontal line indicates overall average
The relatively low vegetation coverage in the 1920s–1930s, the 1960s–1970s, and the early 21st century was represented in the Palmer Drought Severity Index (PDSI) changes for May–July in the Helan Mountains during those periods (Chenet al., 2010), also in the low PDSI for May-June in the Changling Mountains(Chenet al., 2011). It can be seen that there is some synchronization between NDVI variation in the Luoshan Mountains and climatic modification in the surrounding areas.
The low NDVI in 1966–1977 in the study area corresponds to the high degree of aridity in the 1960s to the 1970s and throughout northern China from 1950 to 2000(Wang and Zhai, 2003). The low NDVI also coincides with the weakening of the Indian summer wind in the mid-1960s and late 1970s (Heet al., 2005). The probable reason is that Indian Low Pressure abates when the Indian summer monsoon is weak and water vapor from low latitudes reduces, so the precipitation in the study area decreases. The comparison between NDVI reconstruction and the East Asian Summer Monsoon Index (EASMI)(http://web.lasg.ac.cn/staff/ljp/index.html) shows that the low NDVI in the 1960s conforms to the low EASMI in the 1960s to the 1970s. The environment change in study area is stamped by global climate evolution.
4 Conclusions
The NDVI of ground vegetation in the Luoshan Mountains is strictly limited by the amount of precipitation, especially during the two months prior to growth,allowing for the lag time between rainfall and vegetation growth. Tree-ring widths forP. tabulaeformissignificantly correlated with the NDVI for April–August(r=0.693,p<0.01), andP. crassifoliacorrelated with the NDVI in April–May (i.e., NDVI4–5) (r=0.641,p<0.01).
NDVI4–5reconstruction since 1923 was based on tree-ring widths fromP. crassifolia. It shows that there was relatively more vegetation in the study area in 1936–1939, 1944–1965, and 1979–1999 with a humid climate, and less vegetation in 1925–1935, 1940–1943,1966–1978, and 2000–2005 with a dry climate.
Authors thank reviewers for their valuable comments.This research was supported by the National Natural Science Foundation of China (No. 41171159), and the Key Program of the Hebei Education Department (No.ZH2012035).
Briffa KR, Jones PD, Schweingruber FH,et al., 1998. Influence of volcanic eruptions on Northern Hemisphere summer temperature over the past 600 years. Nature, 393(4): 450–454. DOI:10.1038/30943.
Chen F, Yuan YJ, Wei WS,et al., 2010. Long-term drought severity variations recorded in tree rings in the northern Helan Mountains.Advances in Climate Change Research, 6(5): 344–348.
Chen F, Yuan YJ, Wei WS,et al., 2011. Reconstruction of May-June Palmer Drought Severity Index at South Margin of Tengger Desert,China since A.D. 1691. Scientia Geographica Sinica, 31(4):434–439.
Cook ER, Anchukaitis KJ, Buckley BM,et al., 2010. Asian monsoon failure and megadrought during the last millennium. Science,328(5977): 486–489. DOI: 10.1126/science.1185188.
Cook ER, Holmes RL, 1986. Users Manual for Program ARSTAN.Laboratory of Tree-ring Research. Univ. of Arizona, Tucson, AZ.
Cook ER, Jacoby GC, 1983. Potomac River streamflow since 1730 as reconstructed by tree rings. Journal of Climate and Applied Meteorology, 22(10): 1659–1672. http://dx.doi.org/10.1175/1520-0450(1983)022<1659:PRSSAR>2.0.CO;2.
D’Arrigo RD, Cook ER, Jacoby GC,et al., 1993. NAO and sea surface temperature signatures in tree-ring records from the North Atlantic sector. Quaternary Science Reviews, 12: 431–440. DOI: 10.1007/BF03182768.
Fang JY, Piao SL, He JS,et al., 2004. Increasing terrestrial vegetation activity in China, 1982–1999. Science in China (Series C: Life Sciences), 47(3): 229–240. DOI: 10.1007/BF03182768.
Fritts HC, 1976. Tree Rings and Climate. Academic Press, London.
Gurskaya M, Hallinger M, Singha J,et al., 2012. Temperature reconstruction in the Ob River valley based on ring widths of three coniferous tree species. Dendrochronologia, 30: 302–309.
He LF, Wu BY, Mao WX, 2005. The interdecadal variability of Indian summer monsoon and the climate state shift in north China. Journal of Tropical Meteorology, 21(3): 257–264.
Holmes RL, 1983. Computer-assisted quality control in tree-ring dating and measurement. Tree-Ring Bulletin, 43: 69–75.
Liu HB, Shao XM, 2003. Reconstruction of early-spring temperature of Qinling Mountains using tree-ring chronologies. Acta Geographica Sinica, 58(6): 879–884.
Luckman BH, 1993. Glacier fluctuation and tree-ring records for the last millennium in the Canadian Rockies. Quaternary Science Reviews, 12: 441–450.
Luo L, Wang ZM, Song KS,et al., 2009. Research on the correlation between NDVI and climatic factors of different vegetations in northeast China. Acta Botanica Boreall-Occidentalia Sinica, 29(4):800–808.
Sheppard PR, White LO, 1995. Tree-ring response to the 1978 earthquake at Stephens Pass, northeastern California. Geology, 23:109–112. DOI: 10.1130/0091-7613(1995)023<0109:TRRTTE>2.3.CO;2.
Stokes MA, Smiley TL, 1968. An Introduction to Tree-Ring Dating.University of Chicago Press, Chicago.
Swetnam TW, Lynch AM, 1993. Multicentury, regional-scale patterns of western spruce budworm outbreaks. Ecological Monographs,63(4): 399–424.
Tang HY, Xiao FJ, Zhang Q,et al., 2006. Vegetation change and its response to climate change in the Three-River source region. Advances in Climate Change Research, 2(4): 177–180.
Treydte KS, Schleser GH, Helle G,et al., 2006. The twentieth century was the wettest period in northern Pakistan over the past millennium.Nature, 440(27): 1179–1182. DOI: 10.1038/nature 04743.
Tucker CJ, Fung IY, Keeling CD,et al., 1986. Relationship between atmospheric CO2variations and a satellite-derived vegetation index.Nature, 319(6050): 195–199. DOI: 10.1038/319195a0.
Walpol RE, Myers RH, 1985. Probability and Statistics for Engineers and Scientists. Macmillan Publishing Company, New York.
Wang JS, Yin QJ, Yang YL, 2005. A study of Qinghai grassland productivity using NOAA/AVHRR. Plateau Meteorology, 24(1):117–122.
Wang YJ, Gao SY, Ma YZ,et al., 2010. Reconstructing the annual precipitation variation since 1899 based on tree-ring width in the western Hedong sandy land of Ningxia. Journal of Arid Land, 2(4): 286–294.
Wang YJ, Lu RJ, Ma YZ,et al, 2013. Annual variation in PDSI since 1897 AD in the Tengger Desert, Inner Mongolia, China, as recorded by tree-ring data. Journal of Arid Environments, 98: 20–26.
Wang ZW, Zhai PM, 2003. Climate change in drought over northern China during 1950–2000. Acta Geographica Sinica, 58(suppl. 7):61–68.
Wigley TML, Briffa KR, Jones PD, 1984. On the average value of the correlated time series, with applications in dendroclimatology and hydrometeorology. Journal of Climate and Applied Meteorology,23(2): 201–213. http://dx.doi.org/10.1175/1520-0450(1984)023<0201:OTAVOC>2.0.CO;2.
Wu XD, 1990. Tree Ring and Climate Change. China Meteorological Press, Beijing.
 Sciences in Cold and Arid Regions2014年1期
- Sciences in Cold and Arid Regions的其它文章
- Assessment of sandy desertification trends in the Shule River Basin from 1978 to 2010
- A quantitative assessment on groundwater salinization in the Tarim River lower reaches, Northwest China
- Relationship between pollen assemblages and organic geochemical proxies and the response to climate change in the Zhuye Lake sediments
- State of the art and practice of pavement anti-icing and de-icing techniques
- New advances in the study of Alpine glaciations
- Lake Area Changes and the main causes in the hinterland of Badain Jaran Desert during 1973–2010, China
