
Lake Area Changes and the main causes in the hinterland of Badain Jaran Desert during 1973–2010, China
2014-10-09 08:10:58ZhenYuZhangNaiAngWangNingMaYueWu
ZhenYu Zhang, NaiAng Wang , Ning Ma, Yue Wu
College of Earth and Environmental Science/Center for Climate Change and Hydrologic Cycle in Arid Region, Lanzhou University, Lanzhou, Gansu 730000, China
1 Introduction
Lakes constitute an important component of the terrestrial hydrosphere and are highly sensitive to climate change. They are affected by both climate change and anthropogenic activities, making them significant indicators of global drivers and regional responses (Ma RHet al., 2011). Located in the margin of the monsoon region and spanning the provinces of Gansu, Ningxia,and Inner Mongolia, the Badain Jaran Desert has many lakes widely distributed in its southeastern area (Zhuet al., 1980). Because they are located in a hyper-arid zone, these lakes are important environmental resources and are highly significant in maintaining the regional biodiversity, preventing desertification of the surroundings, improving the regional ecological environment, and promoting the local people’s living standard. For these reasons, many scholars have focused on the water resources in this desert (e.g., Yang and Martin, 2003; Yanget al., 2003; Chenet al., 2004;Donget al., 2004; Maet al., 2004; Chenet al., 2006;Yang, 2006; Ding and Wang, 2009; Yanget al., 2010;Ma JZet al., 2011; Chenet al., 2012; Donget al.,2013). Because these desert lakes have changed frequently with the background of global warming in recent years, it is necessary to accurately understand the dynamic process of desert lake changes.
Remote sensing data is fast and easy to obtain, so this technology has been widely used in lake surveys and lake changes researches. Xionget al.(2009) extracted lake information in the Badain Jaran Desert by supervised classification and visual interpretation, and pointed out that the desert lake area decreased during 1973–2007;they affirmed that human factors were the main reasons for the lake changes. From the special spectral characteristics of desert lakes, we were able to use the water index method to obtain lake information automatically and more precisely.
Many scholars have researched the causes of lake changes in China. The lakes in cold and arid regions are especially sensitive to climate change. Lakes in arid areas are affected mainly by precipitation (Dinget al., 2006),while lakes in the Tibetan Plateau are affected by air temperature and changes in recharge resources (e.g., precipitation, glacier meltwater), which are also affected by temperature on a regional scale (Dinget al., 2006; Liet al., 2011). The lakes in the mid-lower region of the Yangtze River are more controlled by human activities(Liuet al., 2008). Against the background of global warming in recent decades, are the changes in the sizes of lakes located in the hyper-arid region associated with regional climate change or anthropogenic factors, or any other factors? By revealing the change characteristic of desert lakes, not only from the standpoint of clarifying the main factors that change desert lakes, but also for further research on desert lake water balance, can provide some references on water supply sources and other scientific issues.
2 Materials and methods
2.1 Regional setting
The Badain Jaran Desert is located in the center of Alxa Plateau in western Inner Mongolia, a part of the Alxa Desert region, covering an area of 52,162 km2; it is the second largest desert in China (Zhuet al., 2010). The Badain Jaran Desert is bounded to the south by the Heli Mountains, the Beida Mountains, and the Heishantou Mountains that separate it from the Hexi Corridor. To the southeast, it is bounded by the Yabra salt lake and the Yabra Mountains, which separate it from the Tengger Desert. To the north and the west, it is bounded by the Guaizihu wetland and the Gurinai grassland.
Climatically, the area is an extreme continental desert type (Donget al., 2004), incurring extreme drought,strong sunshine, and relatively little precipitation (Maet al., 2014). The mean annual precipitation decreases from southeast (about 120 mm) to the northwest (less than 40 mm) (Ma JZet al., 2011). The mean annual air temperature ranges from 9.5 to 10.3 °C, and the temperatures increase from the south to the north as the elevation decreases (Donget al., 2013).
More than 50% of the sand sea is covered by mega-dunes 200 to 300 m tall (Zhuet al., 1980), with the tallest mega-dune up to 430 m measured by field measurements. Lying among the tallest mega-dunes in the southeast are many permanent lakes that occur in low-lying areas throughout the desert with different sizes, shapes, and salinity levels. Besides, there are many fresh springs for human and animal to drink in some desert basins. These mega-dunes and inland lakes form a unique desert landscape that has potential value for tourism development.
In early September, 2010 and at the beginning of May, 2011, our research team surveyed all the lakes in the Badain Jaran Desert by fieldwork investigation. We defined each individual enclosed water body as a lake cell. Currently, there are 146 lakes in the Badain Jaran Desert, including 119 perennial lakes and 27 seasonal lakes. Nuoertu, the largest lake in the Badain Jaran Desert hinterland, can exceed 16 m in depth. In order to concentrate our lake change research, we selected the region in the southeast of desert as our study area, between longitudes 101°40′E and 102°40′E and between latitudes 39°30′N and 40°05′N, where more than 100 lakes are concentrated within this area of approximately 4,000 km2(Figure 1).
2.2 Methods
In the Badain Jaran Desert, each lake may be supplied in a different way, and within a given lake the areal size may fluctuate greatly within one year (Zhuet al., 2011).In spring, most lake levels are highest but decline dramatically in summer, and most of them remain relatively stable in autumn. Considering these periodic seasonal lake changes, we used only remote sensing images taken in autumn and we avoided the lakes recharged by glacier and snowmelt water coming from the Qilian Mountains or the Tibetan Plateau in spring (Chenet al., 2004, 2006),those that evaporated heavily in summer, and those where the lake surface froze in winter. Our image data were from October 7, 1973 (MSS), September 17, 1990 (TM),September 20, 2000 (ETM+), and August 23, 2010 (TM).All the images were provided by the U.S. Geological Survey’s web site; the quality of the images was fine and the cloud cover was always below 1%. The images were preprocessed by geometrical correction, image mosaicking, and subsets, and the map projection was Albers-Equal-Area conical projection.
The precipitation data (1971–2010) came from the Alxa Right Banner meteorological station (101°41′E,39°13′N) and the Yabra meteorological station (102°42′E,39°18′N), located on the southern fringe of the Badain Jaran Desert.
Remote sensing images record the reflection of electromagnetic waves by ground objects and its own outside radiation information. Compared with other objects, water bodies show a weak reflectivity (about 4%–5%),manifested in the visible wavelength range. As wavelengths increase, water body reflectivity decreases to 2%–3% at 580 nm. When the wavelengths are longer than 740 nm, the water body has the feature of strong absorption (McFeeters, 1996). Thus, this wavelength range can be used to distinguish water from soil, vegetation, buildings, and other ground objects (Jensen, 1996).For multi-spectral images, the ratio-based water index is effective for defining the scope of water bodies (Wang and Ma, 2009), such as NDWI (McFeeters, 1996),MNDWI (Xu, 2005), EWI (Yanet al., 2007), and NWI(Ding, 2009). These water index models are suited to distinguishing background ground objects with soil,shadow, vegetation, buildings, and other descriptive information, but it is necessary to specify the desert lakes through the sand, vegetation and saline information. Taking this into consideration, Zhuet al.(2011) proposed a desert lake water index (DLWI):

In the Landsat TM and ETM+,bblueis band1,bmiris band5, and C is a constant to stretch the value of DLWI.Then, using threshold segmentation based on histograms, it is possible to extract the desert lakes information accurately.

Figure 1 Location of the study area
Liu (1989) and Xionget al.(2009), respectively, used the ratio method and supervised classification to extract lake information from MSS. However, those methods are not exact with desert lakes, especially the shadow information. In addition, MSS has a relatively low resolution;therefore, we used the visual interpretation method, first using image enhancement by LUT Stretch, and then taking into account the topography, solar altitude, lake survey results, and other factors to interpret lake borders to at least three pixels.
Our post-processing included: (1) eliminating the mistakes caused by lower solar altitude creating some "foreign bodies within the spectrum" between mega-dune shadows and lakes; (2) correcting redundancies where some dry saline lakes had DLWI values close to those of actual lakes;and (3) because some lakes shrank and divided in autumn,we unified the divided lakes into one lake in the same basin for improved statistical significance.
Finally, we used ArcGIS tools to compute the area and perimeter of each lake, and then formed four lake spatial databases. Figure 2 shows the distribution of the lakes at each time period.
3 Results
3.1 Characteristics of lake area changes
The number and areas of the lakes showed differences in each period. We interpreted 94 lakes larger than 0.0192 km2, with a total area of 20.61 km2in 1973; in 1990, 2000, and 2010 there were 87, 98, and 82 lakes with total areas of 17.96 km2, 17.41 km2, and 16.92 km2,respectively (Table 1).
During 1973–2010, the number of lakes showed a fluctuating trend that decreased, increased, and decreased again (Table 2). During that time period the total number of lakes was reduced by 12, with an annual average of-0.32. The number of lakes decreased by 7 during 1973–1990, with an annual average of -0.41, increased by 11 from 1990 to 2000, and decreased significantly from 2000 to 2010, with an annual rate of -1.6. The lake area changes showed a continuously decreasing trend in all of the lakes. During 1973–2010, the total lake area decreased by 3.69 km2, with an annual change rate of-0.48%. The total lake area significantly decreased in 1973–1990, and the mean annual rate was -0.76%,greater than the rate of -0.31% in 1990–2000 and-0.28% in 2000–2010. This descending trend of the annual rate of lake area change indicates that the lakes shrank greatly during 1973–1990, but they have been shrinking slowly since the 1990s.
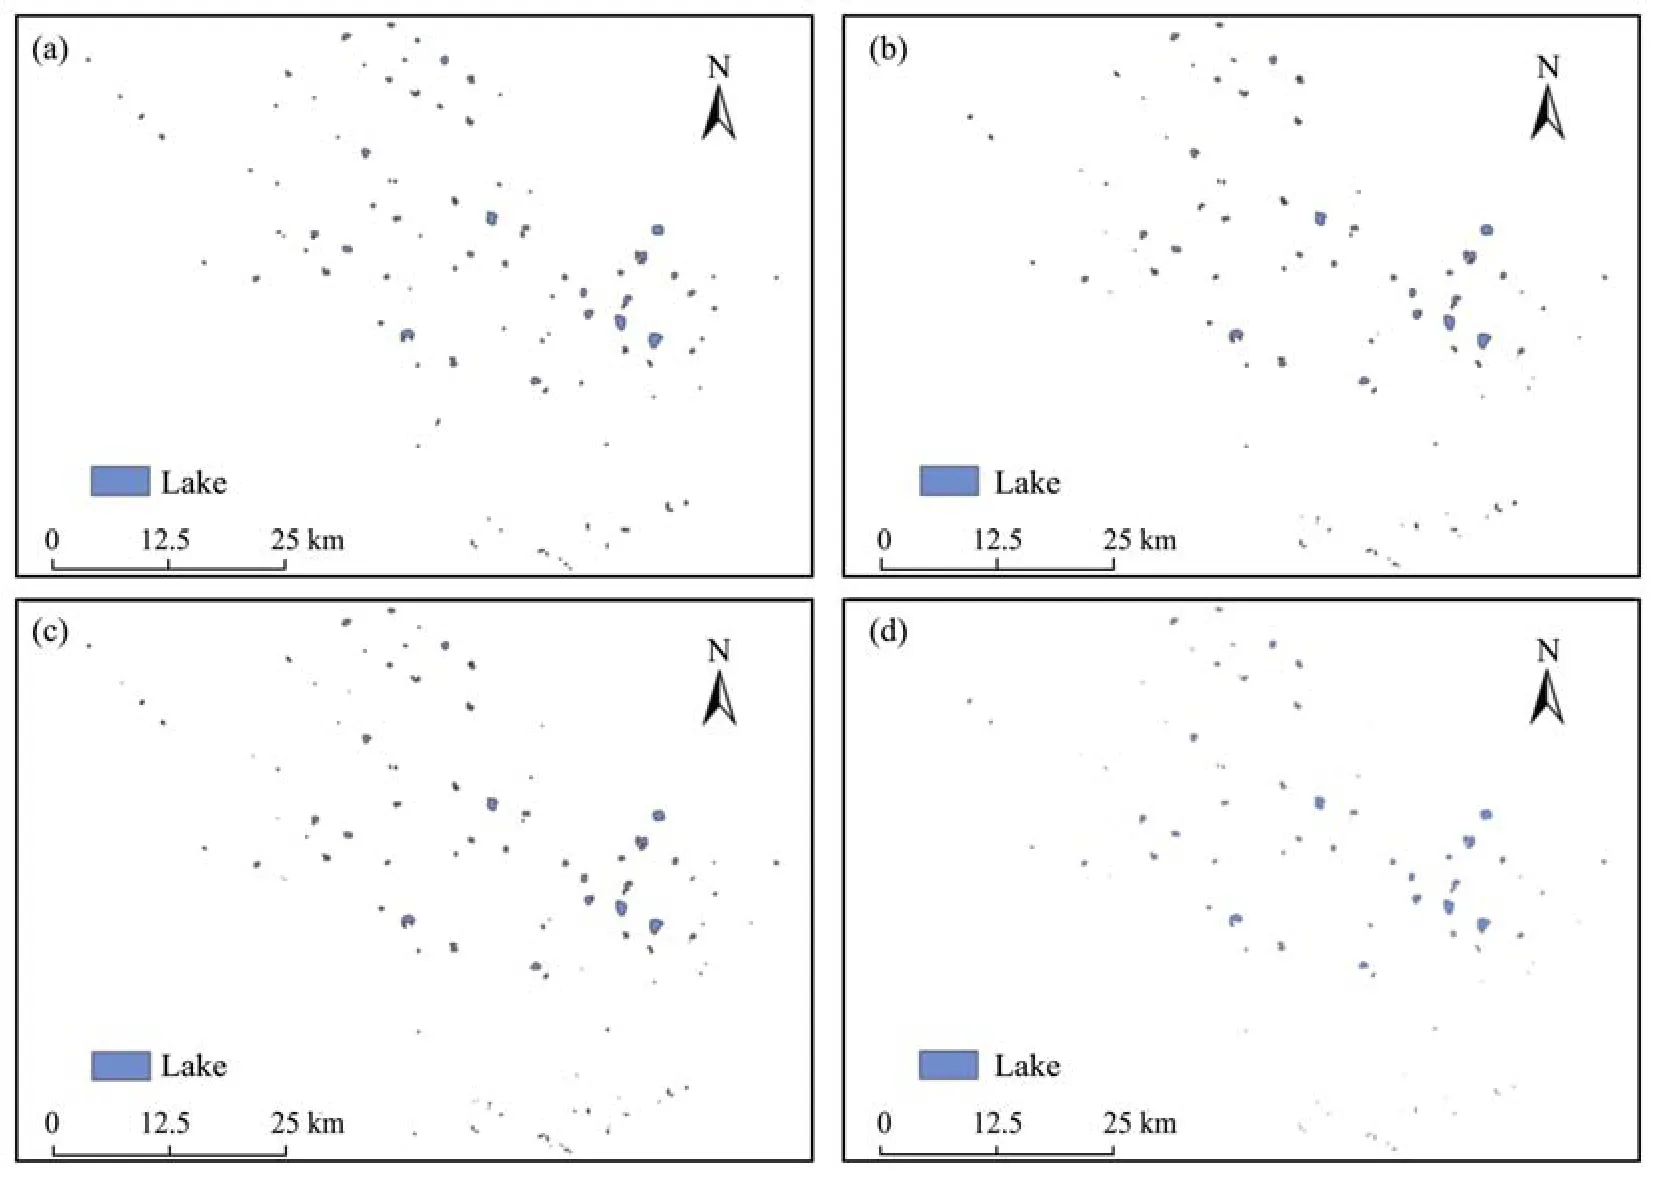
Figure 2 The distribution of lakes in the Badain Jaran Desert in 1973 (a), 1990 (b), 2000 (c), and 2010 (d)

Table 1 Statistical results of lakes interpreted from remote sensing images
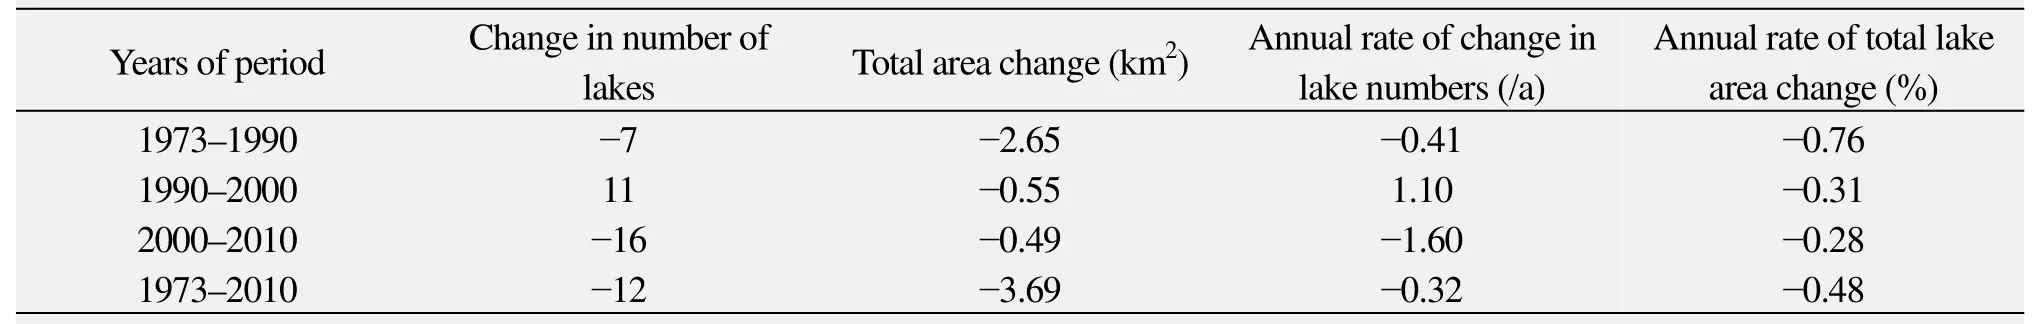
Table 2 Statistics for long-term lake changes and annual rates of lake changes
3.2 Characteristics of lake changes at different sizes
In our four lake databases, the largest lake area was more than 1.460 km2, while the smallest area was only 0.0036 km2. Counting the number of lakes in 0.1-km2increments, all the lakes were distributed in two area intervals: 0–0.6 km2and 0.9–1.5 km2; only six lakes were 0.9–1.5 km2, and the other lakes area were less than 0.6 km2, mostly between 0–0.1 km2and 0.2–0.3 km2. Overall,the larger the lake area was, the fewer the lakes in the interval (Figure 3).
According to the distribution characteristics represented by figure 3, we classified the lakes into three classes based on their area sizes: larger than 0.9 km2,between 0.2 and 0.9 km2, and less than 0.2 km2. We believed that this classification could avoid the effects of lake area changes on area intervals. Table 3 summarizes the statistics for lake information in the three size classifications.
There were six lakes larger than 0.9 km2: Nuoertu,Barunsumujilin, Cherigele, Yindeertu, Yihejigede, and Huhejilin. These lakes are large, deep, and have rich water resources, so they changed little during the study period. In the four time periods given above, the number of lakes in this classification was always six, the total lake areas ranged from 6.64 to 6.80 km2, and the total perimeters of the lakes remained similar: 28.92 km, 29.70 km,29.35 km, and 28.98 km, respectively. By visually assessing the lake spatial databases, we found that the lake areas of the six separate lakes fluctuated. For example,the area of Cherigele decreased and then increased, and the area of Yihejigede increased first and decreased afterwards. Thus, we can conclude the large lakes only fluctuated but did not shrink.

Figure 3 Numbers of lakes of different sizes
Lakes with areas between 0.2 and 0.9 km2showed a trend that first decreased and then tended to plateau in terms of their number, areas, and perimeters. During 1973–1990, the number of lakes declined by three and the total lake area declined by 1.027 km2. In the period 1990–2010, these lakes were relatively stable: the number of lakes remained at 25 and their total area was larger than 8 km2, and each lake changed little. During 1990-2010, the three lakes mentioned above did not disappear but shrank, and they were therefore transferred from the 0.2–0.9 km2class to the class less than 0.2 km2.
As shown in table 3, the lakes in the class of area less than 0.2 km2shrank significantly, and the rates were descending. In 1973–1990, these lakes shrank the most rapidly, their total area declined by 1.61 km2(nearly 36%), the number of lakes declined by four (there actually were seven, including the three lakes transferred from the class of 0.2–0.9 km2), and their perimeters reduced by 11.31 km. In the period of 1990–2000, although the number of lakes was increased by 11, the total area still decreased. This shows that the lakes in 1990 shrank hard and the total area of the new lakes was quite small.In 2000–2010, these lakes continued to shrink, their number declined by 16, the total area was reduced by 0.49 km2, and the total perimeter changed from 61.14 km in 2000 to 45.20 km in 2010, a reduction of 15.94 km.
We observed and contrasted the lake spatial databases from 2000 and 2010, and found that most of the disappeared lakes were of very small size or had been formed from lake division. This indicates: (1) not all of the lakes in the desert shrank during that time period; the lakes that shrank were mainly in the smaller area-size intervals; (2)there is some relationship between lake changes and their area size: the lakes that were larger than 0.9 km2only fluctuated, whereas those with areas between 0.2 and 0.9 km2decreased slowly and tended to be stable. Significant lake shrinkage mainly occurred in those lakes with areas less than 0.2 km2, and its rate descended; and (3) the changes in lakes with areas less than 0.2 km2were complicated: the total number of lakes declined but there were some new lakes added; table 3 is just a statistics for the whole lakes information.
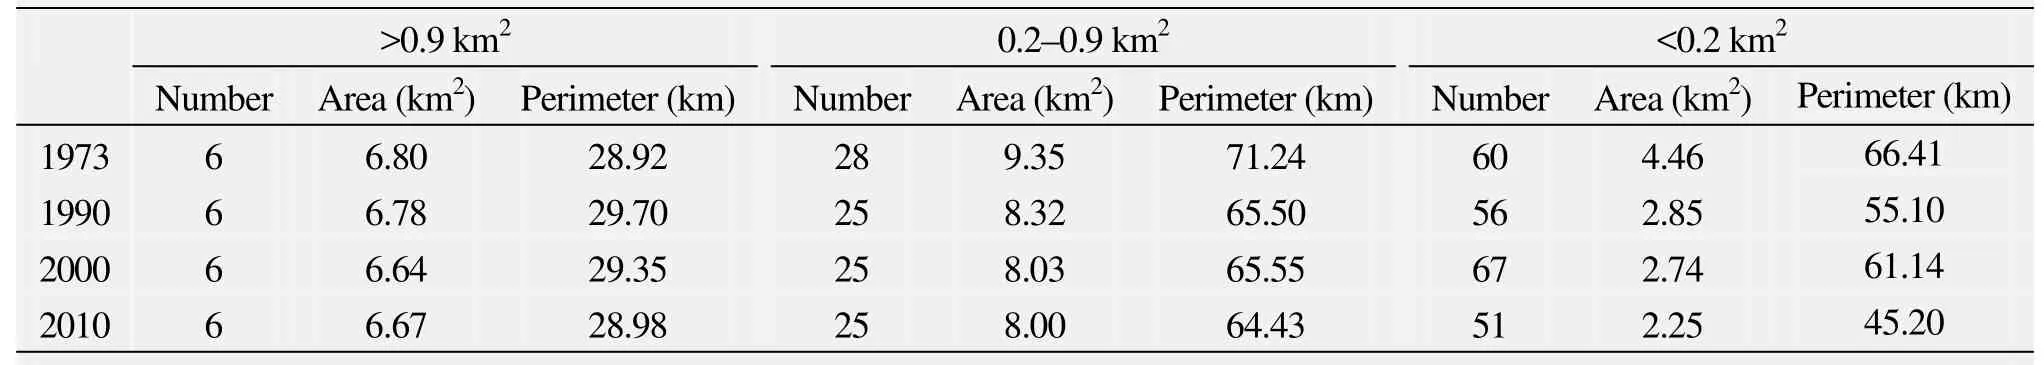
Table 3 Summary statistics for lake information in three classification sizes
4 Discussion
In general, lake changes should be a result of both natural factors and human activities. Anthropogenic factors having great influence on lakes include diversion,drainage, lake reclamation, lake pollution, and eutrophication. In desert lake wetlands, the ecosystem is very fragile and vulnerable to human activities. The Badain Jaran Desert is sparsely populated, having less than one family per 10 km2. The main activity of the locals is ani-mal husbandry without farming. One ancillary discovery in our study was that there are rarely long-term lake changes directly caused by human activities. In recent years, as the locals’ living standards have improved, more and more people choose to quit livestock grazing and move out of the desert, so they have little effect on desert lake changes. On the other hand, since 2000, tourism resources in the Badain Jaran Desert have been developing gradually. The local government is developing tourism while protecting the ecological environmental of the desert, to avoid irreversible harmful effects on desert lakes caused by tourism development. Therefore, it can be said that long-term changes of lakes in the Badain Jaran Desert are not influenced by anthropogenic factors.
Changes in lake levels are determined by the water balance in the water catchment. Within a given period of time, lake water level change is predicated by the water budget during that time. Without surface water runoff in this region, desert lake water changes only bear on the underground runoff, rainfall, and evaporation from the lake surfaces.
Figure 4 shows the precipitation change during last 40 years recorded by the Alxa Right Banner and the Yabra meteorological stations on the southern fringe of the desert. The mean annual precipitations in these two meteorological stations were, respectively, 117.6 mm and 89.7 mm per year—not significantly different. The annual precipitation had a slightly increasing trend (not significant at the 0.05 level), but the total lake area decreased in this period, so it can be inferred that the local precipitation was not the main factor affecting the lake area changes.
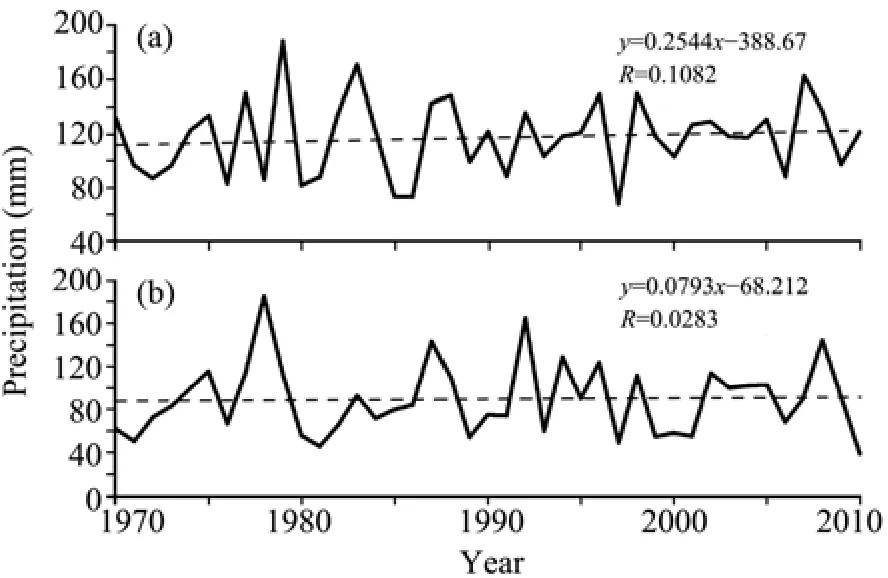
Figure 4 Variation of precipitation at Alxa Right Banner (a)and Yabra (b) in the southern Badain Jaran Desert during 1970–2010
Against the background of global warming, Petersonet al.(1995) found that, pan evaporation has tended to decline in the past 50 years. This was called the "evaporation paradox" by Michael and Graham (2002), and it has been confirmed by observations in many parts of the world (Cohen and Stanhill, 2002; Roderick and Farquhar,2004; Bandyopadhyayet al., 2009). In China, evapotranspiration studies have shown that, in northwestern China and including western Inner Mongolia, pan evaporation and potential evaporation show a significantly decreasing trend (Ren and Guo, 2006; Xie and Wang,2007; Liuet al., 2009). Although pan evaporation and potential evaporation are not equal to the actual evaporation of lakes, they should be on a coincident trend.
On the other hand, in September, 2010 our research group set up automatic meteorological stations and evaporation stations in the desert hinterland to continuously observe the water surface evaporation. We found that evaporation and wind speed are most closely related (results have not been published), and previous researches also confirmed that evaporation is closely related to wind speed in northwestern China (Zuoet al., 2005; Liuet al.,2009; Yiet al., 2010; Maet al., 2012). However, climate change research pertaining to the Badain Jaran Desert shows that the wind speed in this area has decreased significantly since 1970 (Ma Net al., 2011). Therefore, in accordance with the above, we believe lakes evaporation in the Badain Jaran Desert has been declining in the last 40 years.
Nevertheless, evaporation in the Badain Jaran Desert is still strong: calculated by the modified Penman Equation approach, annual evaporation is 1,040 mm (Yanget al., 2010); our field observations of annual lake evaporation were also over 1,000 mm. Although the volume of annual precipitation is much lower than the losses caused by evaporation, desert lake water can remain relatively stable, suggesting that one or more stable water supplies(such as deep groundwater, which has not yet been confirmed) should be recharging the lakes. Based on the principle of water balance, if evaporation decreases and precipitation does not increase obviously, decreases in lake area are likely to be due to the decrease of groundwater recharge; in such cases, the volume of the recharge reduction is greater than the volume of the lake evaporation reduction. This also indicates that desert lake changes are not influenced by local (the Badain Jaran Desert)climate change but, rather, by changes in the groundwater recharge.
The problem of water recharge is not clearly understood and is subject to much scholarly dispute. Further research is needed on the contribution of each factor to lake area changes.
5 Conclusions
Based on the water index method and the visual interpretation method, we analyzed four Landsat remote sensing image datasets from 1973, 1990, 2000, and 2010 to study the change of lake areas in the Badain Jaran Desert. We obtained the lake change characteristics and features and combined them with local climate change and human activities analysis to determine the main causes of the lake area changes. Our conclusions show:
(1) The number and total area of the lakes in the desert hinterland changed considerably during 1973–2010:the number of lakes first declined and then increased, and then decreased in the last 10 years. The total number of lakes reduced by 12, by an average of -0.32 per year. The total lake area has declined by 3.69 km2in the past 40 years; the annual area change rate was -0.48%, and the rate of reduction decreased gradually.
(2) Not all the desert lakes shrank during the study period: the lakes with areas greater than 0.9 km2only fluctuated, the lakes with areas between 0.2 and 0.9 km2decreased slowly and tended to be stable, and significant lake area decreases mainly occurred in lakes with areas less than 0.2 km2, in which the rate changed from fast to slow.
(3) Human factors and climate change are not the main factors of desert lake changes, but groundwater recharge is. Lake area decreases are likely due to the decrease of underground water recharge, but it is difficult to give a quantitative interpretation at this time.
Due to the spatial resolution limitations of remote sensors, some small lakes, especially those having a diameter less than 20 m, should be further investigated.Thus, our future work will address physical and chemical characteristics of desert lakes, such as salinity effects of evaporation, to analyze the spatial characteristics of lake area changes.
This work is supported by the National Natural Science Foundation of China (41371114, 41101187), the National Environmental Protection Public Welfare Industry Targeted Research Fund (201209034), and the Ministry of Education, Humanities and Social Science Projects(10YJCZH053).
Bandyopadhyay A, Bhadra A, Raghuwanshi NS,et al., 2009. Temporal trends in estimates of reference evapotranspiration over India. Journal of Hydrologic Engineering, 14(5): 508–518. DOI:10.1061/(ASCE)HE.1943-5584.0000006.
Chen JS, Li L, Wang JY,et al., 2004. Groundwater maintains dune landscape. Nature, 432: 459–460. DOI: 10.1038/432459a.
Chen JS, Zhao X, Sheng XF,et al., 2006. Formation mechanisms of megadunes and lakes in the Badain Jaran Desert, Inner Mongolia. Chinese Science Bulletin, 51: 3026–3034. DOI:10.1007/s11434-006-2196-8.
Chen L, Wang NA, Wang H,et al., 2012. Spatial patterns of chemical parameters of lakes and groundwater in Badain Jaran Desert.Journal of Desert Research, 32(2): 531–538.
Cohen S, Stanhill G, 2002. Evaporative climate changes at Bet-Dagan Israel, 1964–1998. Agricultural and Forest Meteorology, 111:83–91. DOI: 10.1016/S0168-1923(02)00016-3.
Ding F, 2009. A new method for fast information extraction of water bodies using remotely sensed data. Remote Sensing Technology and Application, 24(2): 167–171.
Ding HW, Wang GL, 2009. Study on the formation mechanism of the lakes in the Badain Juran Desert. Arid Zone Research, 24(1):1–7.
Ding YJ, Liu SY, Ye BS,et al., 2006. Climatic implications on variations of lakes in the cold and arid regions of China during the recent 50 years. Journal of Glaciology and Geocryology, 28(5):623–632.
Dong ZB, Qian GQ, Lü P,et al., 2013. Investigation of the sand sea with the tallest dunes on Earth: China’s Badain Jaran Sand Sea.Earth-Science Reviews, 120: 20–39. DOI: 10.1016/j.earscirev.2013.02.003.
Dong ZB, Wang T, Wang XM, 2004. Geomorphology of the mega-dunes in the Badain Jaran Desert. Geomorphology, 60(1–2):191–203. DOI: 10.1016/j.geomorph.2003.07.023.
Jensen JR, 1996. Introductory Digital Image Processing: A Remote Sensing Perspective. Prentice Hall, New Jersey.
Li JL, Sheng YW, Luo JC,et al., 2011. Remotely sensed mapping of inland lake area changes in the Tibetan Plateau. Journal of Lake Sciences, 23(3): 311–320.
Liu JG, 1989. A technique for computer-aided recognition and extraction of surface water area information using MSS images. Remote Sensing of Environment China, 4(1): 19–28.
Liu M, Shen YJ, Zeng Y,et al., 2009. Changing trend of pan evaporation and its cause over the past 50 years in China. Acta Geographica Sinica, 64(3): 259–269.
Liu X, He LH, Zhou C, 2008. Study on lake surface area change in the mid-lower reaches of the Yangtze River based on the remote sensing technique. Journal of East China Normal University(Natural Science), 4: 124–129.
Ma JZ, Li D, Li XH,et al., 2004. Chloride as a tracer and climatic change record from unsaturated zone of Badain Jaran Desert.Journal of Desert Research, 24(6): 674–679.
Ma JZ, Zhou XY, Wang YQ,et al., 2011. Spatial distribution of soil moisture at unsaturated zone in megadunes, southeast of Badain Jaran Desert. Journal of Desert Research, 31(6): 1365–1372.
Ma N, Wang NA, Wang PL,et al., 2012. Temporal and spatial variation characteristics and quantification of the affect factors for reference evapotranspiration in Heihe River basin. Journal of Natural Resources, 27(6): 975–989.
Ma N, Wang NA, Zhao LQ,et al., 2014. Observation of mega-dune evaporation after various rain events in the hinterland of Badain Jaran Desert, China. Chinese Science Bulletin. DOI: 10.1007/s11434-013-0050-3.
Ma N, Wang NA, Zhu JF,et al., 2011. Climate change around the Badain Jaran desert in recent 50 years. Journal of Desert Research,31(6): 1541–1547.
Ma RH, Yang GS, Duan HT,et al., 2011. China’s lakes at present:Number, area and spatial distribution. Science China (Earth Sciences), 54(2): 283–289. DOI: 10.1007/s11430-010-4052-6.
McFeeters SK, 1996. The use of normalized difference water index(NDWI) in the delineation of open water features. International Journal of Remote Sensing, 17(7): 1425–1432. DOI: 10.1080/01431169608948714.
Michael LR, Graham DF, 2002. The cause of decreased pan evaporation over the past 50 years. Science, 298(15): 1410–1411. DOI:10.1126/science.1075390-a.
Peterson TC, Golubev VS, Groisman PY, 1995. Evaporation losing its strength. Nature, 377: 687–688. DOI: 10.1038/377687b0.
Ren GY, Guo J, 2006. Change in pan evaporation and the influential factors over China: 1956–2000. Journal of Natural Resources,21(1): 31–44.
Roderick ML, Farquhar GD, 2004. Changes in Australian pan evaporation from 1970 to 2002. International Journal of Climatology,24(9): 1077–1090. DOI: 10.1002/joc.1061.
Wang HB, Ma MG, 2009. A review of monitoring change in lake water areas based on remote sensing. Remote Sensing Technology and Application, 24(5): 674–684.
Xie XQ, Wang L, 2007. Changes of potential evaporation in northern China over the past 50 years. Journal of Natural Resources, 22(5):683–691.
Xiong B, Chen XH, Song MQ,et al., 2009. Study on dynamic change of desert lakes in Badain Jaran Desert based on RS and GIS.Journal of Arid Land Resources and Environment, 23(8): 91–98.
Xu HQ, 2005. A study on information extraction of water body with the modified normalized difference water index (MNDWI). Journal of Remote Sensing, 9(5): 589–595.
Yan P, Zhang YJ, Zhang Y, 2007. A study on information extraction of water system in semi-arid regions with the enhanced water index(EWI) and GIS-based noise removal techniques. Remote Sensing Information, 6: 62–67.
Yang XP, 2006. Chemistry and late Quaternary evolution of ground and surface waters in the area of Yabulai Mountains, western Inner Mongolia, China. Catena, 66: 135–144. DOI:10.1016/j.catena.2005.07.014.
Yang XP, Liu TS, Xiao HL, 2003. Evolution of megadunes and lakes in the Badain Jaran Desert, Inner Mongolia, China during the last 31000 years. Quaternary International, 104: 99–112. DOI:10.1016/S1040-6182(02)00138-6.
Yang XP, Ma NN, Dong JF,et al., 2010. Recharge to the inter-dune lakes and Holocene climatic changes in the Badain Jaran Desert,western China. Quaternary Research, 73: 10–19. DOI: 10.1016/j.yqres.2009.10.009.
Yang XP, Martin AJW, 2003. The ion chemistry of lakes and late Holocene desiccation in the Badain Jaran Desert, Inner Mongolia, China.Catena, 51(1): 45–60. DOI: 10.1016/S0341-8162(02)00088-7.
Yi YH, Wu SH, Dai EF, 2010. Determining factors in potential evapotranspiration changes over China in the period 1971–2008. Chinese Science Bulletin, 55(29): 3329–3337. DOI: 10.1007/s11434-010-3289-y.
Zhu JF, Wang NA, Chen HB,et al., 2010. Study on the boundary and the area of Badain Jaran Desert based on remote sensing imagery.Progress in Geography, 29(9): 1087–1094.
Zhu JF, Wang NA, Li ZL,et al., 2011. RS-based monitoring seasonal changes of lake in Badain Jaran Desert. Journal of Lake Sciences,23(4): 657–664.
Zhu ZD, Wu Z, Liu S,et al., 1980. An Outline of Chinese Deserts.Science Press, Beijing.
Zuo HC, Li DL, Hu YQ,et al., 2005. Characteristics of climatic trends and correlation between pan-evaporation and environmental factors in the last 40 years over China. Chinese Science Bulletin, 50(12): 1235–1241. DOI: 10.1007/BF03183699.
 Sciences in Cold and Arid Regions2014年1期
- Sciences in Cold and Arid Regions的其它文章
- Assessment of sandy desertification trends in the Shule River Basin from 1978 to 2010
- A quantitative assessment on groundwater salinization in the Tarim River lower reaches, Northwest China
- Relationship between pollen assemblages and organic geochemical proxies and the response to climate change in the Zhuye Lake sediments
- Response to climate change of different tree species and NDVI variation since 1923 in the middle arid region of Ningxia, China
- State of the art and practice of pavement anti-icing and de-icing techniques
- New advances in the study of Alpine glaciations