Cu(Ⅱ),Ni(Ⅱ),Co(Ⅱ),Mn(Ⅱ),Zn(Ⅱ)和Cd(Ⅱ)的乙基3-(2-氨硫化亚肼基)-2-(羟胺基)丁烯酸酯配合物:合成、表征和细胞毒性
Ramadan M El BahnasawyAbdou S El-Tabl*,Mohamad M E Shakdofa Noran M Abd El-Wahed(埃及)
(1Chemistry Department,Faculty of Science,Menoufia University,Shebin El-Kom,Egypt)
(2Chemistry Department,Faculty of Science and Arts,Khulais,King Abdulaziz University)Saudi Arabia)
(3Inorganic Chemistry Department,National Research Center,P.O.12622 Dokki,Cairo,Egypt)
0 Introduction
Oximes[1-3]and thiosemicarbazones[4-6]are the two important classes of reagents considerable interest because of their chemistry and potentially biological activities.Thiosemicarbazones have a wide range of biological activities such as antitumor[7],antimalarial[8],antileukemic properties[9], antiviral activity[10],antibacterial[11]and antifertility property[12]because of theirreduction capability.The thiosemicarbazone moiety is planar and adopts an extended (E)conformation.This planar conformation is due to the extensive electron delocalization throughout the moiety.In general, the N, S-donor ligands of thiosemicarbazones are attributed to their ability to form metal chelates[13].Oxime metal complexes are biologically active and have been reported to possess semiconducting properties[14].Also,oximes reveal some interesting features including:
ⅰ-The ability of the oximato group to stabilize higher oxidation states of metals.
ⅱ-The development of bioinorganic models.
ⅲ-The design of selective receptors for Ca(Ⅱ) and Ba(Ⅱ) ions.
ⅳ-The development of new oxygen activation catalysis.
ⅴ-The mechanistic study of corrosion inhibition on iron surfaces.
All these stimulate our interestin metal complexes of oxime ligands.It should be of interest to design,synthesize and use a new type of reagent containing both functional groups viz oxime and thiosemicarbazone.Oxime-Thiosemicarbazone may be considered as functional groups (Two-in-one)viz Oxime and thiosemicarbazone.
1 Experimental
1.1 Instrumentation
All chemicals and solvents were reagent grade commercial materials and used as received.C,H,N,S and Cl analyses were performed at the Analytical Unit of Cairo University,Egypt.Standard methods were used for determining the metal (Ⅱ) ions[15].All complexes were dried in vacuo over P2O5.IR spectra(as KBr pellets)and as Nujol mull between CsBr prisms were recorded on a Perkin-Elmer581 spectrophotometer (4 000 ~200 cm-1).Electronic spectra (qualitative)in the 200~900 nm range were recorded on a Perkin-Elmer 550 spectrophotometer Magnetic susceptibilities were measured at 25℃by the Gouy method using mercuric tetrathiocyanato cobalt(Ⅱ) as the magnetic standard.The magnetic susceptibilities were calculated from the equation μeff=where χMCorris the corrected molar susceptibility.Diama gnetic corrections were made using pascal′s constant[16].Molar conductance were measured on a tacussel type CD6NG conductivity bridge using 10-3mol·L-1DMF.DTA analysis was carried out in air using a Schimadzu DT-30 thermal analyzer.1HNMR spectra (ligand and its Zn(Ⅱ)complex)were obtained with Bruker Avance 200 MHz spectrometer using Me4Si as internal standard.Mass spectra(ligand and its Zn(Ⅱ)complex)were recorded using JEULJMSAX-500 mass spectrometer provided with data system.The ESR spectra ofsolid complexes atroom temperature were recorded using a Varian E-109 spectrometer and DPPH (2,2-diphenyl-1-picrylhydrazyl)was used as the marker.The TLC of the ligand and its complexes confirmed their purity.
1.2 Preparation of the ligand The ligand,ethyl-3-(2-carbamothioylhydrazono)-
2-(hydroxyimino)butanoate was prepared by adding dropwise the suspension of thiosemicarbazide(3.14 g,0.034 mol)in hot 50 cm3ethanol to the solution of ethyl 2-(hydroxyimino)-3-oxobutanoate (5.0 g,0.034 mol)in 50 cm3ethanol(Scheme 1).The mixture was refluxed for 2 h with stirring,then left to cool at room temperature.The yellow precipitate was filtered off,washed with ethanol,dried and recrystallized from ethanol(Scheme 1).Elemental microanalyses.Calcd.for ligand (H2L)=C19H15N5O2(FW=232.26):C,36.20;H,5.21;N,24.12,S.13.81%.Found:C,35.78,H,5.20,N,23.80;S,13.51%.IR data:3 600,3 400,3 250,1 740,1 626,1 612,1 100,1 050,1 018,875 cm-1assigned to ν(OH,NH2,NH,C=O,C=N,N=C-O,N-OH,C=S).1H NMR (characterization(DMSO-d6,200 MHz):=12.90(s,1H,OH(15)),7.23(s,1H,NH(4)),2.86(s,2H,NH2(1)),3.11(m,2H,CH2(13)),3.11(s,3H,CH3(7)),1.87(T,3H,CH3(14)),Yield:75%,Color:yellow.The mass spectrum of the ligand(H2L)reveals molecular ion peak at m/z=232.
1.3 Preparation of metal complexes(2~4),(6),(7),(9-13),(15),(16-20)
A filtered ethanolic (50 cm3)of 0.01 mol metal salts Cu(CH3COO)2·H2O(1.99 g)complex(2),CuCl2(1.70 g)complex(3),Cu(NO3)2·3H2O(2.42 g)complex(4),NiCl2·4H2O(2.38 g)complex(6),Ni(CH3COO)2·4H2O (2.49.g)complex(7),Ni(NO3)2·6H2O (2.90 g)complex(9),Co(CH3COO)2·4H2O(2.49 g)complex(10),Co(NO3)2·6H2O (2.91 g)complex (11),CoCl2·6H2O(2.38 g)complex(12),MnCl2·4H2O (1.97 g)complex(13),Mn(CH3COO)2·4H2O (2.45 g)complex (15),Zn(CH3COO)2·2H2O(2.19 g),complex(16),Zn(NO3)2·6H2O(2.97 g)complex(17),ZnCl2(1.36 g)complex(18),Cd(CH3COO)2(3.19 g)complex(19),CdCl2(1.83 g)complex(20)were added to an ethanolic(50 cm3)of the ligand(1)(2.32 g,0.01 mol)in presence or absence of 3 mL triethyl amine.The mixtures were refluxed with stirring for 3 h.The colored complexes were filtered off,washed several times with ethanol and dried under vacuum over P2O5.The analytical and physical data are given in Table 1.
1.4 Preparation of metal complexes(5),(8),(14)
A filtered ethanolic(50 cm3)of 0.01 mol metal salts Cu(CH3COO)2·H2O(1.99 g)complex(5),Ni(CH3COO)2·4H2O(2.49.g)complex(8),Mn(CH3COO)2·4H2O(2.45 g)complex(14),were added to an ethanolic(50 cm3)of the ligand (1)(4.64 g,0.02 mol)in presence or absence of 3 mL triethyl amine.The mixtures were refluxed with stirring for 3 h.The colored complexes were filtered off,washed several times with ethanol and dried under vacuum over P2O5.The analytical and physical data are given in Table 1.
1.5 Biological studies
The cytotoxicity activity was measured in-vitro for the synthesized complexes according to Sulfo-Rhodamine-B-stain (SRB)assay using the published methods against HePG-2 and MCF-7 tumoral cell lines[17].Cells were plated in 96-multiwell plate(104cells/well)for24 h before treatmentwith the complexes to allow attachment of cell to the wall of the plate.Different concentrations of the complexes in DMSO (12.5,25 and 50 μg·mL-1)were added to the cellmonolayer triplicate.Monolayer cells were incubated with the complexes for 48 h at 37°C under atmosphere of 5%CO2.After 48 h,cells were fixed,washed and stained with Sulfo-Rhodamine-B-stain.Excess stain was washed with acetic acid and attached stain was recovered with Tris EDTA buffer(10 mmol·L-1Tris HCl+1 mmol·L-1Disodium EDTA,pH value of 7.5 ~8).Color intensity was measured by ELISA reader.The relation between surviving fraction and complex concentration is plotted to get the survival curve of each tumor cell line after the specified complex treatment.

Scheme 1 Synthesis of the ligand H2L(1)
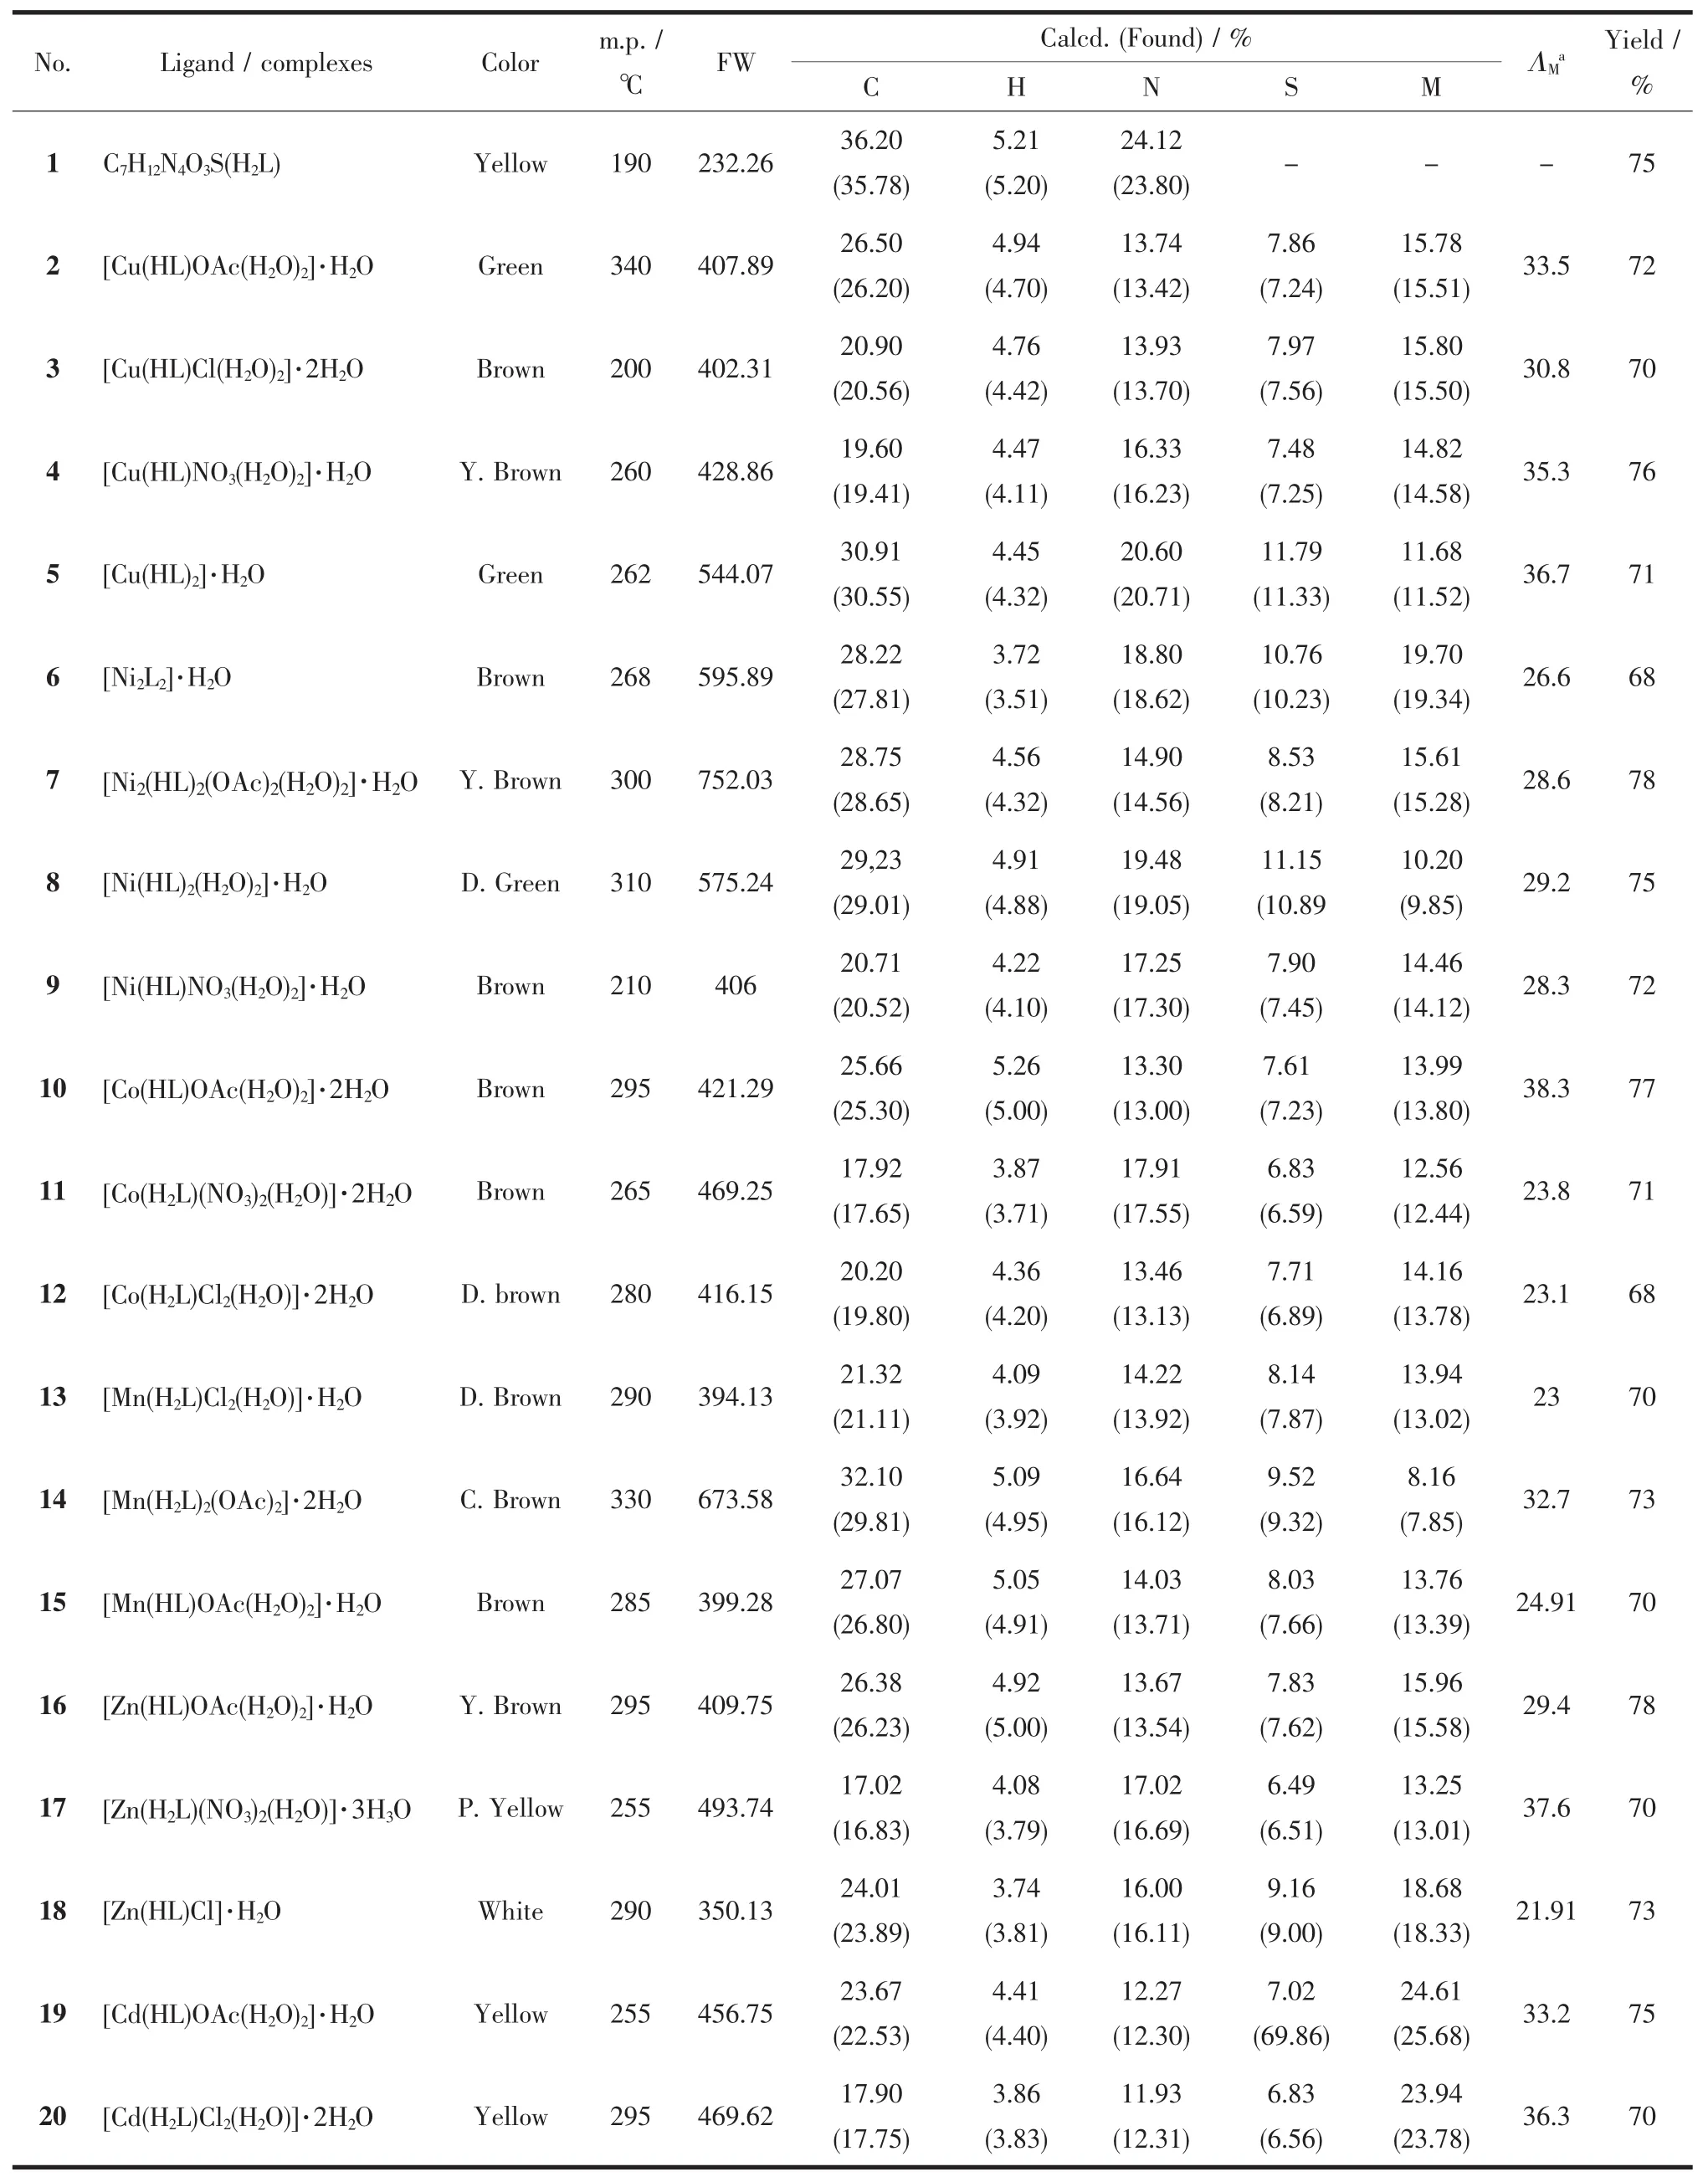
Table 1 Analytical and physical characteristics for the ligand(H2L)and its complexes
2 Results ad discussion
The analytical and physical data(Tables 1 and 5),and spectral data (Tables 2,3 and 4)are compatible with the proposed structures(Figures 1,2 and 3).The complexes are colored,stable in air,insoluble in waterand partially soluble in organic solvents as CHCl3but soluble in DMF and DMSO.Many attempts have been made to grow single crystal but unfortunately it was failed.
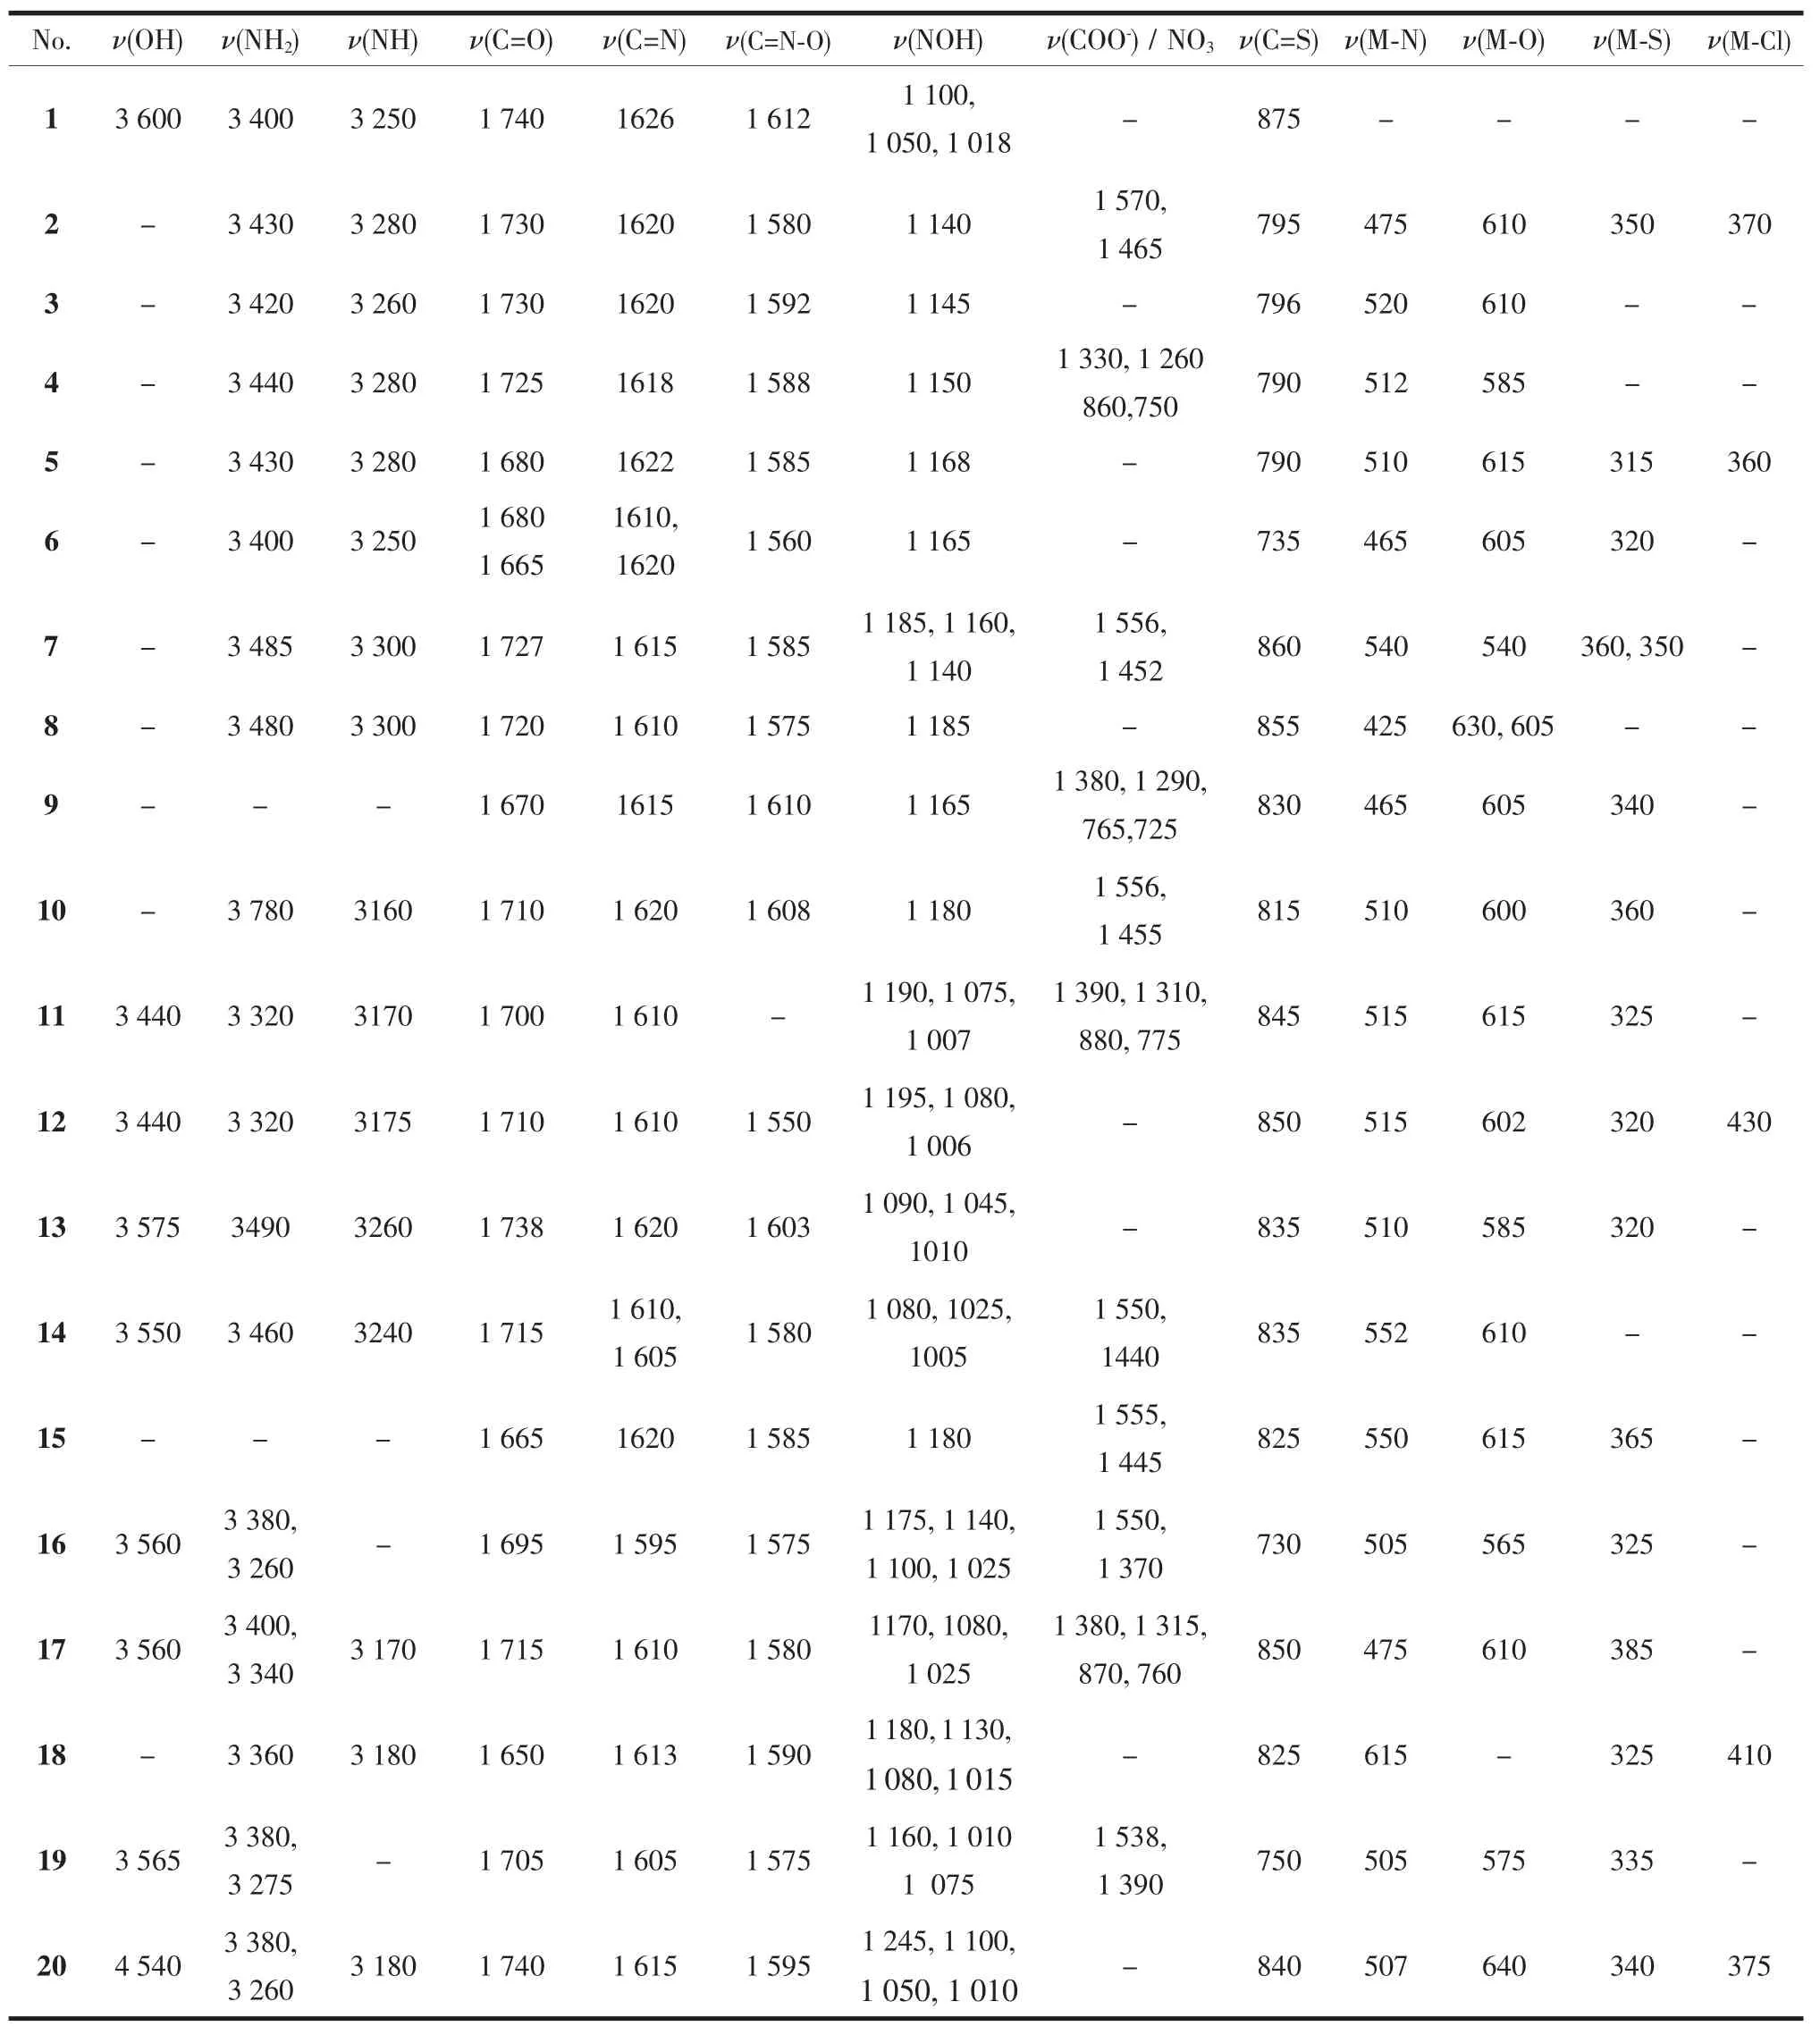
Table 2 IR spectral(cm-1)assignment for the ligand H2L and their metal complexes

Table 3 Electronic absorption spectra and magnetic moments for ligand and its complexes

Table 4 ESR parameter for copper(Ⅱ),cobalt(Ⅱ) and manganese(Ⅱ) complexes
2.1 Mass spectra of the ligand(1)and its Zn(Ⅱ)complex(17)
The mass spectrum of the ligand (H2L),(1)reveals the molecular ion peak at m/z=232 which is coincidentwith the formula weight232.26 and supports the identity of the structure. The fragmentation pattern splits a parent ion peak at m/z=166 corresponding to C3H6N3S while the fragments at m/z=45 and 104 corresponding to C2H5O and C3H6NO3,respectively.However Zn(Ⅱ)complex(17)shows m/z=493 coincident with the formula weight 493.74 a.m.u.The fragments appear at m/z of 73,116 and 128 are due to C3H5O,C3H6N3S and C4H6N3S,respectively.
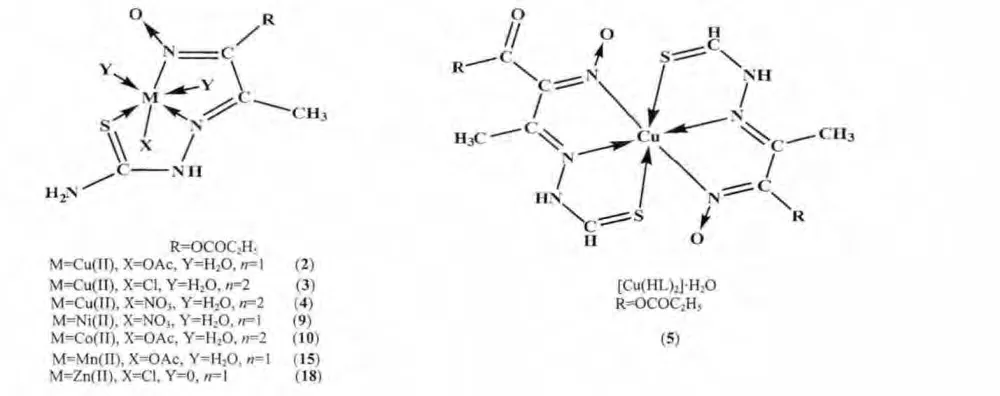
Fig.1 Suggested structure of the Cu(Ⅱ),Ni(Ⅱ),Co(Ⅱ),Mn(Ⅱ) and Zn(Ⅱ) complexes(2),(3),(4),(9),(10),(15)and(18)

Fig.2 Suggested structure of the Ni(Ⅱ),complexes(6),(7),and(8)

Fig.3 Suggested structure of the Co(Ⅱ),Mn(Ⅱ),Zn(Ⅱ) and Cd(Ⅱ) complexes(11),(12),(13),(14),(16),(17),(19)and(20)
2.2 Conductivity measurements
The molar conductance values of the complexes in DMF (10-3mol·L-1)lie in the 11.91~19.8 S·cm2·mol-1range (Table 1),indicating thatallthe complexes are not electrolytes[18].This confirms that the anion is coordinated to the metal ion.
2.3 IR spectra
The mode of bonding between the ligand and the metal ion can be revealed by comparing the IR spectra of the solid complexes with that of the ligand.The IR spectral data of the ligand and its metal complexes are presented in Table 2.In principle the ligand can exhibit thione-thiol tautomerism and it contains a thioamide-NH-C=S functional group.The ν(S-H)band at 2 565 cm-1is absent in the IR spectrum of the ligand but ν(N-H)band at 3 250 cm-1is present,indicating that the ligand remains as the thione tautomer (Scheme 1)in the solid state.The ligand shows two bands in the 3 650~3 300 and 3 280~2 800 cm-1ranges,commensurate the presence of two types of intra-and inter-molecular hydrogen bonds of OH,NH and NH2groups with imine,thione or carbonyl group[19],thus the higher frequency band is associated with a weaker hydrogen bond and the lower frequency band with a strong hydrogen bond.The medium band at 3 250 cm-1is assigned to ν(NH)group[18-19].The ν(NH)frequency of NH2group in the free ligand appears at 3 400 cm-1and not affected by complexation,indicating that,the terminal NH2group is not involved in the coordination to the metal ion[4].The band characteristic to carbonyl group ν(C=O)appears at 1 740 cm-1,identical to that of the noncoordinated carbonyl group in metal complexes of isonitrosoactylacetone and its derivatives[20-21]and more significantly to the related Schiffbase N,N-diisonitrosoacetylacetonemine 1,2-ethylenediamine and its metal complexes[21-22].However,the ν(C=N)imine and ν(C=N)oxime are at 1 626 and 1 612 cm-1.The oxime bands at 1 100,1 050 and 1 018 cm-1are assigned to ν(NO)[23-24]and ν(OH)of oxime group appears at 3 600 cm-1[23-24].Strong bands appear in the 3140 ~2890 cm-1range,are attributed to the ν(CH)vibrations.The band at 875 cm-1is attributed to ν(C=S)vibration[4,25].The mode of bonding between the ligand and the metalion can be revealed by comparing the IR spectra of the solid complexes with that of the ligand.By comparing the IR spectra of the complexes (2)~(20)with that of the free ligand,it is found thatthe position ofν(C=N)band of thiosemicarbazone is shifted 5~31 cm-1towards lower wavenumber (Table 2)in the complexes,indicating coordination through nitrogen of thiosemicarbazide moiety[4,25].This is also confirmed by the appearance of new bands in the 615~425 cm-1range,this has been assigned to the ν (M-N)[22].Strong bands found around 1 100 cm-1in the ligand and its metal complexes is due to ν(N-N)group of the thiosemicarbazone.The position of this band is slightly shifted towards higher wavenumber in the spectra of the complexes;it is due to the increase in the bond strength,which again confirms the coordination via the azomethane nitrogen.The band due to ν(C=S)appears in the 860~790 cm-1range in the complexes shifted to lower wavenumber,indicating that thione sulphur coordinates to the metal ion[22].Complexes(16)and(19)show bands at 750 and 730 cm-1which can be assigned to ν(C-S)[4,25].N-coordination of the oximato group is indicated by ν(C=N)oxime which appears in the 1 610~1 550 cm-1range,the shift of this band to lower wavenumber indicating coordination of nitrogen of oximino group to the metal ion[23-24].Whereas,the ν(C=O)appears in the 1 740 ~1 650 cm-1range.These assignments are consistentwith those reported forthe metal(Ⅱ)complexes of the dioximato ligands[24].Also,the complexes show ν(N-O)bands in the 1 245 ~1 100 and 1 090~1 005 cm-1ranges(Table 2),indicating N-coordination of the oximato group[20-21].Characteristic bands in the 640~540,615~425 and 385~320 cm-1ranges observed in the complexes may be tentatively assigned to ν(M-O), ν(M-N)and ν(M-S)vibrations,respectively[24].The strong broad bands in the 3 620~3 090 cm-1are due to hydrated or coordinated water molecules[18],however,broad bands in the 3 650~3 020 and 3 200~2 500 cm-1ranges,are corresponding to intra-and intermolecular hydrogen bonding[19,26].Complexes(2),(7),(10),(14),(15),(16)and(19)show bands in the 1 570~1 538 and 1 465~ 1 370 cm-1ranges,assigned to the symmetric and asymmetric stretches of the COO group with a ν value[ν(COO)asyν(COO)sy]more than 100 cm-1,which is consistent with the monodentate coordination of carboxylate oxygen[19,27].Complexes(4),(9),(11)and(17)show bands at 1 330,1 260,860 and 750,1 380,1 290,765 and 725,1 390,1 310,880 and 775 and 1 380,1 315,870 and 760 cm-1,respectively which are assigned to the monodentate mode of the nitrate group[24,26].However,complexes(3),(12),(13),(18)and(20)show bands at 370,360,430,375 and 410 cm-1are due to ν(M-Cl).
2.4 1H-NMR spectra of ligand(1)and its Zn(Ⅱ)complex(17)
The1H-NMR spectrum of the ligand (H2L)in DMSO-d6shows signals consistent with the proposed structure (Scheme 1).The peaks observed at 7.23(s,1H,NH(4)),2.86 (s,2H,NH2(1))are assigned to protons of NH and NH2groups[19-21].The signal appeared at 12.90 (s,1H,OH(15))is assigned to hydroxyl oxime proton[23].However the signals at 3.11(m,2H,CH2(13)),1.87(T,3H,CH3(14)),2.33(s,3H,CH3(7))are due to ethoxy and methyl groups respectively[18-19].Zn (Ⅱ) complex (20)shows oxime proton at 12.21 (s,1H,OH),which appears at lower valueindicatingcoordination ofnitrogen oximato group to Zn(Ⅱ) ion.The protons of NH and NH2groups appear at 7.11(s,1H,NH(4)),2.75(s,2H,NH2(1)),respectively.However the signals at 3.11(m,2H,CH2(13)),2.01(T,3H,CH3(14)),3.31(s,3H,CH3(7)),are due to ethoxy and methyl groups,respectively[18-19].
2.5 Magnetic moments
The magnetic moments of metal(Ⅱ)complexes are shown in Table 3.Copper(Ⅱ) complexes (2),(3),(4)and (5)show values in the 1.69 ~1.65 B.M.range corresponding to one unpaired electron in an octahedral geometry around the copper(Ⅱ) ion[19,28].These values are below the spin only value (1.73 B.M.),indicating that spin-exchange interactions take place between the copper(Ⅱ)ions through hydrogen bonding.Nickel(Ⅱ) complexes(7),(8),and (9)show values 3.11,2.98 and 3.18 B.M.,confirming T2g6lg2electronic configuration with two unpaired electrons in an octahedralnickel(Ⅱ) complexes[21,29],however,complex(6)shows a diamagnetic value in accordance with the square planar nickel(Ⅱ) complexes.Manganese(Ⅱ)complexes (13),(14)and (15)show values 5.6,5.32 and 5.82 B.M.indicating high spin octahedral geometry[18].Cobalt(Ⅱ) complexes(10),(11)and (12)show values 4.75,4.92,4.73 and 4.90 B.M.,respectively,indicating high spin octahedral structure[19,25,30].Zinc(Ⅱ) complexes (16)~(18)and cadmium(Ⅱ)complexes(19)and(20)show diamagnetic value.
2.6 Electronic spectra
The electronic spectra of the ligand (1)and its metal complexes are summarized in Table 3.The spectrum of the ligand in DMF solution exhibits three bands at 263 nm(ε=0.34×10⁻²L·mol-1·cm-1),298 nm(ε=0.38×10⁻²L·mol-1·cm-1)and 340 nm(ε=0.35×10⁻²L·mol-1·cm-1).The first one may be assigned to π→π* transition which is nearly unchanged on complexation,whereas the second and third bands are assigned to the n→π*and charge transfer transitions of the azomethine,iminoxime and carbonyl groups[31-33].These bands are shifted to lower energy on complex formation,indicating participation of these groups in coordination with the metal ions or hydrogen bonding formation.In addition,the spectra of the complexes show new bands in 405~395 nm range,which may be attributed to the charge transfer transition[21].The spectra of copper(Ⅱ)complexes(2),(3),(4)and(5)show bands in 265~260,295~290 and 320~310 nm ranges,these bands are within the ligand,however,the other bands observed in 645~625,590~570 and 495~465 nm ranges are assigned to2B→2B2g,2B2g→2Egand2B1B→2A1gtransitions respectively,indicating tetragonal distorted octahedral geometry[34-35].Nickel(Ⅱ)complexes(7),(8)and(9)show bands at 770,620 and 550,780,650 and 560,775,650 and 535 nm,respectively,corresponding to2A2g(F)→3T2g(F),(ν1),3A2g(F)→3T1g(F),(ν2),3A2g(F)→3T1g(P),(ν3),transitions,indicating octahedral nickel(Ⅱ) complexes[36-37].The ν2/ν1ratios are 1.24,1.20 and 1.19,respectively,which are less than the usual range of 1.5~1.75,indicating distorted octahedral nickel(Ⅱ)complexes[36-37],however,complex (6)shows bands at 260,360,405,450 and 520 nm,the first two bands are within the ligand and the other bands are due to1A1g→1Eg,1A1g→1A1gand1A1g→1A2gtransitions respectively,consistent with square planar geometry[20-21].Cobalt(Ⅱ) complexes(10),(11)and(12)show bands in 268~260,310~280,330,460~450,590~575 and 650~610 nm ranges,respectively,the first band is within the ligand and the other bands are assigned to4T1g(F)→4T2g(P),(ν3),4T1g(F)→4A2g(F),(ν2)and4T1g(F)→4T2g(F),(ν1)transitions respectively,corresponding to cobalt(Ⅱ) octahedral structure[31].The lower value of ν2/ν1at 1.28 1.22,1.17 and 1.28 indicates distorted octahedral Co(Ⅱ) complexes[18,30].Manganese(Ⅱ)complexes (13),(14)and (15)show bands in 265~262,290~285,310~320,450~400,580~560 and 635~615 nm,ranges,the first three bands are within the ligand and the other bands are corresponding to6A1g→4Eg,6A1g→4T2gand6A1g→4T1gtransitions which are compatible to an octahedral geometry around Mn (Ⅱ) ion[38].However,zinc(Ⅱ)complexes(16)~(18)and cadmium(Ⅱ),complexes(19)and(20)show bands in 270~260,330~270 and 400~395 nm ranges,indicating intraligand transitions within the ligand[39].
2.7 Electrons spin resonance(ESR)
The ESR spectral data (Table 4)at room temperature for solid copper(Ⅱ)complexes(2),(3),(4)and (5)show the axial type,characteristic of a monomer,d9,configuration with a dx2-y2ground state,which is the most common for copper(Ⅱ)complexes[40].The spectra of these complexes show g∥>g⊥>2.04,indicating a tetragonal distortion corresponding to elongation along the four fold symmetry axis z[36,41-42].The g-values are related by the expression
G=(g∥-2)/(g⊥-2)[43].If G >4.0,then the local tetragonal axes are aligned parallel or only slightly misaligned,ifG <4.0,the significantexchange coupling is present.The complexes show G value<4.0(Table 4)indicating spin exchange interactions through hydrogen bonding.Also,these complexes show g∥≤2.3,suggesting considerable covalent bond character around the copper(Ⅱ) ion[43-44].Also,the inplane-covalence parameter α2(Cu)was calculated by

The calculated values(Table 4)suggest covalent bond character[36,45-46].The g∥/A∥is taken as an indication for the stereochemistry of the copper(Ⅱ)complexes.Addison[47]has suggested that this ratio may be an empirical indication of the stereochemistry of copper(Ⅱ) complex.The value g∥/A∥quotient in the 105 ~135 cm-1range is expected for copper(Ⅱ)complexes within perfectly square based geometry and those higher than 150 cm-1for tetragonally distorted octahedralcomplexes.The valuesforcopper (Ⅱ)complexes(2),(3),(4)and(5)are within the range expected for tetragonally distorted complexes.For copper(Ⅱ)complexes with2B1ground state,the gvalues can be related to the parallel (K∥)and perpendicular (K⊥)componentsofthe orbital reduction factor(K)as follows[34-45].

where λois the spin orbit coupling of free copper ion, ΔExyand ΔExzare the electronic transition energies of2B1→2B2and2B1→2E,respectively.For the purpose ofcalculation,itis assumed thatthe maximum in the band corresponds to ΔExy,and ΔExzcan be taken from the wavelength of these bands.From the above relations,the orbital reduction factors(K∥,K⊥and K),a measure of covalency,can be calculated.For an ionic environment K=1,and for a covalent environment K<1;the lower the value of K(Table 4)shows considerable covalent bond character.The in-plane and out-of-plane π-bonding coefficients(β12and β2)are dependent upon the values of ΔExyand ΔExzin the following equations[44]:

In this work,the complexes show β12values(Table 4),indicating a moderate degree of covalent character in the in-plane π-bonding,while β2(Table 4),indicating ionic character in the out-of-plane πbonding except that complex (5)shows covalent character[48-49].It is possible to calculate the approximate orbital population for d orbital using the following equations[40].

where 2B°is the calculated dipolar coupling for unit occupancy of the d orbital.When the data of complexes are analyzed,the results suggest an orbital population close to 67.6% ~59%range of d-orbital spin density (T able 4)clearly,the orbit of the unpaired electron is a dx2-y2orbit[19].The ESR spectra for manganese(Ⅱ) complexes (13)~(15)and cobalt(Ⅱ)complexes (10)~(12)show isotropic type indicating octahedral geometry around Mn(Ⅱ) and Co(Ⅱ) ions,respectively[50].
2.8 Thermal analysis(DTA)
Since the IR spectra indicate the presence of water molecules,thermal analysis (Table 5)was carried out to ascertain their nature.The DTA curves in the temperature 27~800 ℃ range for complexes(2)~(20)show that the complexes are thermally stable up to 60℃.Also,the results show that,the complexes loose hydrated water molecules in the 60~90 ℃ range,this process is accompanied by an endothermic peak.The coordinated water molecules are eliminated at relatively highertemperature than those ofthe hydrated water molecules (135~265 ℃)(Table 5),which are accompanied by endothermic peaks[33,49,51-52].The removal of acetate ion as CH3COOH molecule accompanied by an endothermic peak is observed for complexes(2),(10)and(19)in the 300~352 ℃ range.Complexes(3),(12),(18)and(20)lose chloride ion as HCl with endothermic peak in the 265~325 ℃ range.However,complexes(4),(9),(11)and(17)lose nitrate group as HNO3with endothermic peak in the 260~350 ℃ range.The complexes show an endothermic peak within 200~340 ℃ range is due to melting of the complexes.The complexes show exothermic peaks within 350~670 ℃ range (Table 5)corresponding to oxidative thermaldecompositions,which proceeds slowly with a final residue,leaving metal oxides[52].The thermal decomposition of complex (2)can be represented as follows:

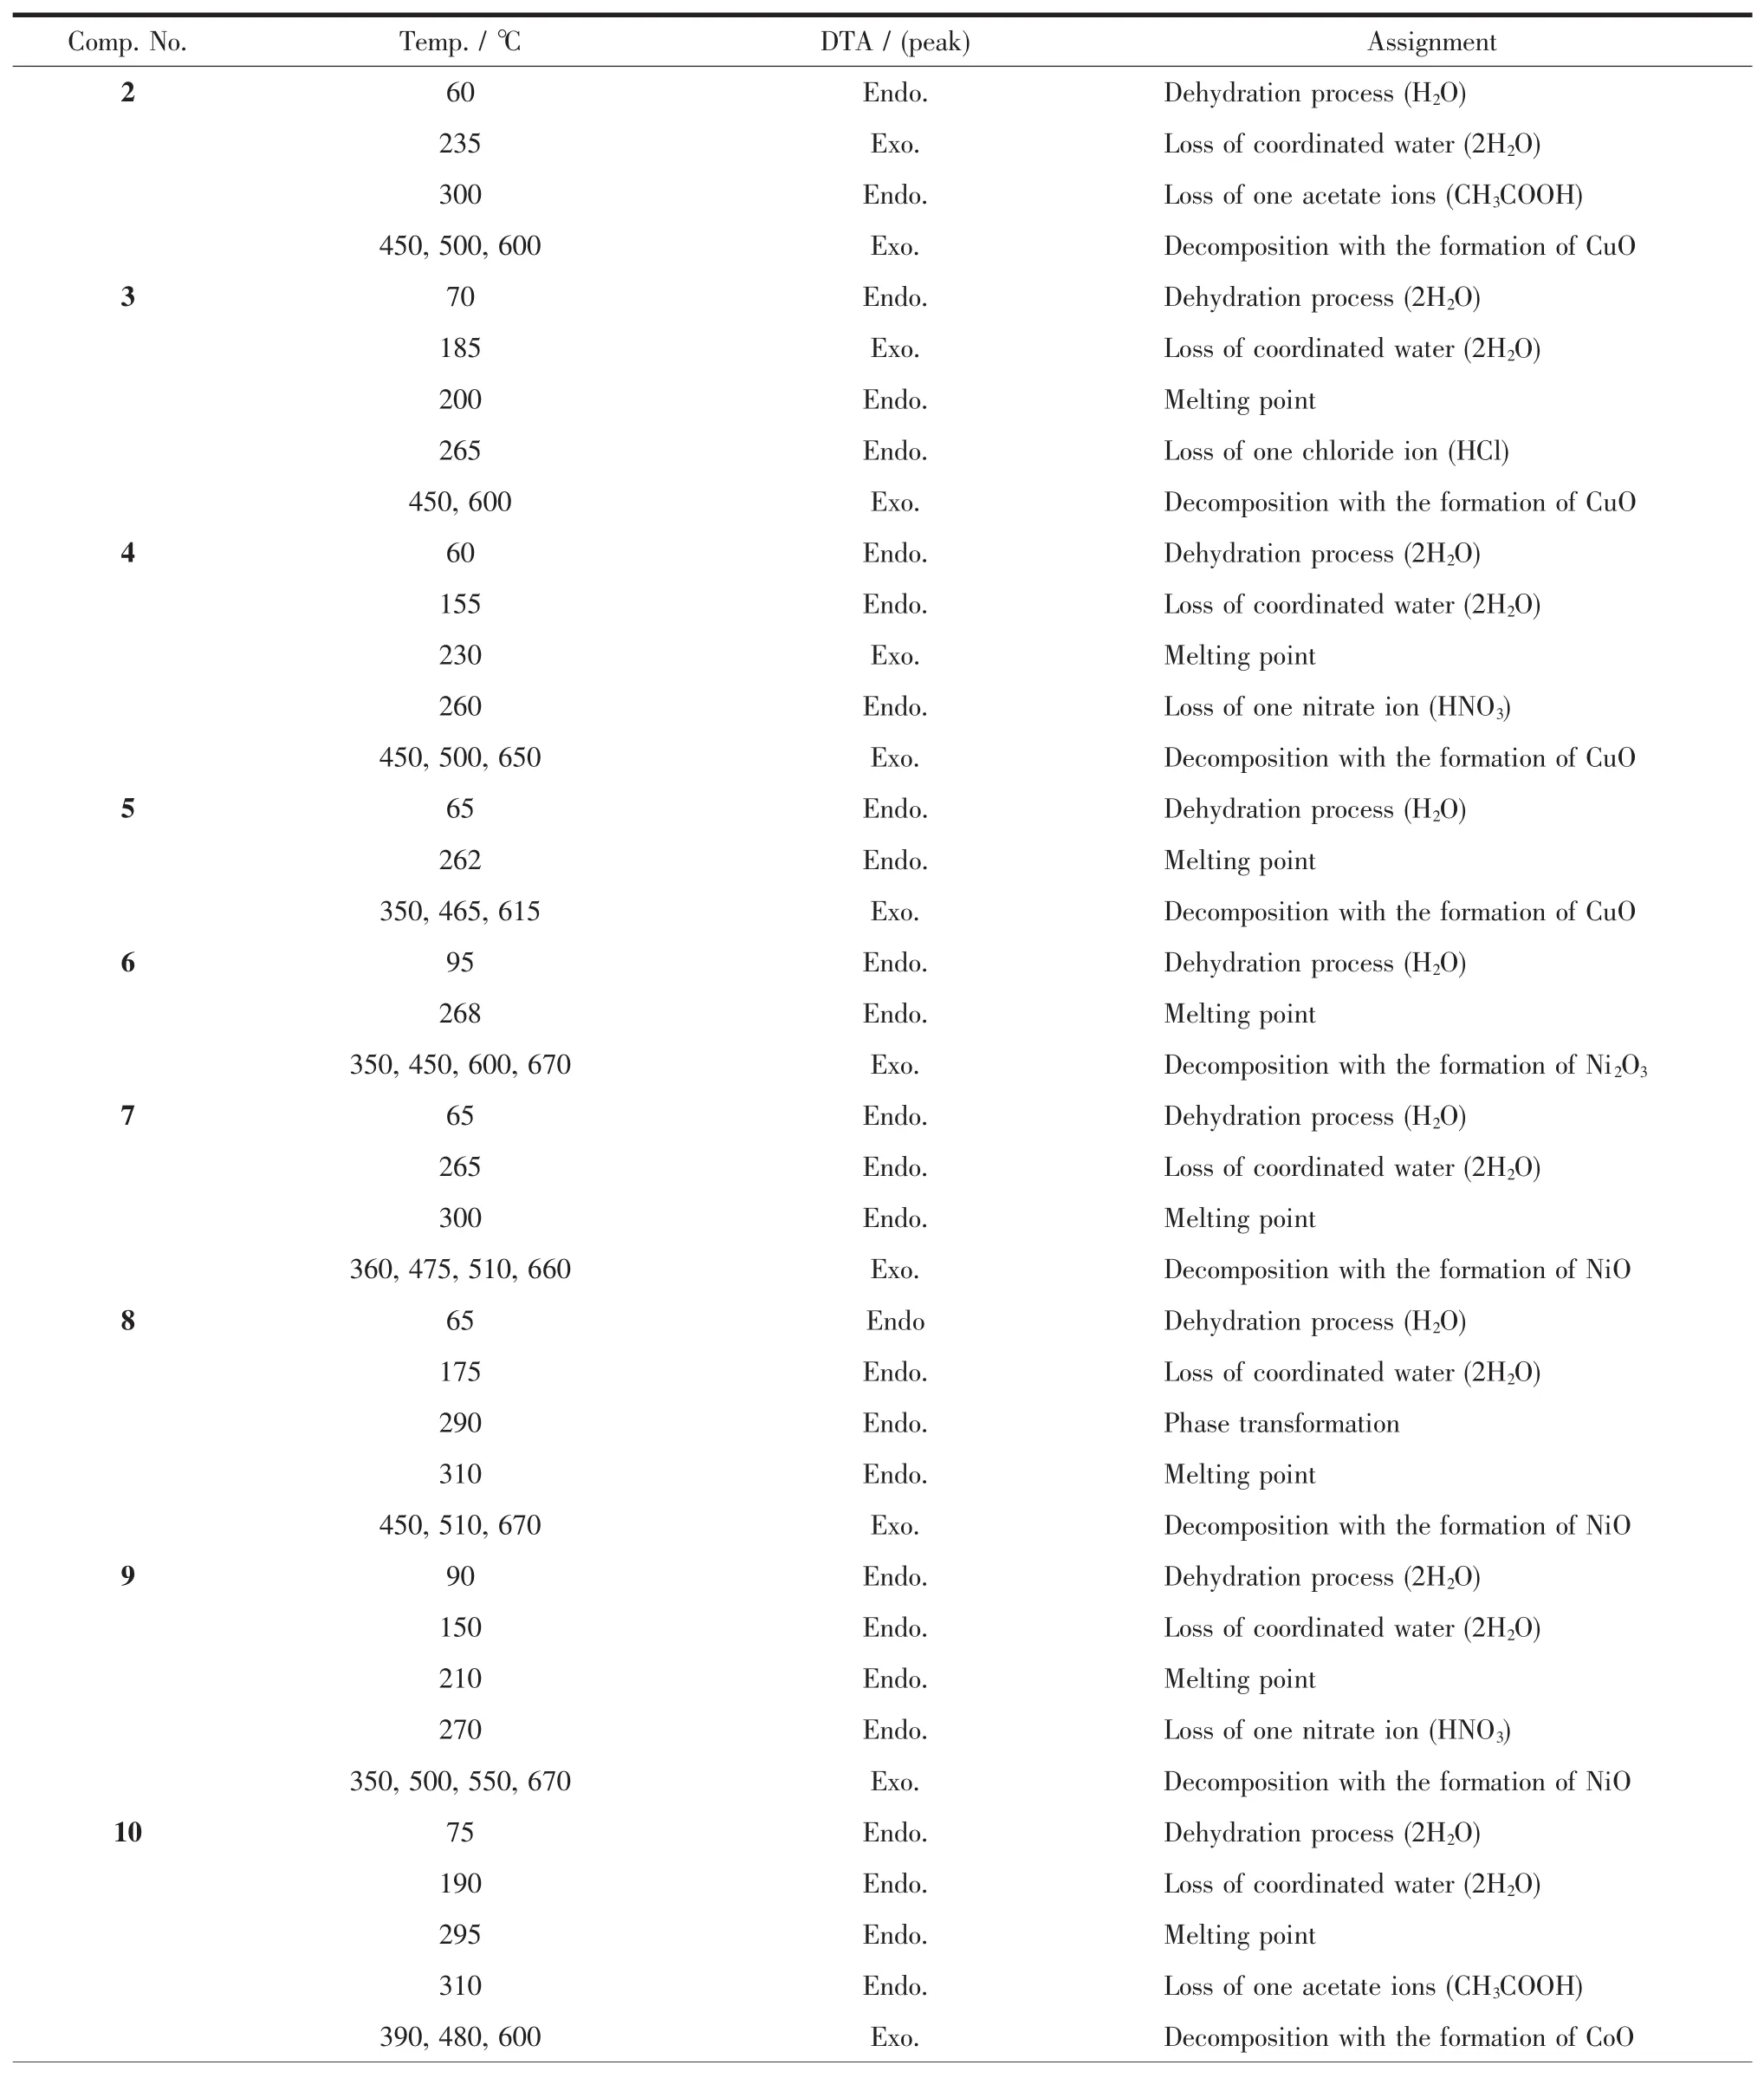
Table 5 Thermal analysis(DTA)of complexes
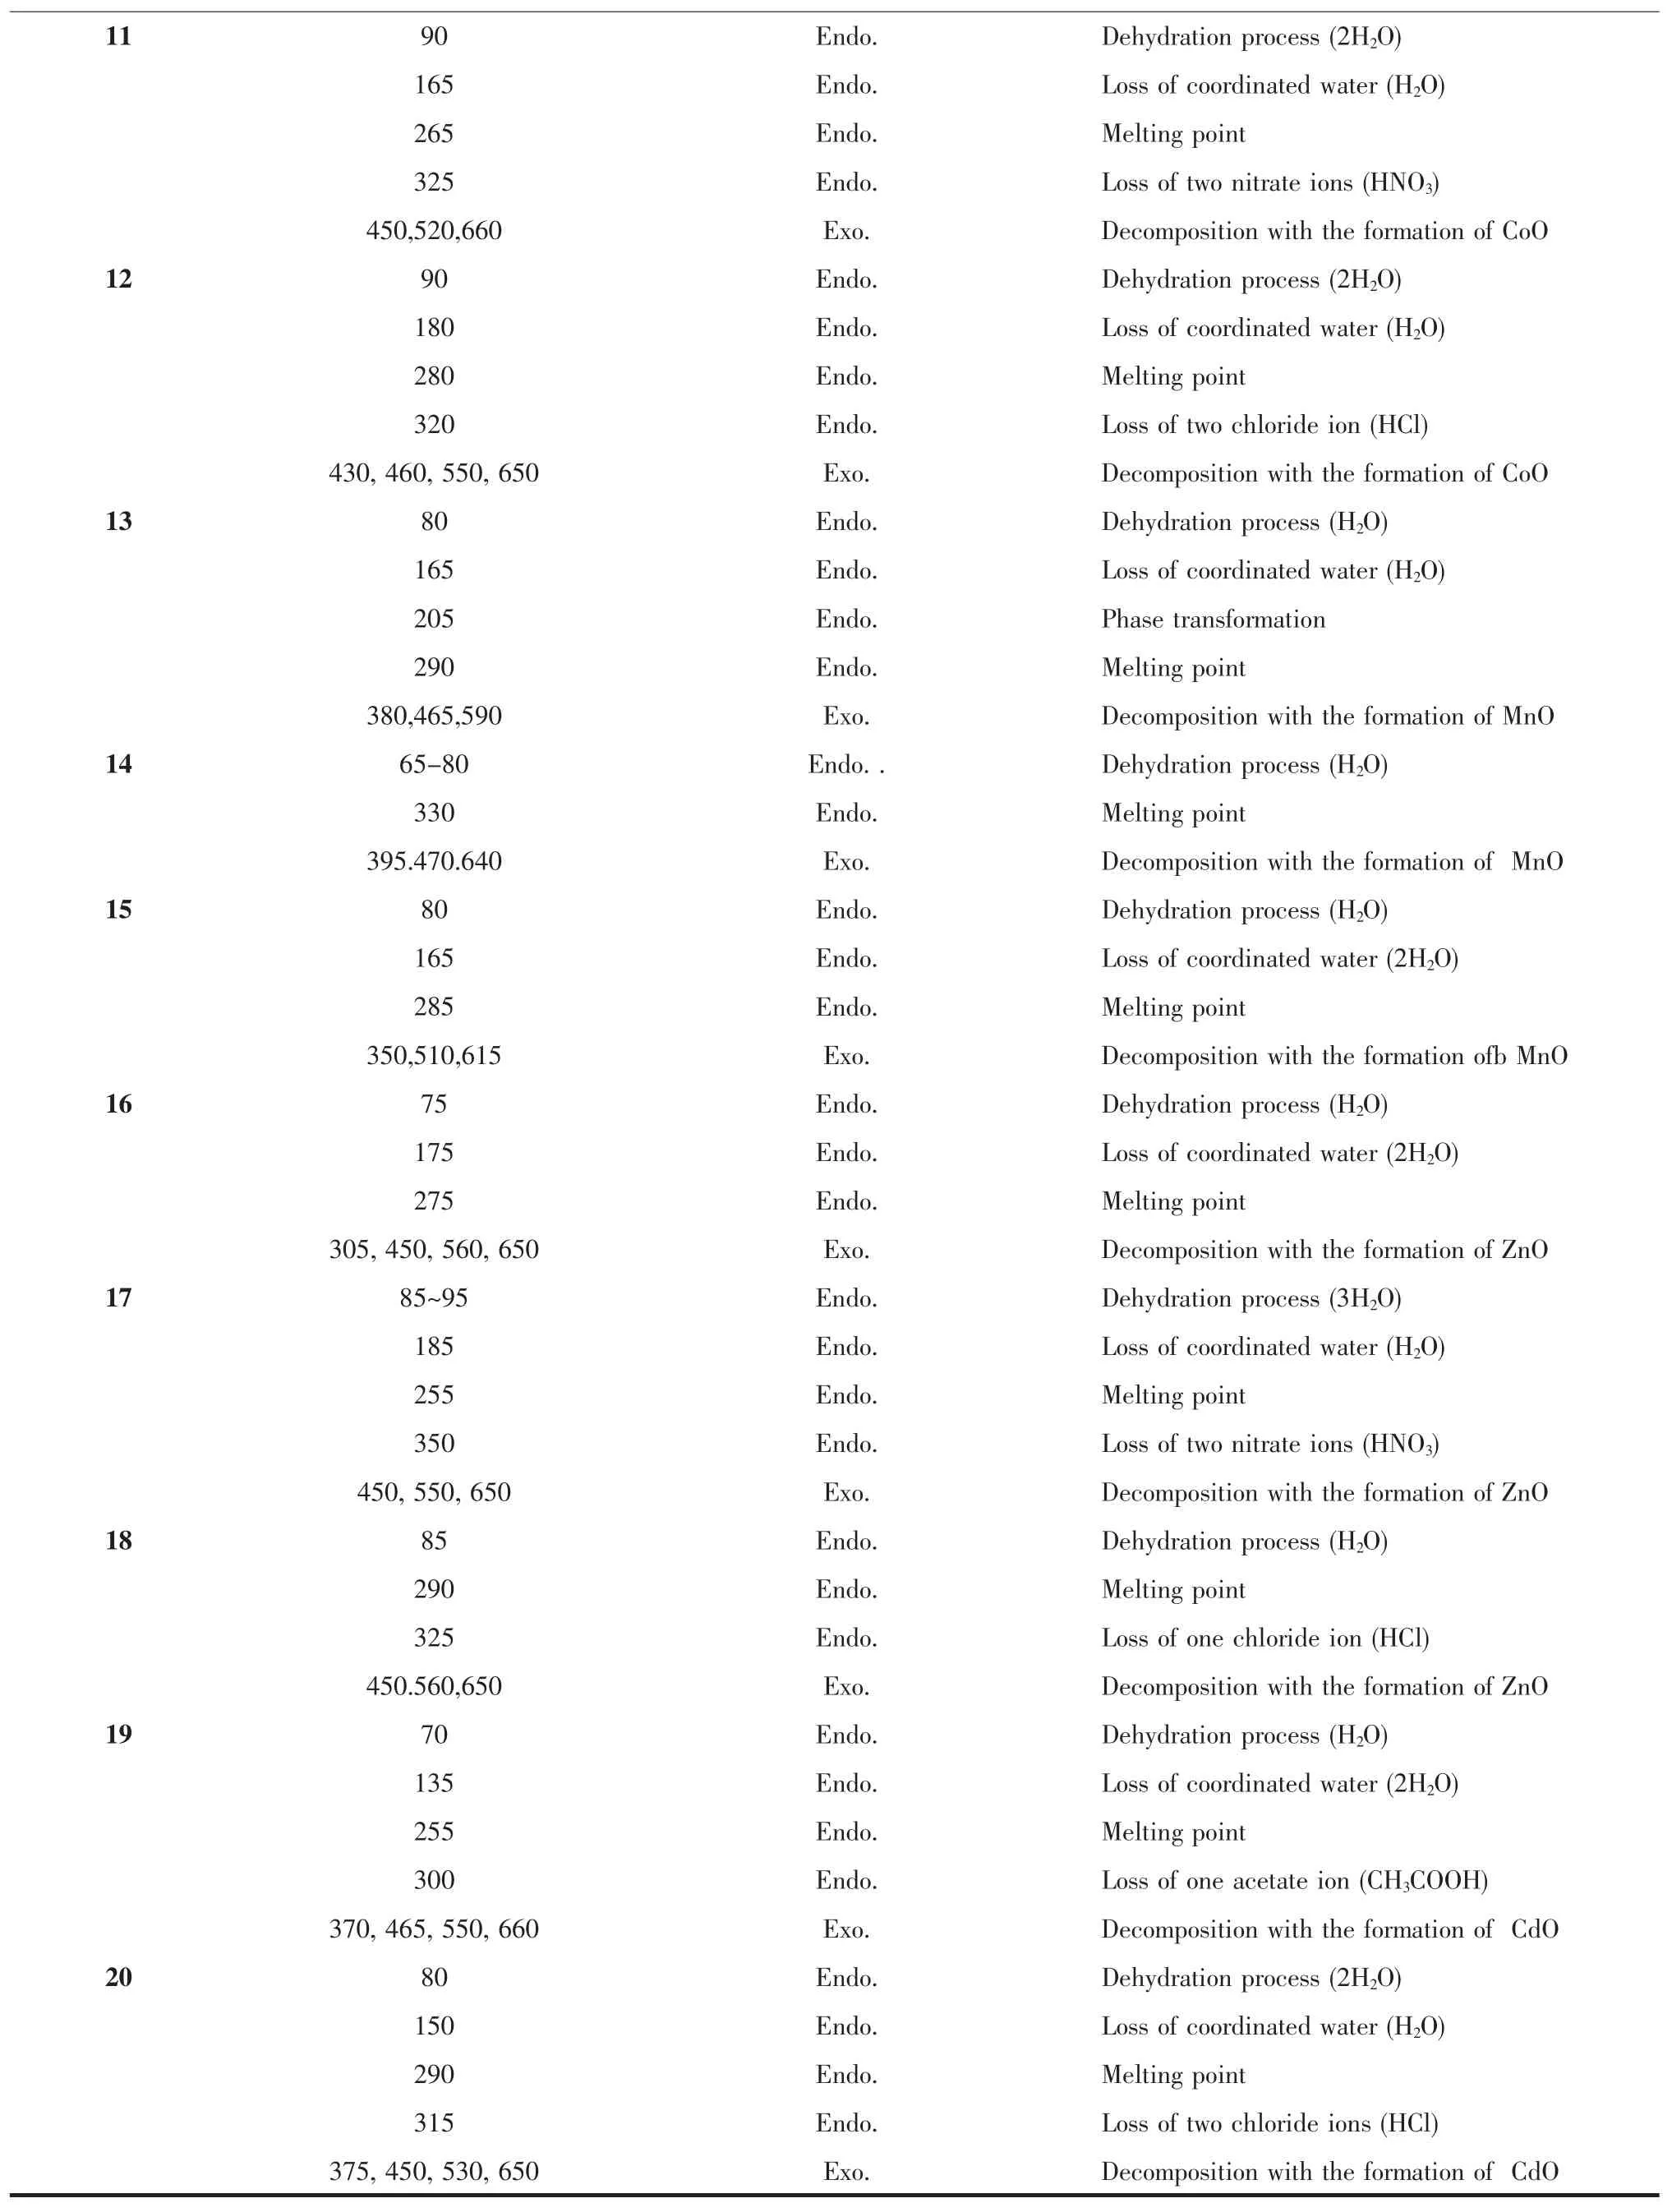
Continued Table 5
2.9 In-vitro cytotoxicity
The in-vitro cytotoxicity properties of the oxime thiosemicarbazone ligand (1)and its metal complexes(2),(3),(10),(13),(16)and (19)were evaluated against MCF-7 and HePG-2 tumoral cell lines.The ligand (1)shows a weak inhibition effect at ranges of concentration used,however,the complexes show moderate and almost similar behavior.This property may be due to the same coordination sites (N,O and S donor atoms)and the same geometry(octahedral)around the metal(Ⅱ) ion.The data indicate that the surviving fraction ratio against MCF-7 or HePG-tumor celllines increases with the increase ofthe concentration.Also,the complexesshow a high potency around 80%inhibition at 50 μg·mL-1against MCF-7,or HePG-2 compared with standard drugs(Tamoxifen and Sorafenib).It seems that the change in the anion and the nature of the metal ion has effect on the biological behavior in complexes,which could be explained by Tweedy′s chelation theory[53-58].To understand the mechanism involved in these processes.Copper(Ⅱ) complexes would cause intracellular generation of hydroxyl radical OH from H2O2produced during normal cellular activities by the reduction of Cu(Ⅱ) to Cu(Ⅰ) ion leading to growth inhibition on tumor cell[59].The decomposition of H2O2in the presence of Cu(Ⅱ)complex may be represented as follows[60].
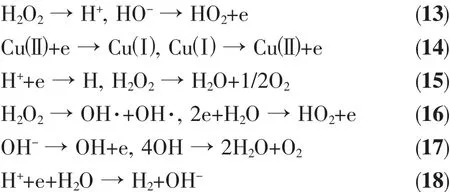
Moreover,Gaetke and Chow[61]reported that copper facilitated oxidated tissue injury through a free-radical mediated pathway analogous to the Fenton reaction.By applying the ESR-trapping technique,evidence for copper-mediated hydroxyl radical formation in-vivo has been obtained[61].Radicals are
produced through a Fenton-type reaction as follows:

where L=organic ligand

Scheme 2 Suggested mechanism for OH radicals attack on DNA sugars and bases
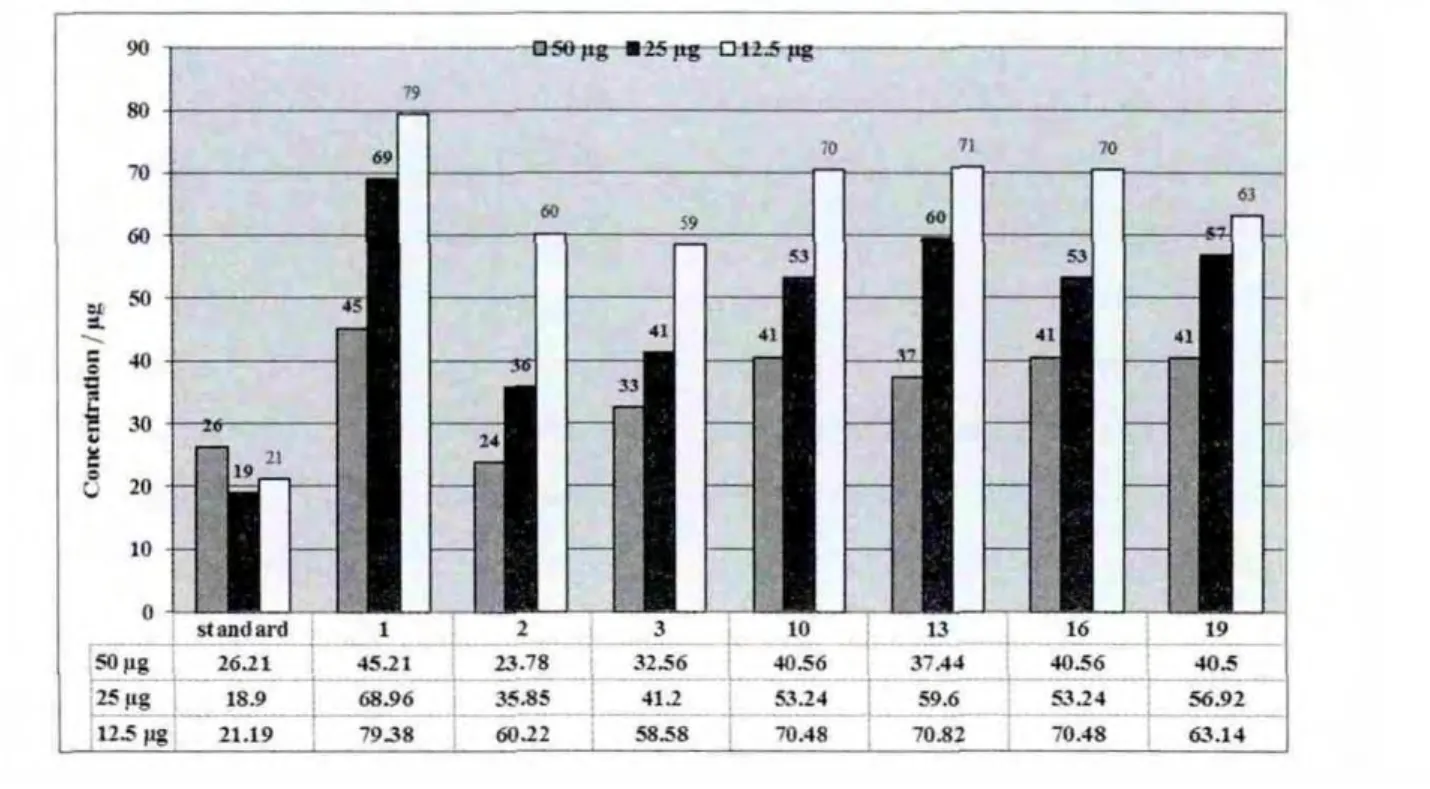
Fig.4 Cytotoxicity of standard,ligand(1)and complexes(2),(3),(10),(13),(16)and(19)against HEPG-2 liver cell
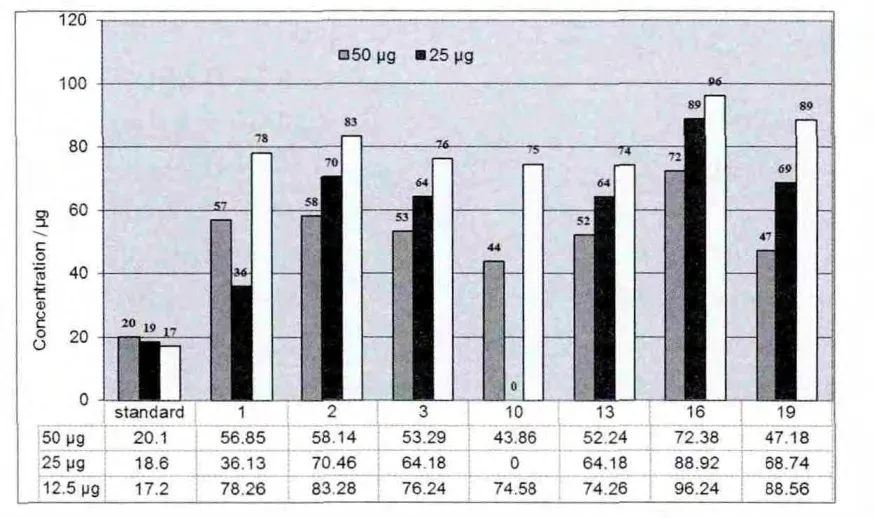
Fig.5 Cytotoxicity of standard,ligand(1)and complexes(2),(3),(10),(13),(16)and(19)against MCF-7 cell
Also,copper could act as a double-edged sword by inducing DNA damage and also by inhibiting their repair[62].The OH radicals react with DNA sugars and bases,and the most significant and well-characterized OH reactions are hydrogen atom abstraction from the C4on the deoxyribose unit to yield sugar radicals with subsequentβ-elimination (Scheme 2).By this mechanism,strand breakage occurs as well as the release of the free bases.Another form of attack on the DNA bases is by solvated electrons,probably via a similar reaction to those discussed below for the direct effects of radiation on DNA[62].
The cytotoxicity of a standard drug,ligand and its complexes at the range of concentrations used against human HePG-2 cell lines and MCF-7 breast cancer are shown in Figures(4)and(5).
3 Conclusions
New copper(Ⅱ),nickel(Ⅱ),cobalt(Ⅱ),manganese(Ⅱ),zinc(Ⅱ) and cadmium(Ⅱ) of ethyl-3-(2-carbamothioylhydrazono)-2-(hydroxyimino)butanoate have been designed, synthesized, and characterized using differentspectroscopic and analyticaltechniques.Comparison of the IR spectra of the ligand and their metal complexes indicate that the oxime acts as monobasic tridentate,monobasic bidentate,neutral bidentate,neutral tridentate,monobasic tetradentate or dibasic tetradentate bonded to the metal ions via azomethine nitrogen atom, nitrogen atom of thiosemicarbazide moiety,nitrogen atom of oxime moiety and thione sulphur atom forming octahedral or square planar geometry around the metal ions.The invitro cytotoxicity activities of the ligand and its complexes against the growth tumor cell lines MCF-7 and HePG-2 tumoral cell lines indicate that the ligand shows weak inhibition effect at ranges of concentration used,however,the complexes show moderate and almost similar behavior.This cytotoxicity activities may be due to the same coordination sites(N,O and S donor atoms)and the same geometry(octahedral)around the metal(Ⅱ)ion.
[1]Kurtolu M,Dadelen M M,Torlu S.Trans.Met.Chem.,2006,31(3):382-388
[2]Hsieh W Y,Liu S.Inorg.Chem.,2006,45:503-504
[3]Aly M M,El-Said F A.J.Inorg.Nucl.Chem.,1981,43(2):287-292
[4]El-Tabl A S,Ayad M I.Synth.React.Inorg.Met.Org.Chem.,2003,33:369-385
[5]Kasuga N C,Onodera K,Nakano S,et al.J.Inorg.Biochem.,2006,100(7):1176-1186
[6]Otero L,Folch C,Barriga G,et al.Spectrochem.Acta Part A,2008,70(3):519-523
[7]Offiong O E,Martelli S.Trans.Met.Chem.,1997,22(3):263-269
[8]Scovill J P,Klayman D L,Lambros C,et al.J.Med.Chem.,1984,27(11):87-91
[9]Scovill J P,Klayman D L,Franchino C F.J.Med.Chem.,1983,25(10):1261-1264
[10]Rasman J,Heinisch G,Holzer W,et al.J.Med.Chem.,1992,35(17):3288-3296
[11]Dobek A S,Klayma D L,Dickson E T,et al.Antimicrob.Agents Chemother.1980,18(1):27-36
[12]Shetti S N,Murty A S.Trans.Met.Chem.,1993,18(5):467-472
[13]Reddy K H,Reddy D V.Anal.Lett.,1984,17(11):1275-1291
[14]Özcan E,Karapinar E,Demirtas B.Trans.Met.Chem.,2002,27(5):557-561
[15]Vogel AI.A Text Book of Quantitative Inorganic Analyses.2nd Ed.,London:Longman,1951.
[16]Lewis J,Wilkins R G.Modern Coordination Chemistry.New York:Interscience,1960:403
[17]Skehan P,Storeng R.J.Natl.Cancer Inst.,1990,82:1107-1112
[18]Geary W J.Coord.Chem.Rev.,1971,7:81-122
[19]El-Tabl A S,El-Saied F A,Al-Hakim A N.Trans.Met.Chem.,2007,32(6):689-701
[20]Aly M M,Imam S M.Monatsh.Chem.,1995,126(2):137-147
[21]Aly M M,Baghlaf A O,Ganji N S.Polyhedron,1985,4(7):1301-1309
[22]Aly M M,Al-Sharri N I.Trans.Met.Chem.,1998,23(4):361-369
[23]Plass W,El-Tabl A S,Pohmann A.J.Coord.Chem.,2009,62(10):258-372
[24]El-Tabl A S.Trans.Met.Chem.,2002,27(2):166-170
[25]El-Tabl A S,Kashar T I,El-Bahnasawy R M,et al.Polish J.Chem.,1999,73(2):245-254
[26]Nakamoto K.Infrared Spectra of Inorganic and Coordination compounds.New York:Wiley,1970.
[27]Abu El-Reash G M,Ibrahim K M,Bekheit M M.Trans.Met.Chem.,1990,15(2):148-151
[28]Youssef N S,Hegab K H.Synth.React.Inorg.Met.Org.Nano-Met.Chem.,2005,35(5):391-399
[29]El-Tabl A S,El-Bahnasawy R M,Shakdofa M M E,et al.J.Chem.Res.,2010,49:88-91
[30]Al-Hakimi A N,Shakdofa M M E,El-Seidy A M,et al.J.Korean.Chem.Soc.,2011,55(3):418-429
[31]Dongli C,Handong J,Hongyun Z,et al.Polyhedron,1994,13(1):57-62
[32]El-Motaleb A,Gaber M.Trans.Met.Chem.,1997,22(3):211-215
[33]El-Tabl A S.J.Chem.Reas.,2002(11):529-531
[34]Bao S Q,Lin L Z,Li W X,et al.Trans.Met.Chem.,1994,19(5):503-505
[35]Sreeja P B,Kurup M R P,Kishore A C.Polyhedron,2004,23(4):575-581
[36]Bigatto A B,Costa G,Galasso V,et al.Spectrochim.Acta,1970,26(9):1939-1949
[37]Mohamed G G,Omar M M,Hindy A M M.Spectrochim.Acta,Part A,2005,62(4):1140-1150
[38]Parihari R K,Patel R K,Patel R N.J.Ind.Chem.Soc.,2000,77:339-341
[39]Krishna C H,Mahapatra C M,Dush K C.J.Inorg.Nucl.Chem.,1987,39:1253-1258
[40]El-Tabl A S.Trans.Met.Chem.,1997,22(4):400-405
[41]Lever A B P.Inorganic Electronic Spectroscopy.New York:Elsevier,1968:335
[42]Figgs B N,Lewis J.Prog.Inorg.Chem.,1967,6:37-39
[43]El-Tabl A S,Plass W,Buchnolz A,et al.J.Chem.Res.,2009:582-587
[44]E-Tabl A S.Trans.Met.Chem.,1996,21(1):1-4
[45]Procter I M,Hathaway B J,Nicholls P.J.Chem.Soc.A,1969:1678-1684
[46]Kivelson D,Neiman R.J.Chem.Phys.,1961,35(1):149-155
[47]El-Tabl A S,Shakdofa M M,El-Seidy A M A,et al.J.Korean Chem.Soc.,2010,55(1):19-27
[48]Addison A W.Copper Coordination Chemistry:Biochemical,Inorganic Perspectives.New York:Adenine Press,1983.
[49]Shauib N M,Elassar A Z,El-Dissovky A.Spectrochim.Acta,Part A,2006,63(3):714-722
[50]Kuska H A,Rogers M T.Coordination Chemistry.Martell A E,Ed.New York:Van Nostrand Reinhold,1971.
[51]Bhadbhade M M,Srinivas D.Inorg.Chem.,1993,32(24):5458-5466
[52]El-Tabl A S.Bull.Korean Chem.Soc.,2004,25(12):1757-1763
[53]El-Tabl A S,Abou-Sekkina M M.Polish J.Chem.,1999,73(12):1937-1953
[54]Illan N A,Garcia A R,Moreno M,et al.J.Inorg.Biochem.,2005,99(8):1637-1645
[55]Hall I H,Leem C C,Ibrahim G,et al.Appl.Oranomet.Chem.,1997,11(7):565-575
[56]Feng G,Mareque-Rivas J C,Rosales R T,et al.J.Am.Chem.Soc.,2005,127(39):13470-13471
[57]Mareque J C,Prabaharan R,Parsons S.Dalton Trans.,2004:1648-1655
[58]Bauer-Siebenlist B,Meyer F,Farakas E,et al.J.Chem.Eur.,2005,11(15):4349-4360
[59]Kadiiska M B,Mason R P.Spectrochim.Acta,Part A,2002,58(6):1227-1239
[60]El-Boraey H A,El-Tabl A S.Polish J.Chem.,2003,77(12):1759-1776
[61]Gaetke L M,Chow C K.Toxicology,2003,189(1/2):147-163
[62]Rouzer C A.Chem.Res.Toxicol.,2010,23(10):1517-1518

