A Model Study on Dynamical Processes of Phytoplankton in Laizhou Bay
YU Lanlan, YANG Bo,, JIANG Wensheng, and LI Keqiang
1) Physical Oceanography Laboratory, Ocean University of China, Qingdao 266100, P. R. China
2) College of Chemistry and Chemical Engineering, Ocean University of China, Qingdao 266100, P. R. China
A Model Study on Dynamical Processes of Phytoplankton in Laizhou Bay
YU Lanlan1), YANG Bo1),*, JIANG Wensheng1), and LI Keqiang2)
1) Physical Oceanography Laboratory, Ocean University of China, Qingdao 266100, P. R. China
2) College of Chemistry and Chemical Engineering, Ocean University of China, Qingdao 266100, P. R. China
A three-dimensional ecosystem model, using a PIC (Particle-In-Cell) method, is developed to reproduce the annual cycle and seasonal variation of nutrients and phytoplankton biomass in Laizhou Bay. Eight state variables,i.e., DIN (dissolved inorganic nitrogen), phosphate, DON (dissolved organic nitrogen), DOP (dissolved organic phosphorus), COD (chemical oxygen demand), chlorophyll-a(Chl-a), detritus and the zooplankton biomass, are included in the model. The model successfully reproduces the observed temporal and spatial variations of nutrients and Chl-abiomass distributions in the bay. The nutrient concentrations are at high level in winter and at low level in summer. Double-peak structure of the phytoplankton (PPT) biomass exists in Laizhou Bay, corresponding to a spring and an autumn bloom respectively. Several numerical experiments are carried out to examine the nutrient limitation, and the importance of the discharges of the Yellow River and Xiaoqinghe River. Both DIN limitation and phosphate limitation exist in some areas of the bay, with the former being more significant than the latter. The Yellow River and Xiaoqinghe River are the main pollution sources of nutrients in Laizhou Bay. During the flood season, the algal growth is inhibited in the bay with the Yellow River discharges being excluded in the experiment, while in spring, the algal growth is enhanced with the Xiaoqinghe River excluded.
phytoplankton biomass; 3D ecosystem model; nutrients; Laizhou Bay
1 Introduction
The Bohai Sea is a semi-enclosed shallow marginal sea and the largest inner sea in China. Laizhou Bay is located in the southern Bohai Sea (Fig.1) and has water depths of 10–15 m and a maximum depth of 18 m. A large amount of freshwater flows into the bay from the Yellow River and many other rivers and creeks. Inflows include daily sewage from the coast as well. Laizhou Bay is also the main spawning ground and habitat of the Bohai and Yellow Seas (Deng and Jin, 2000; Gaoet al., 2003). Therefore the ecology of the Bay is influenced by rivers, marine cultures, and other human activities.
The latest economical development results in serious nutrients pollution in the Bay. The high concentration of nitrate, chlorophyll-a(Chl-a) and primary production in Laizhou Bay could destroy the local fisheries if no measures are taken to control the pollution.
The numerical model can help understand the dynamics and capacity of marine ecosystem. While there are some models having been developed for the Bohai Sea few ecosystem models are specifically established for Laizhou Bay. The ecosystem dynamic modules in those Bohai Sea models are mostly based on the N-P-Z-D (Nutrients-Phytoplankton-Zooplankton-Detritus) method, and most calculations of the PPT biomass and primary production focus on the time periods of 1980s and 1990s (Gaoet al., 1998; Gao and Wang, 2004; Weiet al., 2004; Liu and Yin, 2007). These model results show the similar annual cycle with a double-peak feature. Some poorly known ecosystem parameters for the Bohai Sea have been specified based on assimilation method, which improves the model results significantly (Zhaoet al., 2005). Liet al.(2009) simulated the Laizhou Bay ecosystem dynamics in August 2002, with some parameters obtained from in situ mesocosm experiments. But their model didn’t describe the seasonal variations and spatial distributions of nutrients and PPT because it was only integrated for 5 d.
2 Model Description
In this study, two models, the HAMburg Shelf Ocean Model (HAMSOM) (Backhaus, 1985) and a newly developed ecosystem model, are used to simulate the hydrodynamic and phytoplankton dynamic processes, respectively.
2.1 The Hydrodynamic Model
Since its publication, HAMSOM has been shown to bean appropriate numerical model for shelf sea and estuarine dynamics study, and it also has been successfully used in the Bohai Sea (Huanget al., 1999; Jianget al., 2004; Maoet al., 2008).
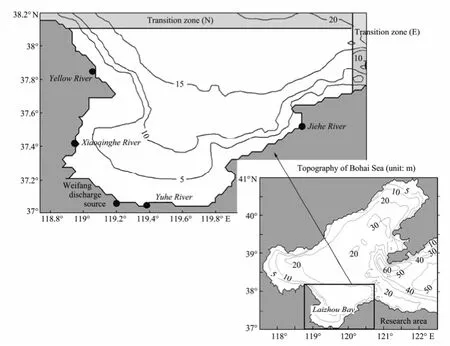
Fig.1 The main nutrients pollution sources of Laizhou Bay and bathymetry of the Bohai Sea (unit: m). Depth contours in the Bohai Sea are for 5, 10, 20, 30, 40, 50, 60 meters, and these in Laizhou Bay are for 5, 10, 15, 20 meters. The shaded areas in the Laizhou Bay map are the transition zones along the northern and eastern open boundaries, respectively.
Here the HAMSOM domain covers the entire Bohai Sea, including Laizhou Bay, with 1-minute grid resolution. It is az-level model with 10 layers in vertical, and the depths of each layer are 3, 6, 9, 12, 15, 18, 23, 28, 38 and 65 m, respectively. The model was run for 2 years from 2003 to 2004, with a time step of 6 min. The calculated surface elevation, velocity, temperature, and salinity are output at a half hour interval. The tidal harmonic constituents of M2, S2, N2, K1and O1are specified along the eastern open boundary of the model at 122˚30΄E based on NAO99 dataset (http://www.miz.nao.ac.jp/staffs/nao99/ index_En.html). The Orlanski radiation condition is used for velocity, while restoring conditions are adopted for temperature and salinity. The bottom stress is parameterized using the quadratic drag law.
The meteorological forcing of the model is derived from NCEP (National Centers for Environmental Prediction) FNL (Final) dataset (http://dss.ucar.edu/datasets/ds083.2/), which has a horizontal resolution of 1˚ and an output interval of six hours, and adopts 10-m wind speed, sea surface air pressure, relative humidity, 2-m air temperature, and total cloud cover. Compared with the traditional NCEP, the FNL dataset is produced about an hour after the model system is started, which allows more observational data be incorporated in the FNL. Freshwater inflows from four major rivers into the Bohai Sea are specified in the simulation, including the Yellow River, the Haihe River, the Luanhe River and the Liaohe River. Only the calculated hydrodynamic results in Laizhou Bay are extracted as the input to the ecosystem model.
2.2 A Three-Dimensional Ecosystem Model
A three-dimensional ecosystem model, covering areas between 37˚05΄N and 38˚10΄N, and between 118˚44΄E and 120˚48΄E, was developed for the Laizhou Bay. It is az-level model with 7 levels in vertical, with the depth of each level being 3, 6, 9, 12, 15, 18, and 23 m, respectively.
Using a PIC (Particle-In-Cell) method in this ecosystem model, individual particles (or fluid elements) in a Lagrangian frame are tracked based on the background flow and turbulence, whereas currents and state variables are computed simultaneously on the Eulerian (stationary) field. For the model simulation, a Lagrangian coordinate system is superimposed upon an Eulerian one (Evans and Harlow, 1957). The traditional Eulerian method tends to introduce false diffusion, especially in the regions with strong current gradient. The PIC method can reduce the false diffusion because the material transport is estimated based on the state variables of Lagrangian particles mov-ing into/out of a cell.
For each individual particle used in the PIC method, there are eight variables,i.e., DIN (dissolved inorganic nitrogen), phosphate, DON (dissolved organic nitrogen), DOP (dissolved organic phosphorus), COD (chemical oxygen demand), Chl-a, detritus, and the zooplankton biomass. Particles are released uniformly from locations with a horizontal resolution of 1/3 min and a vertical resolution of 1 m at the beginning of simulations, and are driven by current- and wave-induced advection and diffusion.
The model includes an N-P-Z-D ecosystem module and the following processes as shown in Fig.2.
1) The dissolved inorganic nutrients (DIN and phosphate) are taken up by phytoplankton (PPT) and released by part of soluble excretion of zooplankton (ZPT). The river runoff and remineralization of dissolved organic nutrients are also sources of inorganic nutrients.
2) The dissolved organic nutrients are released by respiration of PPT, biodegradation of detritus, and the other part of soluble excretion of ZPT.
3) The sources of detritus include the natural death of PPT and ZPT, and the inassimilation of PPT grazed by ZPT and by fish.
4) The nutrient flux at the sea bottom is not well understood. This process is not considered here, but can be added in the further research.
Table 1 shows the model parameters according to literatures and numerical experiments. Among all the parameters obtained from literatures, the sensitive ones are obtained from the in situ mesocosm experiments (m_ experiments) performed in Laizhou Bay in August 2002, while the others derived from the assimilation method (Wang and Li, 2006; Liet al., 2009).
Solar radiation is an important parameter, and it is calculated based on the length of a day, season, and latitude. Underwater radiation, which is used for the photosynthesis of PPT, is a function of water transparency. Due to the wind-induced strong mixing, low transparency is specified in the model during winter season.

Fig.2. Schematic diagram of the ecosystem model.

Table 1 Model parameters chosen for Laizhou Bay
In the ecosystem model, there are two open boundaries: the northern and eastern boundaries located along 38˚10΄N and 120˚48΄E, respectively. The seasonal variability of the eight variables is obtained from marine atlas (Editorial Board for Marine Atlas, 1991) along the open boundaries. The initial values for the eight variables in Laizhou Bay are set according to literatures (Tang and Meng, 1997; Fenget al., 2007; Liu and Pan, 2008).
Transition zones with a width of 5 min (Fig.1) are applied for the eight variables along the two open boundaries. In the transition zones the particles with properties of eight state variables are released with the initial arrangement and flow into the model domain during the flood tide. .
Five major rivers or discharge source are considered in Laizhou Bay (Fig.1): the Yellow River, the Xiaoqinghe River, the Weifang contaminants discharge source, the Yuhe River, and the Jiehe River. It is assumed that all the nutrients discharged into Laizhou Bay are from these five sources. The annual dissolved inorganic nutrient input from literatures are listed in Table 2. The Yellow River has the largest nutrient discharge, accounting for 85.16% of DIN and half of DIP of all the five sources. Since the only seasonal observation gauge is at the Yellow River, the nutrient discharge data derived from the Water Resources Bulletin of the Yellow River (2001–2009) are used to calculate the seasonal variations for the other sources.
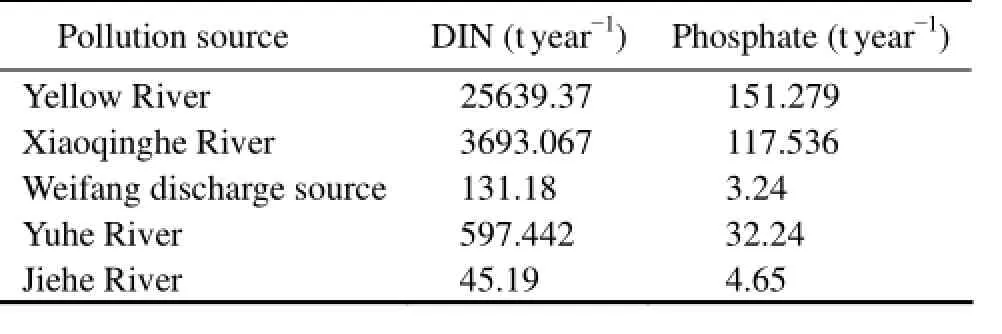
Table 2 The annual nutrient input of the five sources
The ecosystem model was run periodically for 3 years, based on the 2004 hydrodynamic model results calculated by HAMSOM, with a time step of 30 min. The fourth- order Runge-Kutta method is adopted to calculate the advection. The vertical and horizontal diffusion is calculated by the random walk method (Guo, 2005) with the corresponding coefficient of 0.01m2s−1and 10 m2s−1, respectively. With the physical processes considered, the magnitudes of state variables of particles are averaged, and the biogeochemical processes are calculated with the average values (Liet al., 2008, 2009). An experiment has been performed to examine the mass conservation of the model using the state variable COD.
3 Simulation Results and Analysis
3.1 Model Validation
Huanget al.(1999), Jianget al.(2004), and Maoet al.(2008) demonstrated that HAMSOM performs reasonably well in simulating the hydrodynamic processes in the Bohai Sea. In this study the three-dimensional hydrodynamic fields produced by HAMSOM are used to drive the ecosystem model.
Monthly mean surface concentration of nutrients and Chl-a, which are simulated in the last two years by the model, are plotted in Fig.3. It shows that the annual cycle patterns are very similar in the last two years of the simulation, which indicates the stability of the ecosystem model. Because of the similarity of the annual cycle, only the second year results of the ecosystem model are analyzed in the sensitive experiments.
Due to insufficient observations in the bay, the basinwide surface phosphate concentration, derived from the MABHE datasets in the Bohai Sea (Chenet al., 1992), are used for the study. The simulated phosphate and DIN results show an annual cycle of high winter concentrations and high summer depletion, which agrees well with the observed data (Fig.3). The maximum concentrations occur in January, and the minimum in July. The nutrient concentrations decrease with the algal consumption after June, and rise after July due to the flood and low concentration of PPT. By the end of the year, nutrient concentrations can go up to the initial level.

Fig.3 Annual cycles of simulated (solid line with open circles) and observed surface concentrations of DIN, DIP and Chl-a in Laizhou Bay. Observed DIN are obtained from different sources. Diamond with error bar, North China Sea Branch of the State Oceanic Administration (1990–2005); pentagram, Yu et al. (2000); square, Qu et al. (2002); hexagram, Wang (2003); solid circle, Hao et al. (2005); asterisk, Li et al. (2006); cross, Sun et al. (2006). Observations of DIP (cross with error bar) are monthly mean data in the Bohai Sea and derived from MABHE datasets (Chen et al., 1992). Observations of Chl-a (triangle with error bar) are basinwide data in Laizhou Bay and derived from Fei et al. (1991).
The PPT biomass in the bay shows a double-peak structure (Fig.3), with a spring and an autumn blooms, which is a typical feature in the North Hemisphere (Feiet al., 1991; Weiet al., 2004). At the surface of the Bay, the simulated annual cycle of PPT biomass, as displayed in Chl-aconcentration, shows a reasonable consistency with the observed data in Laizhou Bay (Feiet al., 1991).
The Chl-abiomass increases with the increase of water temperature at the beginning of the year, and reaches the spring bloom in April. It decreases from May to June because of the strong ZPT grazing and DIN limitation. In summer, the DIN concentration decreases to 7.0 mmol m−3, which is below the half saturation constant of 8.5 mmol m−3. It slowly increases again from July to September when the autumn bloom occurs. The biomass gradually drops to the low winter level afterwards.
Although the primary productivity is at the highest level in summer, the most intense algae bloom occurs in spring, which corresponds to the first peak in Fig.3 (Feiet al., 1991; Weiet al., 2004; Liu and Yin, 2006a). This pattern can be explained by the strong grazing from ZPT (Bai and Zhuang, 1991; Zhaoet al., 2004) and low nutrient distributions in summer.
3.2 Seasonal Horizontal Distributions of DIN, Phosphate and PPT
The surface distributions of DIN, phosphate and PPT in Laizhou Bay show similar patterns to those in other studies (Weiet al., 2004; Liu and Yin, 2010). The simulated DIN concentrations are relatively low in spring (April) and summer (July), and high in autumn (November) and winter (February) (Fig.4).
Through the year, the DIN distributions are characterized by relatively high concentration values in the western Bay, especially near the mouths of the Yellow River and Xiaoqinghe River. The DIN concentrations decrease from the west to east of the Bay. This pattern is associated with the fact that the Yellow River and Xiaoqinghe River discharge most of DIN among all the five rivers. Moreover, compared with other rivers, higher riverine discharges of the Yellow River and Xiaoqinghe River result in much higher DIN concentrations during the flood season.
Fig.5 shows that the simulated phosphate concentrations are low in spring and summer and high in autumn and winter. Through the year, the phosphate concentration is higher around the Yellow River and Xiaoqinghe River mouths, as the two rivers discharge most of the phosphate among all the five rivers, and decreases from the Bay mouth to the head. This pattern indicates that the ocean water, the Yellow River and Xiaoqinghe River are the important phosphate sources for the Bay. The central Bay, away from the three sources, shows a relatively low phosphate level. Associated with the algal consumption in spring and summer, the phosphate level is even lower in this region.
Compared with other seasons, the spring Chl-abiomass is relatively high in Laizhou Bay (Fig.6). Through the year, the Chl-abiomass and DIN concentration are low in the northeastern Bay, while the Chl-abiomass is high around the Xiaoqinghe River mouth due to high nutrient level. Near the Yellow River mouth, the Chl-abiomass is high in spring and autumn, and low in winter and summer because the strong flow near the Yellow River mouth moves the high Chl-awater to other areas, which restrains the local algal accumulation. In spring and autumn, the strongly developed PPT near Yellow River mouth, with appropriate aqua-environmental conditions, replenishes the local Chl-ain the area. But the low solar radiation and temperature in winter and strong zooplankton grazing in summer restrain the algal growth and the local Chl-areplenishment.
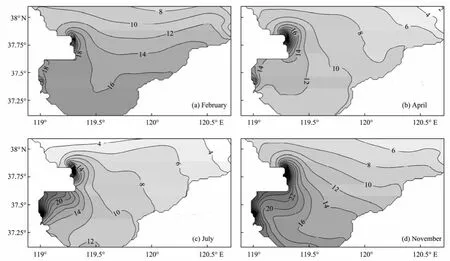
Fig.4 Simulated monthly mean horizontal distributions of DIN (mmol m−3).
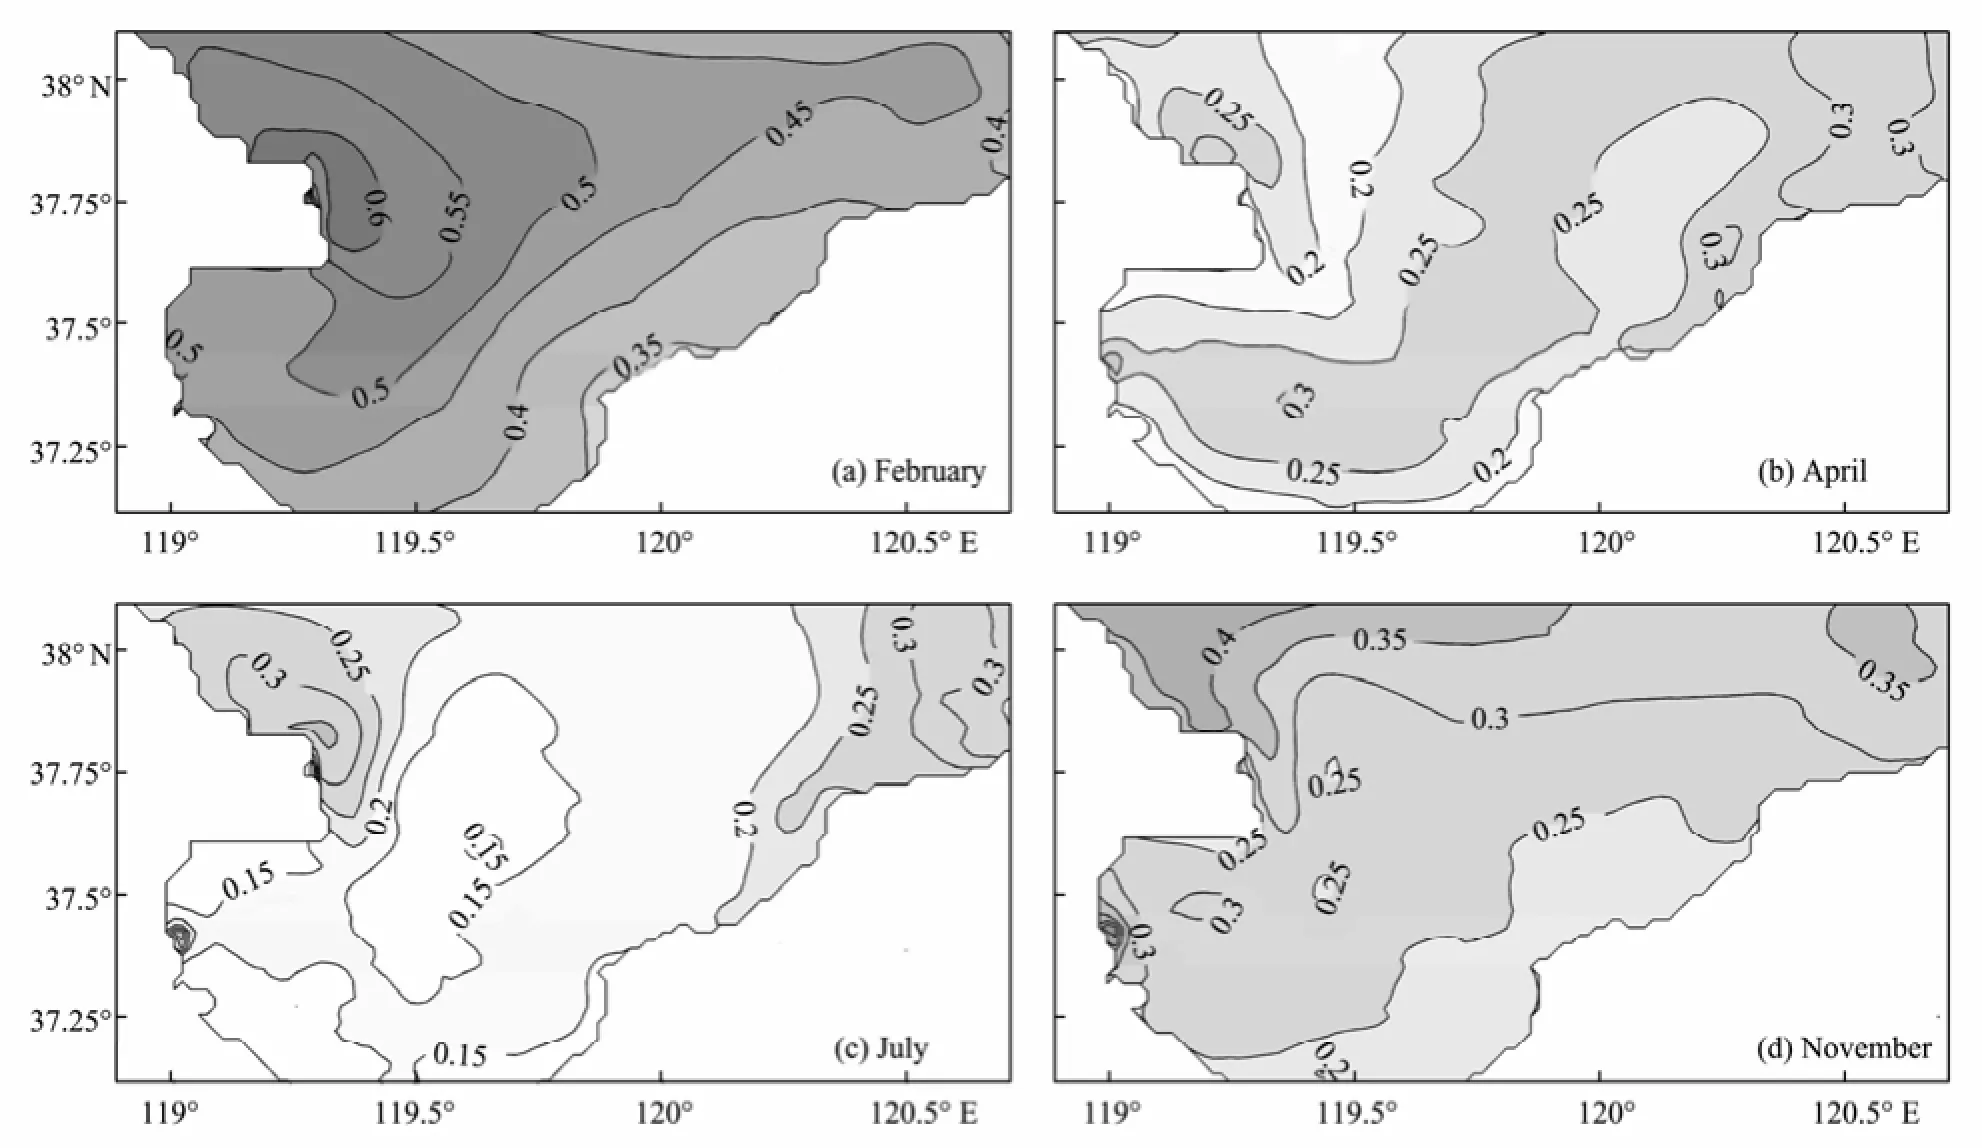
Fig.5 Simulated monthly mean horizontal distributions of phosphate (mmol m−3).
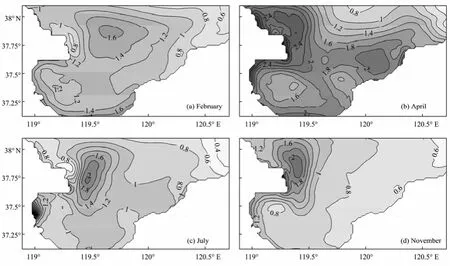
Fig.6 Simulated monthly mean horizontal distributions of Chl-a at the surface (mmol m−3).
3.3 Sensitivity Analysis
To investigate the influence of nutrient limitation on PPT dynamics, additional numerical experiments were conducted. The influence of the Yellow River and Xiaoqinghe River on the nutrient and PPT patterns was also examined.
3.3.1 Nutrient limitation in the Bay
Two experiments, the DIN and phosphate enrichment numerical experiments, were carried out in the Laizhou Bay. In each experiment, river-borne nutrient was doubled.
Fig.7 shows that in DIN enrichment case, the DIN concentration increases significantly compared with the other two cases, especially in winter. And the phosphate decreases as a consequence of the strengthened algal consumption induced by the DIN enrichment. However, in the phosphate enrichment case, the DIN concentration does not decrease significantly.

Fig.7 Annual cycles of simulated DIN, DIP and Chl-a in the standard case and enrichment cases in Laizhou Bay.
The annual mean Chl-abiomass in the standard case is 1.38 mg m−3, while those of the DIN and DIP enrichment cases are 1.54 mg m−3(11.59% higher) and 1.42 mg m−3(2.90% higher), respectively. It is suggested that the PPT dynamics is still DIN-limited in the bay. Since the algal growth could be enhanced slightly with the phosphate enrichment, the phosphate limitation might also exist. The pattern of N/P ratio shows maximums near the Yellow River and Xiaoqinghe River mouths (figures are not shown here), which indicates the possible phosphate limitation there. Also, the spring bloom in the DIN enrichment experiment occurs 1 month in advance comparing with that in the standard case.
Liu and Yin (2010) studied the nutrient limitation in the Bohai Sea. In their study, only DIN limitation exists in Laizhou Bay. Even when the phosphate concentration was set up to be 10 times larger, the algal growth was not enhanced significantly. In this study, however, the algal growth increases by 23.19% with the 10 times enhancement of phosphate concentration. The results suggest that the local nutrient limitation characters largely depend on the composition and loadings of external nutrients (Liu and Yin, 2010). Compared with the nutrient distributions in the 1980s, the DIN concentration becomes much higher and the phosphate concentration becomes lower in the 2000s (Yuet al., 2000; Wang and Li, 2006), which explains the present phosphate limitation in the bay.
3.3.2 Influence of nutrient loadings from the Yellow River and Xiaoqinghe River
Nutrients are discharged into Laizhou Bay from five rivers, among which the Yellow River is the most important and the Xiaoqinghe River the second most important nutrient source. To examine the influence of the nutrient loadings of the two rivers on the nutrient and Chl-adistributions in the Bay, two numerical experiments were carried out, one excluding the Yellow River (Exp-noYR) and the other excluding the Xiaoqinghe River (Exp-noXR), respectively.
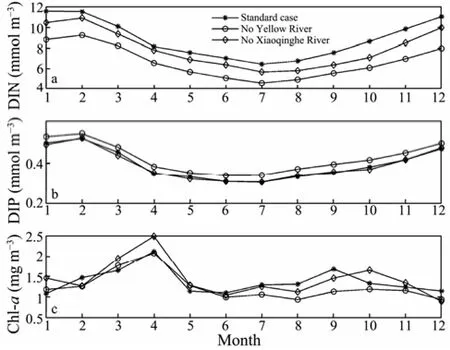
Fig.8 Calculated annual DIN, DIP and chl-a cycles in the standard case, the case excluding the Yellow River and the case excluding the Xiaoqinghe River in Laizhou Bay.
Fig.8 shows the similar patterns of annual nutrient cycles in the three cases. The main DIN sources in the Bay are the five rivers, while the sea water is an important phosphate source. Therefore, with the decrease of riverine nutrient discharges, the DIN concentration would decrease more than the phosphate concentration. In Exp- noYR, the DIN concentration decreases significantly, while the phosphate concentration increases. The increased phosphate is mainly associated with the weakened algal consumption, which is induced by the DIN decrease. In ExpnoXR, the DIN concentration does not decrease as obviously as that in Exp-noYR, while the phosphate changes slightly, which indicates that the increased phosphate concentration induced by the weakened algal growth replenishes the decreased phosphate concentration induced by the exclusion of the Xiaoqinghe River. The experiments revealed that Yellow River has an important influence on both the phosphate and DIN distributions in the Bay, while Xiaoqinghe River has little effect on the phosphate distribution.
In spring, the fast ZPT growth would occur and the PPT growth would be inhibited in the Xiaoqinghe River. Therefore the Chl-abiomass is enhanced significantly and ZPT biomass reduces in Exp-noXR during the season (figures are not shown). During the flood season, the riverine nutrients are the dominant factor for the algal growth because the season corresponds to the lowest nutrient concentrations of the year. Therefore in Exp-noYR the Chl-abiomass is inhibited significantly during the season and the second peak almost disappears, while the DIN concentration has a pronounced decrease.
4 Conclusions
A three-dimensional ecosystem model, using a PIC method, was developed to reproduce the spatial distribution and seasonal variation of nutrients and PPT in Laizhou Bay. Eight state variables,i.e., DIN, phosphate, DON, DOP, COD, Chl-a, detritus and the zooplanktonbiomass, are calculated with the model. The simulation results are consistent with observations and other modeling results.
The nutrient concentrations are at high level in winter, with a maximum value in June, and at low level in summer, with a minimum value in July. The nutrients decrease with the algal consumption after June, and increase after July due to the flood and low concentration of PPT. By the end of the year, nutrients will move up to the initial level. A double-peak structure of the PPT biomass exists in Laizhou Bay, which corresponds to the spring and autumn blooms, respectively. The Yellow River and Xiaoqinghe River are the important nutrient sources among the 5 rivers flowing into the bay, especially the Yellow River. High nutrient concentrations and the corresponding high Chl-abiomass exist around the two river mouths.
Several numerical experiments have been conducted to examine the nutrients limitation. Both the DIN limitation and phosphate limitation exist in Laizhou Bay, with the former being more significant than the latter. The PPT growth in the Bay is influenced by the discharge of the Yellow River and Xiaoqinghe River. During the flood season, the algal growth is inhibited with the Yellow River excluded in the experiment, and in spring, the algal growth is enhanced with the Xiaoqinghe River excluded.
In this study, the process of bottom nutrient flux is not considered due to lack of information. The future ecosystem models are expected to include more complete physical, chemical, and biological processes in calculating the environmental capacity of nutrients in Laizhou Bay.
Acknowledgements
We thank the funding support by the National Basic Research Program of China (973-2010CB428900), and the State Ocean Administration of China ‘908’ Foundation (No. 908-02-02-03). The harmonic constants were obtained from the NAO99 dataset (http://www.miz.nao.ac. jp/staffs/_nao99/index_En.html), and the meteorological data were derived from the NCEP (National Centers for Environmental Prediction) FNL (Final) dataset (http://dss. ucar.edu/datasets/ds083.2/). We also thank Prof. Liang Zhao and Dr. Xinyan Mao for their assistance in the hydrodynamic modeling.
Backhaus, J. O., 1985. A three-dimensional model for the simulation of shelf sea dynamics. Deutsche Hydrographische Zeitschrift, 38: 165-187.
Chapelle, A., Lazure, P., and Menesguen, A., 1994. Modelling eutrophication events in a coastal ecosystem sensitivity analysis. Estuarine, Coastal and Shelf Science, 39: 529-548.
Chen, G. Z., Niu, G. Y., and Wen, S. C., 1992. Marine Atlas of Bohai Sea, Yellow Sea, and East China Sea. Ocean Press, Beijing, 1-100 (in Chinese).
Deng, J. Y., and Jin, X. S., 2000. Study on fishery biodiversity and its conservation in Laizhou Bay and Yellow River estuary. Zoological Research, 21 (1): 76-82 (in Chinese).
Editorial Board for Marine Atlas, 1991. Marine Atlas of Bohai Sea, Yellow Sea, East China Sea, Biology and Chemistry. China Ocean Press, Beijing, 1-100 (in Chinese).
Eppley, R. W., 1972. Temperature and phytoplankton growth in the sea. Fish Bull U.S., 70: 1063-1085.
Evans, M. W., and Harlow, F. H., 1957. The particle-in-cell method for hydrodynamic calculations. Los Alamos Scientific Laboratory of the University of California, LA-2139: 1-52.
Fei, Z. L., Mao, X. H., Zhu, M. Y., Li, B., Li, B. H., Guan, Y. H., Zhang, X. S., and Lv, R. H., 1991. The study of primary productivity in the Bohai Sea: Chlorophyll a, primary productivity and potential fisheries resources. Marine Fisheries Research, 12: 55-69 (in Chinese).
Feng, S. Z., Zhang, J., and Wei, H., 2007. Introduction of Environmental Dynamics in Bohai Sea. Science Press, Beijing, 1-200 (in Chinese).
Gao, H. W., Feng, S. Z., and Guan, Y. P., 1998. Modelling annual cycles of primary production in different regions of the Bohai Sea. Fisheries Oceanography, 7 (3/4): 258-264.
Gao, H. W., Wu, D. X., Bai, J., Shi, J. H., Li, Z. Y., and Jiang, W. S., 2003. Distributions of environmental parameters in Laizhou Bay in summer, 2000. Journal of Ocean University of Qingdao, 33 (2): 185-191 (in Chinese).
Gao, H. W., and Wang, Q., 2004. A numerical study of phytoplankton biomass in the Bohai Sea in 1999. Periodical of Ocean University of China, 34 (5): 867-873 (in Chinese).
Guo, L. B., 2005. A study on the Bohai Sea in environmental capacity of petroleum hydrocarbon. Postgraduate Thesis, Ocean University of China, 29-32 (in Chinese).
Hao, Y. J., Wang, Z. L., Zhu, M. Y., Li, R. X., Sun, P. X., Xia, B., and Chen, L. Q., 2005. Investigation and assessment of nutrients and phytoplankton diversity in the Laizhou Bay. Advances in Marine Science, 23 (2): 197-204 (in Chinese).
Huang, D. J., Su, J. L., and Backhaus, J. O., 1999. Modelling the seasonal thermal stratification and baroclinic circulation in the Bohai Sea. Continental Shelf Research, 19: 1485-1505.
Jiang, W. S., Pohlmann, T., Sun, J., and Starke, A., 2004. SPM transport in the Bohai Sea: Field experiments and numerical modelling. Journal of Marine System, 44: 175-188.
Li, G. L., Chen, B. J., Cui, Y., Ma, S. S., and Tang, X. X., 2006. Ecological characteristics of phytoplankton in the Laizhou Bay. Journal of Fishery Sciences of China, 13 (2): 292-299 (in Chinese).
Li, K. Q., Wang, X. L., Shi, X. Y., Zhu, C. J., and Li, R. X., 2007. Modelling nitrogen and phosphorus transport and transformation in pelagic ecosystem in mesocosm in Jiaozhou Bay. Acta Oceanologica Sinica, 29 (3): 76-83 (in Chinese).
Li, K. Q., Wang, X. L., Liang, S. K., Shi, X. Y., Zhu, C. J., and Chen, H., 2008. A nitrogen and phosphorus dynamic model of mesocosm pelagic ecosystem in the Jiaozhou Bay in China. Acta Oceanologica Sinica, 27 (5): 98-110.
Li, K. Q., Wang, X. L., Han, X. R., Shi, X. Y., and Chen, H., 2009. Modelling nitrogen and phosphorus dynamics in a mesocosm pelagic ecosystem in Laizhou Bay in China. Oceanic and Coastal Sea Research, 8 (2): 133-140.
Liu, H., and Yin, B. S., 2007. Annual cycle of carbon, nitrogen and phosphorus in the Bohai Sea : A model study. Continental Shelf Research, 27: 1399-1407.
Liu, H., and Pan, W. R., 2008. Model for study on impact of external nutrient sources on the algalbloom. Advances in Water Science, 19 (3): 345-351 (in Chinese).
Liu, H., and Yin, B. S., 2010. Numerical investigation of nutrient limitations in the Bohai Sea. Marine Environmental Re-search, 70: 308-317.
Mao, X. Y., Jiang, W. S., Zhao, P., and Gao, H. W., 2008. A 3-D numerical study of salinity variations in the Bohai Sea during the recent years. Continental Shelf Research, 28: 2689-2699.
Qu, K. M., Cui, Y., Xin, F. Y., Chen, M. S., Song, Y. L., and Yuan, Y. X., 2002. The plane distribution and seasonal variations of nutrients in the east of Laizhou Bay. Marine Fisheries Research, 23 (1): 37-46 (in Chinese).
Radach, G., and Moll, A., 1993. Estimation of the variability of production by simulating annual cycles of phytoplankton in the central North Sea. Progress in Oceanography, 31: 339-419.
Riley, G. A., 1946. Factors controlling phytoplankton populations on Georges Bank. Journal of Marine Research, 6: 54-73.
Sun, P. X., Wang, B., Zhang, Z. H., Wang, Z. L., and Xia, B., 2006. Relationship between nutrient distributions and eutrophication in sea water of the Laizhou Bay. Advances in Marine Science, 24 (3): 329-335 (in Chinese).
Tang, Q. S., and Meng, T. X., 1997. Atlas of the Ecological Environment and Living Resources in the Bohai Sea. Qingdao Press, Qingdao, 1-100 (in Chinese). Wang, J., 2003. Species composition and quantity variation of phytoplankton in inshore waters of the Bohai Sea. Marine Fisheries Research, 24 (4): 44-50 (in Chinese).
Wang, X. L., and Li, K. Q., 2006. Marine Environmental Capacity of Pollutants in Bohai Sea. Science Press, Beijing, 1-300 (in Chinese).
Wei, H., Sun, J., Moll, A., and Zhao, L., 2004. Phytoplankton dynamics in the Bohai Sea–observations and modelling. Journal of Marine Systems, 44: 233-251.
Wen, Y. H., and Peters, R. H., 1994. Empirical models of phosphorus and nitrogen excretion rates by zooplankton. Limnology and Oceanography, 39 (7): 1669-1679.
Yellow River Conservancy Commission, 2000–2009. Water Resources Bulletin of Yellow River, 1-30 (in Chinese).
Yu, Z. G., Mi, T. Z., Xie, B. D., Yao, Q. Z., and Zhang, J., 2000. Changes of the environmental parameters and their relationship in recent twenty years in the Bohai Sea. Marine Environmental Science, 19 (1): 15-19 (in Chinese).
Zhao, L., Wei, H., Xu, Y. F., and Feng, S. Z., 2005. An adjoint data assimilation approach for estimating parameters in a three-dimensional ecosystem model. Ecological Modelling, 186: 234-249.
(Edited by Xie Jun)
* Corresponding author. E-mail: yang.bo@ouc.edu.cn
(Received December 6, 2011; revised February 21, 2012; accepted January 22, 2013)
© Ocean University of China, Science Press and Springer-Verlag Berlin Heidelberg 2014
 Journal of Ocean University of China2014年1期
- Journal of Ocean University of China的其它文章
- Surface Heat Budget and Solar Radiation Allocation at a Melt Pond During Summer in the Central Arctic Ocean
- QSAR for Photodegradation Activity of Polycyclic Aromatic Hydrocarbons in Aqueous Systems
- Study on Deformation Law of Circular Foundation Under Combined Loading
- Diagnosis of Physical and Biological Controls on Phytoplankton Distribution in the Sargasso Sea
- Properties of Klebsiella Phage P13 and Associated Exopolysaccharide Depolymerase
- Seasonal Distribution of Bioaerosols in the Coastal Region of Qingdao
