
Soil Moisture E ff ects on Sand Saltation and Dust Emission Observed over the Horqin Sandy Land Area in China
2014-04-12 08:24:12LIXiaolanandZHANGHongsheng
LI Xiaolanand ZHANG Hongsheng
Laboratory for Climate and Ocean-Atmosphere Studies,Department of Atmospheric and Oceanic Sciences, School of Physics,Peking University,Beijing100871
Soil Moisture E ff ects on Sand Saltation and Dust Emission Observed over the Horqin Sandy Land Area in China
Laboratory for Climate and Ocean-Atmosphere Studies,Department of Atmospheric and Oceanic Sciences, School of Physics,Peking University,Beijing100871
In this study,the e ff ects of soil moisture on sand saltation and dust emission over the Horqin Sandy Land area are investigated,based on observations of three dust events in 2010.The minimum friction velocity initiating the motion of surface particles,namely,the threshold friction velocity,is estimated to be 0.34, 0.40,and 0.50 m s−1under the very dry,dry,and wet soil conditions,respectively.In comparison with the observations during the dust events under the very dry and dry soil conditions,the dust emission fl ux during the wet event is smaller,but the saltation activities of sand particles(d≥ 50µm)are stronger.The size distributions of airborne dust particles(0.1 ≤d≤ 20µm)show that concentrations of the fi ner dust particles(0.1 ≤d≤ 0.3µm)have a secondary peak under dry soil conditions,while they are absent under wet soil conditions.This suggests that the surface soil particle size distribution can be changed by soil moisture.Under wet soil conditions,the particles appear to have a larger size,and hence more potential saltating particles are available.This explains the occurrence of stronger saltation processes observed under wet soil conditions.
soil moisture,sand saltation,dust emission,Horqin Sandy Land area
1.Introduction
Dust emission generated by wind erosion usually occurs in many arid,semi-arid,and agricultural areas around the world(Shao,2008).Mineral aerosols participate in many physical,chemical,and biogeological processes of the earth system(Shao et al.,2011).Dust particles with diameters less than 20μm(PM20)can remain suspended in the atmosphere for a long period of time and be transported over a long distance. These particles play an important role in the climate system through their direct and indirect radiation effects(Sokolik and Toon,1996;Rosenfeld et al.,2001; Yin et al.,2002;Ahn et al.,2007).
Saltation bombardment is well known as a major mechanism for dust emission(Gillette,1977;Gomes et al.,1990;Shao et al.,1993;Houser and Nickling,2001; Sow et al.,2009).Dust emission fl ux is calculated from streamwise saltation fl ux in most dust emission models(e.g.,Shao et al.,1993;Marticorena and Bergametti,1995;Alfaro and Gomes,2001).The processes of sand saltation and dust emission are in fl uenced by a great number of factors,such as atmospheric conditions,soil properties,land surface characteristics,and so on.The threshold friction velocity,u∗t,de fi ned as the minimum friction velocity(u∗)to initiate the motion of surface particles,is determined by these factors (Belly,1964;Gillette et al.,1980,2004).Soil moisture is among the most critical factors for both sand saltation and dust emission processes as it modules the inter-particle and surface-particle cohesive forces acting on the dust particles(Ishizuka et al.,2008).Most previous studies indicate that wet soil conditions tend to increase theu∗tvalues,and hence suppress salta-tion and dust emission(Chepil,1945;Ishizuka et al., 2005,2008,2009;Kimura et al.,2009;Sow et al., 2009).However,the e ff ects of soil moisture on saltation and dust emission become very complex under natural soil conditions.Park et al.(2010)proposed that soil moisture has little e ff ect on dust concentration,because the residence time of moisture in surface soil is relatively short in dust source regions.Li and Zhang(2012)also found that soil moisture content at 5-cm depth did not show any obvious impact on the seasonal variation of dust concentration over the Horqin Sandy Land area of China from December 2010 to November 2011,during which the soil moisture content ranged from 0.020 to 0.150 v v−1.More attention should be paid to this controversial problem by carrying on relative fi eld observations.
In this study,observational data obtained from a sandstorm monitoring station at the Horqin Sandy Land area in China are used to comparatively investigate the characteristics of sand saltation and dust emission processes during three dust events in 2010 under di ff erent soil moisture conditions.
2.Data and method
The experimental site is located at the Horqin Sandy Land area in Inner Mongolia(42°55′30.3′′N, 120°41′1.9′′E)(Fig. 1). The instruments are installed on a 20-m high monitoring tower.The micrometeorological data include wind speed at 2-,4-,16-, and 20-m heights,air temperature and relative humidity at 2-,4-,8-,and 16-m heights,wind direction at 20-m height,soil moisture content and temperature at 5-,20-,and 50-cm depths,and precipitation rate at ground surface.Dust(PM10)mass concentration at 3-and 18-m heights and saltation activities of sand particles are simultaneously measured at 10-min sample intervals.In addition,the dust mass concentration of particles at di ff erent sizes(0.1 ≤d≤ 20μm)at 3-m height is measured by a 10-stage quartz crystal microbalance(QCM)cascade impactor(PC-2HX,California Measurements,Inc.).The size cuto ffdiameters for each stage are 10,7,4,2.5,1.4,0.7,0.45,0.3,0.2, and 0.1μm,respectively.Table 1 lists the instrument speci fi cations and placements installed over the Horqin station.
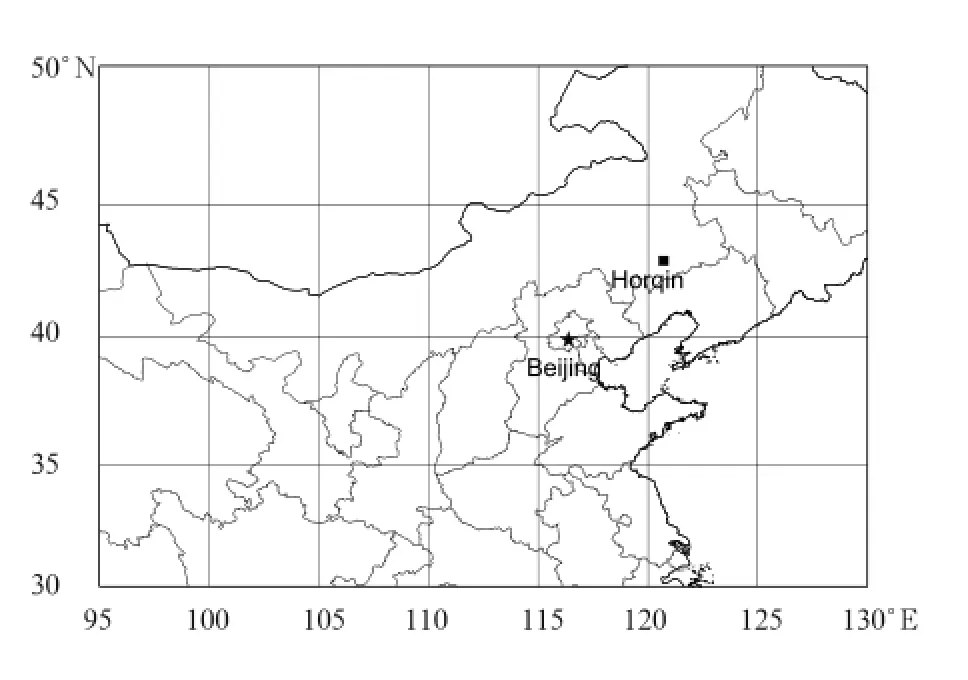
Fig.1.Geographical location of the Horqin station.
The pro fi le data of wind speed and air temperature are used to calculate friction velocityu∗,based on Monin-Obukhov similarity theory(Garratt,1992; Zhu and Zhang,2010).
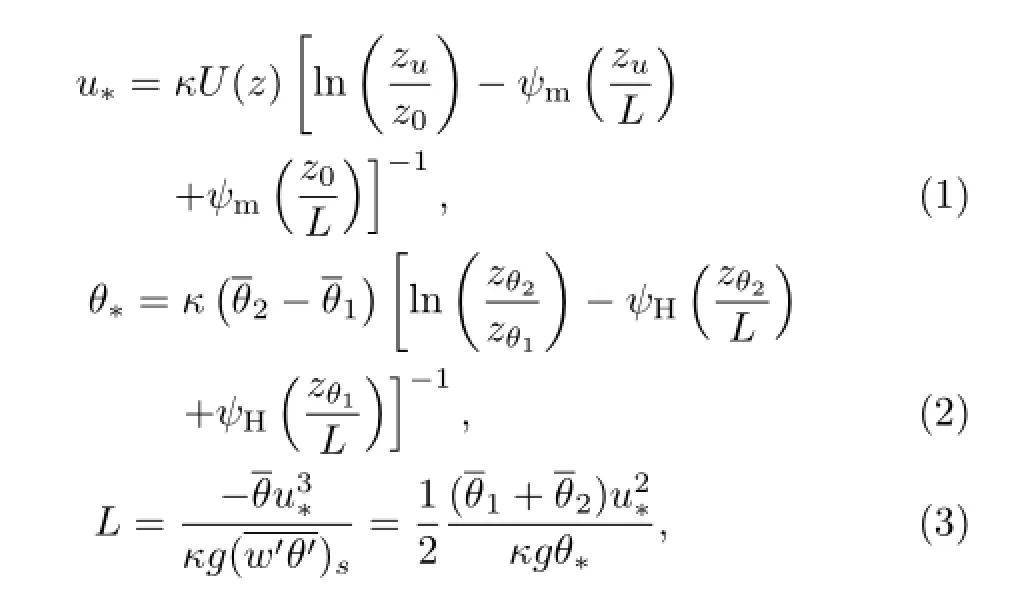
whereκ(=0.40)is von K´arm´an’s constant,Uis the wind speed,θis the potential temperature,z0is the roughness length,Lis the Obukhov length,andψmandψHare the surface layer stability correction functions for momentum and heat,respectively.Variablezais the observational height of the quantitya.Here,zu=4 m,zθ1=2 m,andzθ2=4 m.
The value ofz0can be theoretically estimated by fi tting wind speed pro fi les under neutral atmospheric conditions and set to the measure height when wind speed equals zero.Considering it is rare to observe neutral conditions,z0can be computed by the leastsquare fi tting method for wind speed pro fi les under near-neural conditions,which are de fi ned with the following criteria:(1)the wind speed at the 4-m height is>8 m s−1(Ishizuka et al.,2008);(2)|ΔT|between2-and 4-m heights is<0.2°C;and(3)the wind directions range between 225°and 360°,which prevail for most dust events over the Horqin station.Here,z0is estimated to be 0.75 mm.This value is reasonable for a bare sandy fi eld with little vegetation(Xian et al.,2002).The values ofu∗,θ∗,andLare then iteratively calculated for every 10 min based on Eqs. (1)–(3)(Zhang et al.,2008).
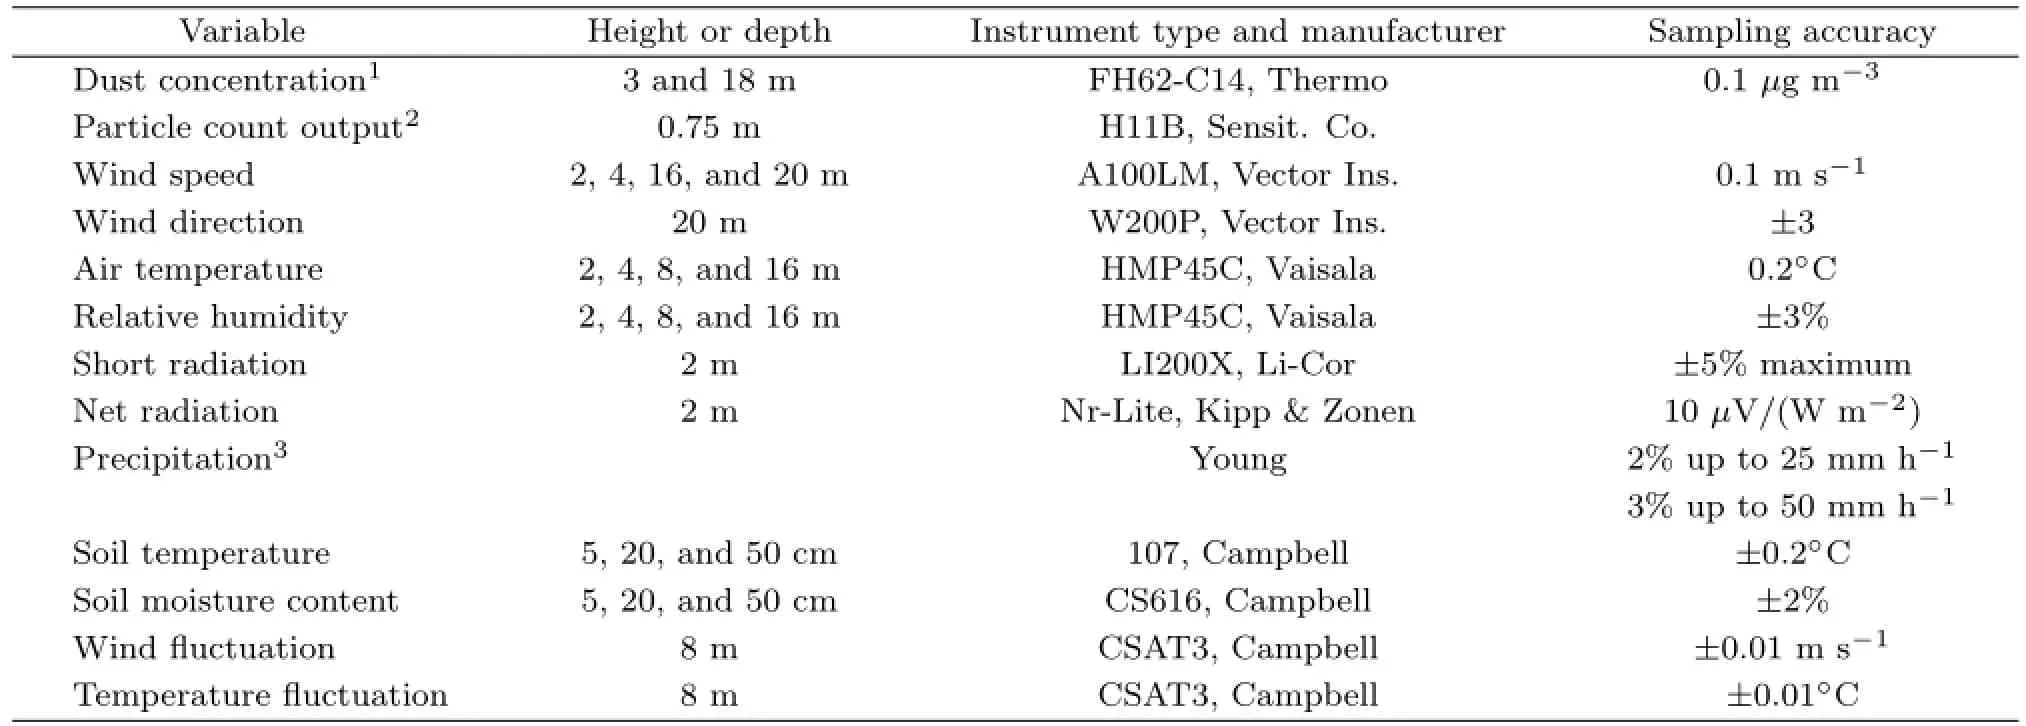
Table 1.Instrumental setting at the Horqin station
Dust emission fl ux,F,can be computed by using dust concentration gradient measurements with an assumption that the particles with aerodynamic diameters<10μm are light enough to follow air movements perfectly(Gillette et al.,1972;Zhang et al.,2008;Sow et al.,2009).

whereCis the dust(PM10)mass concentration,zc1= 3 m,andzc2=18 m.Variableψcequals toψHthat is the same as that in Eq.(2),and other variables are the same as those in Eq.(1).
3.Results
3.1 Local dust emission events
Figure 2 shows the variations of daily precipitation rate and soil moisture content(SMC)at 5-cm depth in May 2010.The surface soil was dry(SMC<0.075 v v−1)before 4 May.A precipitation event with the maximum precipitation rate occurred on 5 May, and it was followed by an abrupt increase up to 0.112 v v−1in SMC.The values of SMC decreased gradually during the next few days,mainly due to the evaporation of soil moisture.The precipitation event on 18 May contributed to the wet soil conditions on 19 May. Figure 2 indicates that two dust events took place in May 2010:a severe dust storm(Event 1)under dry soil conditions(0.074<SMC<0.075 v v−1)on 2 May, and a less severe dust storm(Event 2)under wet soil conditions(0.090<SMC<0.094 v v−1)on 19 May. Another dust storm event(Event 3)on 27 November 2010 was also selected as a case under very dry soil conditions(0.031<SMC<0.033 v v−1)for further analysis.
Figure 3 shows the variations of dust concentration at 3-m height and wind speed at 4-m height in the three dust events.Before the breakout of the severe dust storm on 2 May,the background dust concentration was smaller than 200μg m−3.As the wind speed increased,the dust concentration increased at 0800 BT(Beijing Time)and it reached the maximum of 953.1μg m−3at 0950 BT.After the wind speed decreased,the dust concentration was reduced to its background concentration at 1700 BT(Fig.3a).The other two dust events showed similar variations for lo-cal dust events that dust concentration increases(decreases)with the increase(decrease)of wind speed(Li and Zhang,2011).Event 2 continued from 1000 to 1600 BT on 19 May,with the maximum dust concentration reaching 312.3μg m−3at 1440 BT(Fig.3b). Event 3 lasted for 10 h,from 1200 to 2200 BT on 27 November,and its fi rst peak in dust concentration was 452.1μg m−3at 1340 BT(Fig.3c).
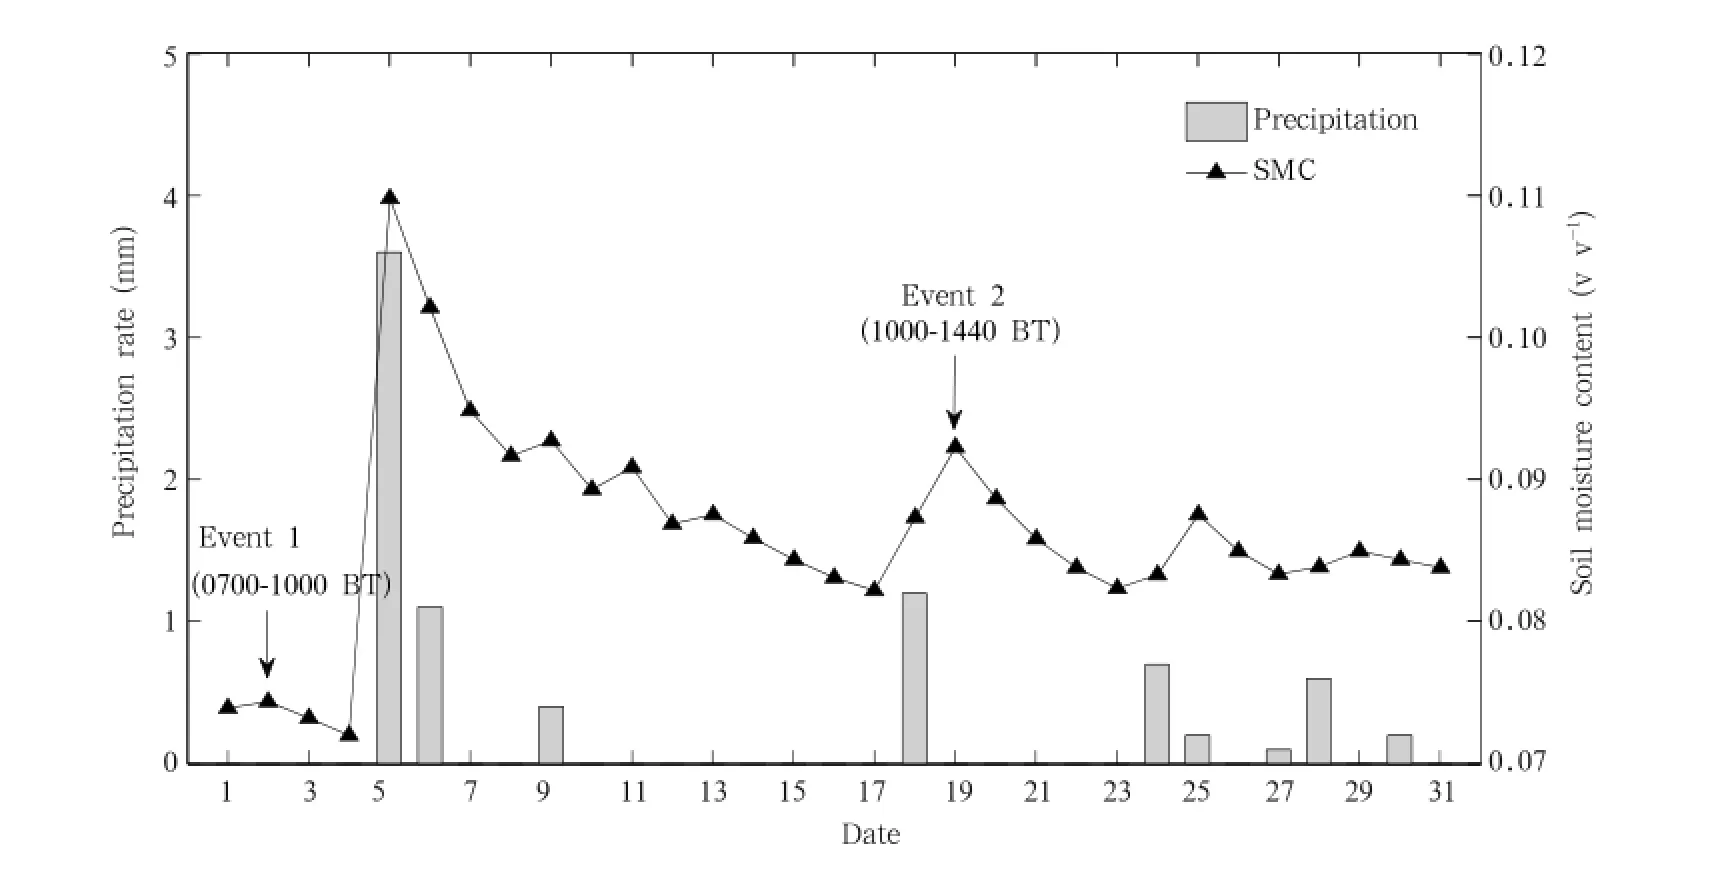
Fig.2.Variations of daily precipitation rate and soil moisture content at 5-cm depth in May 2010.
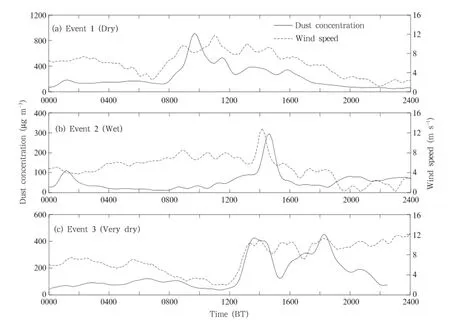
Fig.3.Temporal variations of dust concentration at 3-m height(solid line)and wind speed at 4-m height(dashed line) in three dust events in 2010 under di ff erent soil conditions.(a)Event 1 on 2 May,(b)Event 2 on 19 May,and(c)Event 3 on 27 November 2010.
The start of a dust-emission period is de fi ned as the time when dust concentration begins to contin-uously increase from its background level,while the end of the period is de fi ned by the time of maximum dust concentration.Thus,the dust-emission period is 0700–1000 BT in Event 1,1000–1440 BT in Event 2, and 1200–1340 BT in Event 3.
Figure 4 shows the saltation activities of sand particles represented by the variations of the response number(per 10 min)of a saltation detector(H11B, Sensit.Co.,USA)and the dust emission fl ux for the three dust events.Note that the negativeFvalues related to dust advection/deposition were ignored,e.g., 1200–1300 and 1700–1900 BT in Event 1(Fig.4a). The negativeFdid not in fl uence the dust-emission periods.
The saltation activities are found to be consistent with the dust emission fl ux for the three dust events.This supports the well-known conclusion that the saltation bombardment is one of the main mechanisms for dust emission.However,it is interesting to notice that although the dust emission fl ux is basically proportional to the saltation activities in an individual dust event,the proportionality between them is di ff erent for di ff erent events,because it has changed and depends on soil moisture.For instance,the Sensit response numbers were less than 5 and the magnitude of dust fl ux was about 30μg m−2s−1in the dustemission periods of Events 1 and 3(Figs.4a and 4c); while for Event 2,the saltation activities were much stronger but the dust fl ux was smaller(F<18μg m−2s−1).Fwas very small at the beginning period (0830–1400 BT)of Event 2 and increased rapidly in the period of 1400–1500 BT after many saltating particles continuously collided with the surface(Fig.4b), which is related to the soil crust at the surface under wet soil conditions.
3.2 Meteorological conditions
Figure 5 displays the variations of wind direction and speci fi c humidity for the three dust events. The wind direction changed suddenly from southwest (about 225°)to northwest(about 325°)at the beginning of the dust-emission period in Event 1,corresponding to the collapse of the inversion layer,while it varied slowly in Event 2,and it had a small change at 1200 BT in Event 3.However,the northwest wind prevailed during the dust-emission periods of all thethree dust events(Fig.5a).

Fig.4.As in Fig.3,but for the response number(solid bar)and dust emission fl ux(solid line).

Fig.5.Temporal variations of(a)wind direction and(b)speci fi c humidity at 4-m height in the three dust events under di ff erent soil conditions.
The speci fi c humidity,q,was largest(q>6.0 g kg−1)in Event 2 mainly due to the rainfall event.The values ofqwere small in Event 1(2.0<q<4.5 g kg−1),and they were the smallest in Event 3(q<2.0 g kg−1)(Fig.5b).
3.3 E ff ect of soil moisture on u∗t
Figure 6 shows the relationship between the friction velocityu∗and dust concentration during the dust-emission periods in the three dust events.At the beginning of the dust-emission period of each event,u∗gradually increased but the values of dust concentration remained small.Whenu∗exceededu∗t,the dust concentration increased rapidly.Similar to other de finitions used in other studies(Gillette and Ono,2008; Sow et al.,2009;Yang et al.,2012),u∗tis de fi ned as the value ofu∗when the dust concentration increases by 20%for at least half an hour.Here,20%was defi ned in terms of the background dust concentration (Li and Zhang,2011).The values ofu∗twere estimated to be 0.40,0.50,and 0.34 m s−1in Events 1,2, and 3,respectively.The dust concentrations were detected at much lower levels under wet conditions than under dry conditions,despite the fact that higheru∗(>0.6 m s−1)was observed under the wet conditions. This result is consistent with many previous observations(Ishizuka et al.,2008),indicating that soil moisture can constrain fi ne particles from being released into the atmosphere.
3.4 E ff ect of soil moisture on sand saltation

Fig.6.Scatter plot of dust concentration and friction velocityu∗during the dust-emission periods in the three dust events.
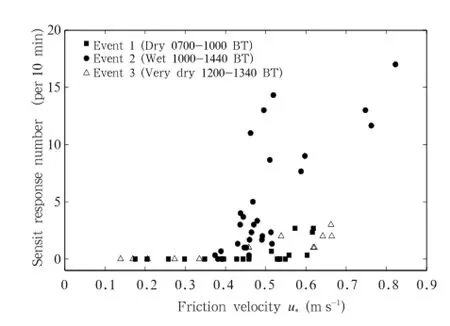
Fig. 7.As in Fig.6,but for friction velocityu∗and Sensit response numbers.
Figure 7 shows the variations ofu∗and the Sensit response number during the dust-emission periods of the three dust events.The strong and sustained saltation activities were observed in Event 2 under wet conditions.For most of time,whenu∗had the same value, the observed Sensit response numbers were larger in Event 2 than those in Events 1 and 3.The possible reason is that dust particles adhered to sand particles or aggregated together when the soil was wetted by the rainfall event,which may provide more potential saltating particles than under dry conditions.It has been observed that the increasing soil moisture can move the peak of surface particle size distribution towards a larger size(e.g.,Mikami et al.,2005;Ishizuka et al.,2008).Unfortunately,the surface sand particle distribution was not measured for these three events.
3.5 E ff ect of soil moisture on dust emission
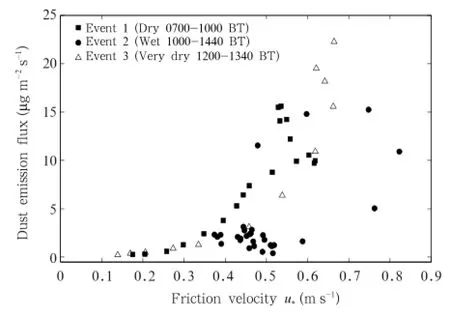
Fig.8.As in Fig.6,but for friction velocityu∗and dust emission fl uxF.
Figure 8 shows the variations of the dust emission fl uxFwithu∗in the dust-emission periods for the three dust events.Althoughu∗was larger under wet conditions,the dust emission was much weaker in contrast to the saltation process.This was probably because the binding forces between particles were enhanced under wet conditions,so the saltation bombardment was not strong enough to overcome these forces.Meanwhile,the higher air humidity in Event 2 had a negative impact on dust emission(Ravi et al., 2006).
4.Conclusions and discussion
Using the micro-meteorological data and dust observations,the e ff ects of soil moisture on the saltation and dust emission processes were studied during three local dust events in 2010 over the Horqin Sandy Land area,i.e.,Event 1 on 2 May under dry soil conditions,Event 2 on 19 May under wet conditions,and Event 3 on 27 November under very dry conditions. The results con fi rmed that the increase of soil moisture can increase the values ofu∗tand largely suppress dust emission fl ux.The saltation process was in fl uenced by both wind speed and soil moisture.The saltation intensity was stronger under wet soil conditions,which suggests that soil moisture can change the surface particle size distribution and provide more potential saltating particles.
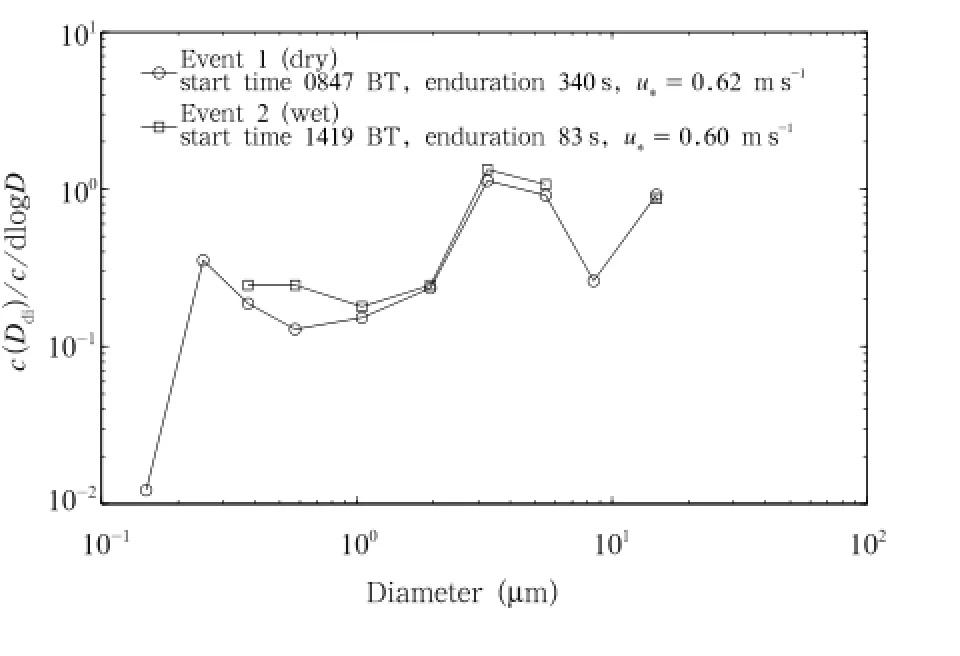
Fig. 9. Size distributions of airborne dust concentration under dry and wet soil conditions,as measured by the QCM cascade impactor.
Figure 9 shows the distribution of relative ratio of dust concentration in each particle sizec(Ddi)(10 size stages of 0.1–0.2,0.2–0.3,0.3–0.45,0.45–0.7,0.7–1.4,1.4–2.5,2.5–4.0,4.0–7.0,7.0–10.0,and 10.0–20.0μm) to the total PM20concentrationcwith particle diameter under dry and wet soil conditions.With consideration of the dependence of the relative ratioc(Ddi)/con the width of each size bin ΔDor ΔlogD,the width on a logarithmic coordinates dlogDwas divided(no unit).The values ofu∗(about 0.6 m s−1)are close to each other for the two QCM samples during the dustemission periods.It can be found that the suspending dust particles in the atmosphere had a signi fi cant peak at 4.5–7.0μm for both events.A secondary peak for fi ne particles at 0.2–0.3μm occurred under dry soil conditions,but had not been detected under wet conditions.It indirectly supports that soil moisture can change the soil particle size distribution.
Almost all physical processes related to wind erosion are particle-size dependent.Surface soil size distribution under natural conditions greatly depends on wind conditions,local soil properties,and landsurface characteristics(Westphal et al.,1987;Gomes et al.,1990;Alfaro et al.,1998)and is more or less in fl uenced by dust particles transported from other regions(Zhang et al.,1998;Maring et al.,2003).The three dust events in this study have similar surface roughness length and wind speed,but very di ff erent soil moisture conditions.Soil moisture is assumed to have signi fi cant impacts on the size distribution of the surface soil particles.Our observations provide some facts and reasonable explanations,and more attentions should be paid to the size-dependent observations in the future.
REFERENCES
Ahn,H.,S.-U.Park,and L.Chang,2007:E ff ect of direct radiative forcing of Asian dust on the meteorological fi elds in East Asia during an Asian dust event period.J.Appl.Meteor.Climatol.,46,1655–1681, doi:10.1175/JAM2551.1.
Alfaro,S.C.,A.Gaudichet,L.Gomes,et al.,1998:Mineral aerosol production by wind erosion:Aerosol particle sizes and binding energies.Geophys.Res. Lett.,25,991–994,doi:10.1029/98GL00502.
—–,and L.Gomes,2001:Modeling mineral aerosol production by wind erosion,emission intensities and aerosol size distributions in source areas.J.Geophys.Res.,106,18075–18084,doi: 10.1029/2000JD900339.
Belly,P.Y.,1964:Sand Movement by Wind.Tech.Rep. 1,US Army Coastal Engineering Research Center, 80 pp.
Chepil,W.S.,1945:Dynamics of wind erosion:1.Nature of movement of soil by wind.Soil Sci.,60, 305–320.
Garratt,J.R.,1992:The Atmospheric Boundary Layer. Cambridge University Press,52–53.
Gillette,D.A.,1977:Fine particulate emissions due to wind erosion.Trans.ASAE,20,890–897.
—–,I.H.Bli ff ord,and C.R.Fenster,1972:Measurements of aerosol size distributions and fl uxes of aerosols on land subject to wind erosion.J.Appl. Meteor.,11,977–987.
—–,J.Adams,A.Endo,et al.,1980:Threshold velocities for input of soil particles into the air by desert soils.J.Geophys.Res.,85(C10),5621–5630.
—–,D.Ono,and K.Richmond,2004:A combined modeling and measurement technique for estimating wind blown dust emissions at Owens(dry)Lake, California.J.Geophys.Res.,109,F01003,doi: 10.1029/2003JF000025.
—–,and D.Ono,2008:Expressing sand supply limitation using a modi fi ed Owen saltation equation.Earth Surf.Process.Landforms,33,1806–1813.
Gomes,L.,G.Bergametti,G.Coud´e-Gaussen,et al., 1990:Submicron desert dusts:A sandblasting process.J.Geophys.Res.,95(D9),13927–13935,doi: 10.1029/JD095iD09p13927.
Houser,C.A.,and W.G.Nickling,2001:The emission and vertical fl ux of particulate matter<10µm from a disturbed clay-crusted surface.Sedimentology,48, 255–267.
Ishizuka,M.,M.Mikami,Y.Yamada,et al.,2005: An observational study of soil moisture e ff ects on wind erosion at a gobi site in the Taklimakan Desert.J.Geophys.Res.,110,D18S03,doi: 10.1029/2004JD004709.
—–, —–,J.Leys,et al.,2008:E ff ects of soil moisture and dried raindroplet crust on saltation and dust emission.J.Geophys.Res.,113,D24212,doi: 10.1029/2008JD009955.
—–, —–,Y.Yamada,et al.,2009:Threshold friction velocities of saltation sand particles for di ff erent soil moisture conditions in the Taklimakan Desert.SOLA,5,184–187.
Kimura,R.,L.Bai,and J.Wang,2009:Relationship among dust outbreaks,vegetation cover,and surface soil water content.Catena,77,292–296.
Li,X.,and H.S.Zhang,2011:Research on threshold friction velocities during dust events over the Gobi Desert in Northwest China.J.Geophys.Res., 116(D20),doi:10.1029/2010JD015572.
—–,and —–,2012:Seasonal variations in dust concentration and dust emission observed over Horqin Sandy Land area in China from December 2010 to November 2011.Atmos.Environ.,61,56–65.
Maring,H.,D.L.Savoie,M.A.Izaguirre,et al.,2003: Mineral dust aerosol size distribution change during atmospheric transport.J.Geophys.Res.,108(D19), doi:10.1029/2002JD002536.
Marticorena,B.,and G.Bergametti,1995:Modeling the atmospheric dust cycle:1. Design of a soilderived dust emission scheme.J.Geophys.Res., 100,16415–16430,doi:10.1029/95JD00690.
Mikami,M.,T.Aoki,M.Ishizuka,et al.,2005:Observation of concentration distribution of desert aerosols in the south of the Taklimakan Desert,China.J. Meteor.Soc.Japan.,83,31–43.
Park,S.-U.,M.-S.Park,and Y.Chun,2010:Asian dust events observed by a 20-m monitoring tower in Mongolia during 2009.Atmos.Environ.,44,4964–4972.
Ravi,S.,T.M.Zobeck,T.M.Over,et al.,2006:On the e ff ect of moisture bonding forces in air-dry soils on threshold friction velocity of wind erosion.Sedimentology,53,597–609.
Rosenfeld,D.,Y.Rudich,and R.Lahav,2001:Desert dust suppressing precipitation:A possible deserti fication feedback loop.Proc.Natl.Acad.Sci.USA, 98,5975–5980.
Shao,Y.,M.R.Raupach,and P.A.Findlater,1993:The e ff ect of saltation bombardment on the entrainment of dust by wind.J.Geophys.Res.,98,12719-12726. Shao,Y.,2008:Physics and Modelling of Wind Erosion. Atmospheric and Oceanographic Sciences Library, Vol.37,Kluwer Academic Publishing,Dordrecht, preface 1,V.
—–,M.R.Raupach,and P.A.Findlater,1993:The e ff ect of saltation bombardment on the entrainment of dust by wind.J.Geophys.Res.,98,12719–12726.
—–,M.Ishizuka,M.Mikami,et al.,2011:Parameterization of size-resolved dust emission and validation with measurements.J.Geophys.Res.,116,D08203, doi:10.1029/2010JD014527.
Sokolik,I.N.,and O.B.Toon,1996:Direct radiative forcing by anthropogenic airborne mineral aerosols.Nature,381,681–683.
Sow,M.,S.C.Alfaro,J.L.Rajot,et al.,2009:Size resolved dust emission fl uxes measured in Niger during 3 dust storms of the AMMA experiment.Atmos. Chem.Phys.,9,3881–3891.
Westphal,D.L.,O.B.Toon,and T.N.Carlson, 1987: A two-dimensional numerical investigation of the dynamics and microphysics of Saharan dust storms.J.Geophys.Res.,92(D3),3027–3049,doi: 10.1029/JD092iD03p03027.
Xian,X.,T.Wang,Q.Sun,et al.,2002:Field and wind-tunnelstudiesofaerodynamic roughness length.Bound.-Layer Meteor.,104,151–163,doi: 10.1023/A:1015527725443.
Yang Xinghua,He Qing,M.Ali,et al.,2012:A fi eld experiment on dust emission by wind erosion in the Taklimakan Desert.Acta Meteor.Sinica,26,241–249.
Yin,Y.,S.Wurzler,Z.Levin,et al.,2002:Interactions of mineral dust particles and clouds:E ff ects on precipitation and cloud optical properties.J.Geophys.Res.,107(D23),AAC 19-1–AAC 19-14,doi: 10.1029/2001JD001544.
Zhang Hongsheng,Zhu Hao,Peng Yan,et al.,2008:Experiment on dust fl ux during dust storm periods over sand desert area.Acta Meteor.Sinica,22, 239–247.
Zhang,X.Y.,R.Arimoto,G.H.Zhu,et al.,1998: Concentration,size-distribution and deposition of mineral aerosol over Chinese desert regions.Tellus B,50,317–330.
Zhu Hao and Zhang Hongsheng,2010:Estimation of the threshold friction velocities over various dust storm source areas in Northwest China.Acta Meteor.Sinica,24,548–557.
:Li Xiaolan and Zhang Hongsheng,2014:Soil moisture e ff ects on sand saltation and dust emission observed over the Horqin Sandy Land area in China.J.Meteor.Res.,28(3),444–452,
10. 1007/s13351-014-3053-3.
(Received July 19,2013;in fi nal form March 27,2014)
Supported by the National(Key)Basic Research and Development(973)Program of China(2010CB428501),China Meteorological Administration Special Public Welfare Research Fund(GYHY201006014),National Natural Science Foundation of China (41075005),and Research Fund for Doctoral Program of Higher Education of China(20110001130010).
∗Corresponding author:hsdq@pku.edu.cn.
©The Chinese Meteorological Society and Springer-Verlag Berlin Heidelberg 2014
 Journal of Meteorological Research2014年3期
- Journal of Meteorological Research的其它文章
- Scenario Analysis on the Adaptation of Di ff erent Maize Varieties to Future Climate Change in Northeast China
- Simulation of the Electri fi cation of a Tropical Cyclone Using the WRF-ARW Model:An Idealized Case
- The First Observed Cloud Echoes and Microphysical Parameter Retrievals by China’s 94-GHz Cloud Radar
- Marine-Atmospheric Boundary Layer Characteristics over the South China Sea During the Passage of Strong Typhoon Hagupit
- Characteristics of the Regional Meteorological Drought Events in Southwest China During 1960–2010
- Spatiotemporal Variations of Cloud Amount over the Yangtze River Delta,China