
An estimation of groundwater storage variations from GRACE gravity satellites in the Heihe River Basin, northwestern China
2014-03-31 00:28:39YanPingCaoZhuoTongNanXingLinHu
YanPing Cao, ZhuoTong Nan, XingLin Hu
1. Institute of Arid Meteorology, China Meteorological Administration, Lanzhou, Gansu 730020, China
2. Cold and Arid Regions Environmental and Engineering Research Institute, Chinese Academy of Sciences, Lanzhou, Gansu 730000, China
3. University of Chinese Academy of Sciences, Beijing 100049, China
4. Hydrology and Water Resources Bureau of Gansu Province, Lanzhou, Gansu 730000, China
An estimation of groundwater storage variations from GRACE gravity satellites in the Heihe River Basin, northwestern China
YanPing Cao1,2,3, ZhuoTong Nan2*, XingLin Hu4
1. Institute of Arid Meteorology, China Meteorological Administration, Lanzhou, Gansu 730020, China
2. Cold and Arid Regions Environmental and Engineering Research Institute, Chinese Academy of Sciences, Lanzhou, Gansu 730000, China
3. University of Chinese Academy of Sciences, Beijing 100049, China
4. Hydrology and Water Resources Bureau of Gansu Province, Lanzhou, Gansu 730000, China
There are only limited surface water resources available in the Heihe River Basin (HRB), a typical inland river basin in the arid region of northwestern China, where groundwater overexploitation is a serious problem. Groundwater has become one of main resources of fresh water in the HRB. In this paper, temporal and spatial variations of groundwater in the HRB are estimated by the Gravity Recovery and Climate Experiment (GRACE) satellites. Our analysis shows that groundwater storage in the HRB reaches its highest in the summer of 2005, and then begins to decline in the following years and reaches steady status in 2008. Spatially, groundwater shows a decline in the upper HRB in the first two years and a slight increase in the following years, while this phenomenon is reversed in the middle HRB where groundwater slightly increases in 2005 and then declines in the following three years. In the lower HRB, GRACE detects a continual increase in the full six-year period. This approach is proven successful when employed in the HRB and thus offers a new insight into monitoring groundwater variations in a river basin with limited or even without any observed data.
GRACE gravity satellites; groundwater; Heihe River Basin; terrestrial water storage
1 Introduction
As a typical inland river basin in the arid region of the northwestern China, the Heihe River Basin (HRB) has unique natural and geographical characteristics and a fragile natural environment. Lacking sufficient water supply, surface water in the basin is unable to meet the water demands (Fenget al., 2001), thus making groundwater a crucial freshwater source. At present, overexploitation of groundwater resources is a serious problem in the HRB. Irrational groundwater use has caused a series of environmental problems (Wanget al., 2005). In order to sustainably exploit and utilize groundwater resources in the HRB, and to serve rapid local social and economic development, it is necessary to understand groundwater dynamics and evaluate its trend of change.
In general, groundwater variations can be recordedby groundwater observation wells. However, there are only a limited number of observation wells in the HRB, and worse, their distribution is uneven. These limitations make it hard to fully monitor groundwater changes in a timely manner in the study area.
The Gravity Recovery and Climate Experiment (GRACE) satellites, launched on March 17, 2002, are the second set of gravity satellites in the world. The GRACE data can be used to recover variations in terrestrial water storage which includes groundwater, soil moisture, surface water, snow water and biosphere water. Previously, a number of studies have confirmed that total terrestrial water storage (TWS) changes derived by GRACE can be compared with those derived from land surface models (Andersenet al., 2005; Schmidtet al., 2006; Syedet al., 2008). GRACE-derived TWS variations can be used to infer variations of water budget components, such as groundwater, soil moisture or snow water. In comparison with the observational approach, the new type of quantitative remote sensing can estimate changes in groundwater at a regional scale. At present, GRACE satellites data have been used in many regions to estimate the groundwater variations. Muskeet and Romanovsky (2011) investigated the groundwater storage changes in Alaskan Permafrost using GRACE satellites data. Sun (2013) predicted the groundwater level changes by downscaling GRACE results. Considering the coarse spatial resolution of GRACE, its data are generally used in a relatively large area. Nevertheless, a study of groundwater storage changes in Illinois, which covers an area of only about 200,000 km2, also presents a successful application of GRACE in a smaller area (Yehet al., 2006). In this study, the variation pattern and amplitude of the estimated result by GRACE coincide with the observed results, indicating that the GRACE-based method can perform well in a river basin with an area of 200,000 km2(Yehet al., 2006). In addition, an application of GRACE in an area of 154,000 km2to measure groundwater depletion rates shows it works in an even smaller river basin (Famigliettiet al., 2011). The applicability of GRACE in monitoring seasonal groundwater storage (GWS) variations in semiarid regions is proven in a case study of High Plains Aquifer of the USA, where large seasonal GWS variations are caused by human activities (Strassberget al., 2007), similar to those in the HRB with respect to physical conditions and human intervened groundwater dynamics.
The primary aim of this paper is to derive temporal and spatial groundwater variations in the HRB from GRACE satellite data during the period from 2003 to 2008. These analyses results will provide valuable theoretical support for rational use of water resources in the HRB.
2 Study area
The Heihe River Basin (HRB, literally black river), shown in figure 1, is the second largest inland river basin in northwestern China. Figure 1 includes two boundaries defined in 2005 and 2010, respectively. The new boundaries are defined jointly by Cold and Arid Regions Environmental and Engineering Research Institute of the Chinese Academy of Sciences (CAREERI/CAS) and the Yellow River Commission, and cover an area of approximate 271,000 km2. It has a characteristic arid continental climate with low precipitation and high evapotranspiration. The HRB is covered by heterogeneous landscapes including snow/ice capped mountains, forest, oasis, farmland, desert, and residential areas (Luoet al., 2012). In the upstream area, the Qilian Mountains are the main natural ecosystem with abundant vegetation. Elevations reach 5,000 m. The midstream area is the most developed region in the HRB, with a large area of irrigated agricultural farmland and residence, however, which has low annual rainfall and high potential evapotranspiration as well. In the downstream area there are the Gobi deserts, other deserts, and the Ejina oasis that is a representative oasis in arid regions. It is short of rain and has strong evaporation.
Groundwater has played vital role in supplying water in the HRB due to deficient surface water, especially for the midstream. Many studies about groundwater have been conducted in the HRB in past years. For example, by using measured records from 53 groundwater wells, a trend analysis of seasonal groundwater table changes in the middle area of the HRB was presented (Chenet al., 2003). Hu and Lan (2009) studied the characteristics of groundwater dynamics in the middle and lower areas and forecasted their expected future trends. The existing studies are based on groundwater site records. Due to very limited and uneven distributed groundwater observation wells (see figure 1) and widespread human activities and irrigations, these studies are insufficient in studying watershed scale groundwater variations.
2.1 GRACE data
This study employs the RL04 version of GRACE data set of 67 months from February 2003 to December 2008, which were published by the Center for Space Research at University of Texas at Austin (CSR). In view of its data inaccuracy, the data in January 2003 and January, July and August 2004 are removed. Degree 2 zonal spherical harmonic coefficients (C20) of GRACE are replaced by those (C20) derived from satellite laser ranging (SLR) estimations as the latter has been confirmed to be more accurate in previous studies (Chen and Wilson, 2008). The monthly gravity anom-alies are then computed by subtracting their temporal mean. In order to reduce noise, the GRACE data are processed by a correlated-error filter (Swenson and Wahr, 2006) and a Fan filter (Zhanget al., 2009). At the scale of a river basin, the leakage signals generally need to be evaluated; therefore basin function (Swenson and Wahr, 2002) is introduced. Consequently more accurate terrestrial water storage (TWS) variations in units of equivalent height of water are obtained.

Figure 1 Location map of HRB and distribution of hydrological and meteorological sites
2.2 Hydrological data
Groundwater variations can be estimated when soil moisture (SM) and snow water equivalent (SWE) variations are known. In this study, because there are no reliable and high resolution SM and SWE data in the HRB, they are acquired from the Global Land Data Assimilation System (GLDAS) Noah data sets whose spatial resolution is 0.25 degree and temporal resolution is one month. In order to produce optimal modeled estimations of land surface states and fluxes in near-real time, GLDAS makes use of the new generation of ground- and space-based observation systems, which can provide data to constrain the modeled land surface states (Rodellet al., 2004). To make GLDAS data match the GRACE estimates, GLDAS SM and SWE are inverted into spherical harmonic coefficients, and are then processed to the same degree and filter smoothing (including that of the de-correlated filter and Fan filter) as GRACE data.
Actual observed groundwater data should be used to verify the GRACE results. However, as in fact there are only few groundwater monitoring sites in the relatively vast HRB downstream area, we can only evaluate GRACE estimation in the upper and middle HRB. Observed groundwater table data of 2003-2008 are provided by Hydrology and Water Resources Bureau of Gansu Province. There are three types of observed data,i.e., data that’s observed daily, data that’s observed over 5 days and data that’s observed over 10 days. As there may be pumping wells built by farms close to monitoring wells, observed groundwater data is carefully examined before use. First, for each well, a record at a given time temporally changing abruptly in comparison with records before and after that time, has been removed. Second, if many measured wells are spatially close to each other, in other words, if they have similar subsurface conditions, the records that are significantly different from the mean groundwater table in this area have been removed. After removing such outliers from these measured groundwater data, the monthly averaged groundwater table in each site can be calculated and then interpolated to other locations via the Kriging method. Monthly groundwater level anomalies are then computed as the differences from their temporal mean. Therefore, the groundwater storage variations in units of equivalent water height in the upper and middle reaches of the HRB can be calculated through monthly groundwater table changes multiplied by roughly estimated average specific yield. Although the specific yield varies with different regions anddepths because of complex geological conditions in the up- and mid- reaches, an average specific yield of 0.15 for both upper and middle reaches is taken according to consultations from multiple experts.
The total terrestrial water storage changes in the HRB are related to precipitation (P) and air temperature (T). In this study, variations of P and T are used to evaluate GRACE-estimated TWS variations. P and T changes in the study period (January 2003 to December 2008) are calculated from 24 weather station sites and 24 hydrological station sites within or nearby the HRB (Figure 1) and are then interpolated to obtain watershed-scale data. In order to consider effects of complex terrain conditions in the HRB, this study makes use of MicroMet (Liston and Elder, 2006). MicroMet is an intermediate-complexity, quasi-physically based, meteorological model that was developed to produce high-resolution meteorological data. MicroMet uses the Barnes objective analysis scheme to spatially interpolate variables and then corrects them using the relationships between variables and topography. In this study, based on the SRTM 5-km Digital Elevation Database (DEM), P and T were interpolated to a grid size of 5km×5km. To make P and T comparable with GRACE-derived TWS variations, both data were processed with the same workflow as GRACE data, inverting into spherical harmonic coefficients and reprocessing through the de-correlation filter and the Fan filter.
3 Method
3.1 Estimation of total basin water storage variation
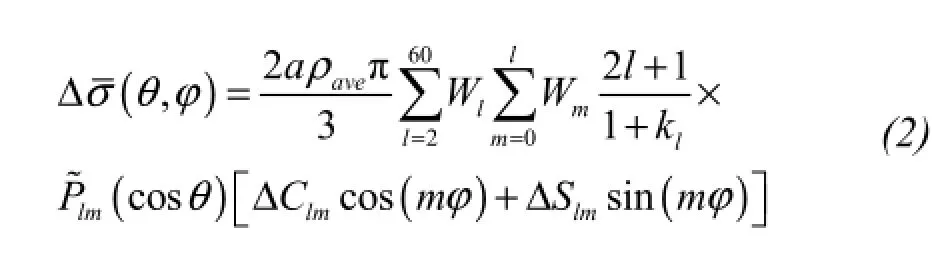
GRACE is able to estimate the Earth’s gravity field variations, which are caused by the redistribution of mass within the Earth and on or above its surface (to about 10 km deep). Over land, the mass variations are mainly attributed to variations in terrestrial water storage. Hence GRACE data, as represented spherical harmonic coefficients, can be used to infer temporal variations of TWS. The surface density variation can be represented in terms of changes, namely ΔClmand ΔSlm, in the spherical harmonic geoid coefficient (Wahret al., 1998) as,

whereais Earth’s equatorial radius (6,378,136.3 m),ρaveis the average density of Earth (5,517 kg/m3), andθandφare the Earth’s colatitude and longitude, respectively.landmare the degree and order of each harmonic coefficient respectively. ΔClmand ΔSlmare the variations of the geoid harmonic coefficients derived from GRACE data.Plmis the normalized associated Legendre function.kl, known as the Love numbers representing the effects of the Earth’s response to surface loads, are computed using a reference Earth model, and can be obtained from Wahret al.(1998). There are measurement errors in the GRACE data that become larger along with increase of the degreel. Thus the spherical harmonics coefficients have to be truncated at a certain degree and order, however this brings truncation errors. In order to reduce errors and improve precision, this paper adopts the Fan filter (Zhanget al., 2009) formulated as
in whichWlandWmare weights of the Fan filter. They are both Gaussian filters adopted forland alongmrespectively in this study, and both can be calculated recursively by the following equations (Wahret al., 1998).
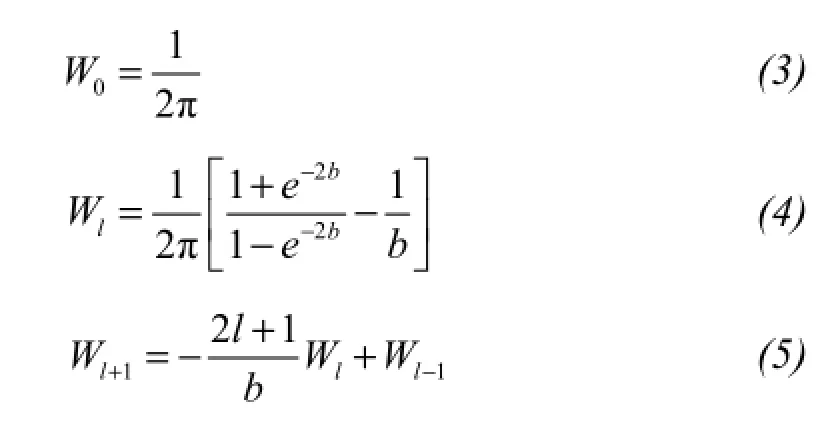
In equation(5), the parameterbis obtained by equation(6).

The parameterrin equation(6)is the mean radius of the Gaussian averaging filter. However the two filters have different weights here. The spatial resolution of GRACE is constrained by the satellites themselves and related to degree of the harmonic coefficients. When the degree is 60, the spatial resolution can be up to 300 km (Wahret al., 2004). Due to the low signal-to-noise ratio, we cannot use higher degree coefficients. As recommended, this work truncates the degree and order to 60. In order to improve the accuracy, a basin function is used when inferring time-variable changes in mass of arbitrary regions. The basin function is purposefully created to avoid signal leakage, and to isolates the gravity signal from those of nearby regions while simultaneously minimizing the effects of GRACE observational errors and contamination from surrounding hydrological signals(Swenson and Wahr, 2002). Subsequently a more accurate estimation of TWS variations can be obtained in units of equivalent height of water.
Basin functionϑ(θ,φ) describes the shape of a basin.

Assuming a constant basin function, namely not changing with time, the basin functionϑ(θ,φ) can be expressed by a sum of spherical harmonic coefficients as

whereandare spherical harmonic coefficients.
Surface mass variations averaged over an arbitrary region are represented as
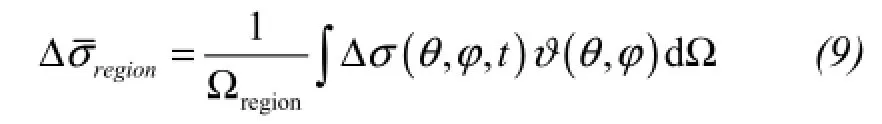
in which Ωregionis the angular area of the region of study, and

whereSregionis the area of watershed, andais Earth’s radius.
Thus a mass anomaly in the basin at any timetcan be calculated by the function,
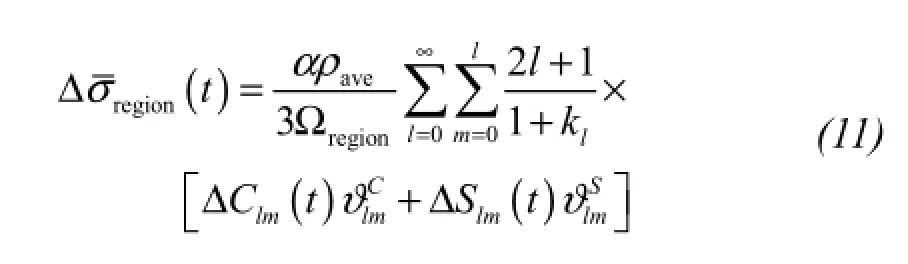
The atmospheric pressure, submarine pressure and tidal effects are already removed from the published GRACE data by the GRACE data center. The results calculated by the equation(11)are the changes in vertically integrated water storage averaged over a region. It can be converted to an equivalent water height by the equation,

where Δhdenotes equivalent water height andρwis the water density (1,000 kg/m3).
3.2 Estimation of groundwater storage variations
Terrestrial water storage (TWS) variations can be vertically divided into variations from groundwater, soil moisture, snow/ice, surface water and biological water variations, among which surface water and biological water variations can generally be ignored. If soil moisture (SM) and snow water equivalent (SWE) variations are known, groundwater (GW) variations can be estimated by the following equation:

in which the symbol Δ refers to variation.SMandSWEare both provided by GLDAS-NOAH.SMandSWEvariations can be computed by subtracting their means of the study region over six years from monthly data.
4 Validations
Before analyzing GRACE-derived groundwater variations in the HRB, it is necessary to validate its applicability. Two methods are adopted in this paper. First, the available groundwater observational wells in the upper and middle HRB were used to validate GRACE-derived groundwater variations. Second, the relationships between precipitation, temperature records in the HRB and the total TWS variations were examined, as in arid region precipitation changes are the primary force causing TWS variations and the temperature may affect snow/ice melt, ET and TWS. Significant agreements in both aspects will support the applicability of GRACE in estimating groundwater variations in the HRB.
4.1 Groundwater storage variations in the upper and middle reaches
GW changes in the upper and middle reaches of the HRB are based on GRACE-derived TWS variations and GLDAS-derived SM and SWE. Figure 2 shows seasonal GW variations of GRACE-derived and measured in the upper and middle HRB during 2003-2008. Here it should be explained that the seasonal GW variations were obtained by averaging monthly variations over 3-month periods (spring: March-May, summer: June-August, fall: September-November, winter: December-next February). Both linear trend lines present a consistent downward tendency while their peaks roughly appeared in the same seasons. The correlation coefficient is 0.62 (p<0.01) between the derived and measured GW variations, while their standard derivations are 8.70 mm and 9.38 mm, respectively. Nevertheless the measured GW variations proceed downwards faster than GRACE-derived and peaks value and phases do not exactly agree with each other. This inconsistency might be caused by the low spatial resolution of GRACE data and by possible insufficient representativeness of GW measurement sites.

Figure 2 Seasonal changes of groundwater estimated by GRACE in the upper and middle reach areas of HRB in comparison with measured changes
Unlike seasonal changes, interannual GW variations from GRACE-derived and measured data are in a very high correlation, with a correlation coefficient of up to 0.93 (p<0.01). As shown in figure 3, the groundwater storage in the upper and middle HRB kept increasing from 2003 to 2004. In 2005, although the groundwater storage still kept rising relative to the average, its increment lessened. From 2006 on, the groundwater storage seemed to be in a deceasing trend.
Athough there is a sufficient agreement between derived and measured GW variations; a substantial difference still exists in 2005 in terms of both amount and trend. Such a difference can be explained from three aspects. First, the total area of upper and middle reaches is relatively smaller in comparison with its coarse spatial resolution of GRACE. Second, the measured GW variations that are calculated from point sites via the Kriging interpolation probably cannot reveal real groundwater variations, in particular when the groundwater monitoring wells in the HRB are unevenly distributed. The observations sometimes are not reliable because external circumstances and human activities such as irrigation may notably affect observation quality. Third, in our calculation only SM variations in the top layer 2 m deep are subtracted from the derived TWS variations, while the deeper layers are assumed stable in water moisture content; hence such an assumption might bring inaccuracy into the estimation.
Apart from those explanations, in 2005 the HRB began enforcing a water transfer scheme, by which water is discharged to the lower reaches in order to meet ecological demands in the lower HRB. Due to water transfer enforcement, surface water in the upper and middle HRB was reduced significantly in 2005, and such changes might be captured by GRACE, while the phenomenon was not reflected by measured records of groundwater.

Figure 3 Interannual changes of groundwater in upper and middle HRB estimated by GRACE in comparison with measured GW
4.2 Total terrestrial water storage variations

where ΔSdenotes total terrestrial water storage variations in the HRB. P and Q are incoming components to the watershed and ET, R and W are outflowing components. In terms of contribution to TWS variations, glacier/snow melt water in the HRB is much smaller than precipitation, so that it is neglected in this study. By contrast, precipitation plays a leading role in the total TWS variations in an arid river basin. As depicted in figure 4, seasonal variations of precipitation, air temperature and GRACE-derived TWS variations present consistent trends and similar change characteristics. Here the variations of precipitation were calculated by removing the average seasonal value.
TWS variations are in the range of −17 to 22 mm and present distinct seasonal characteristics. In that the GRACE data of the June 2003, July 2004 and August 2004 were removed during preprocessing, TWS variations in the summers of 2003 and 2004 are less than the expected level. However, by examining the period of 2005 to 2008, it is found that TWS variations are consistently highest in summers and lowest in winters. Those seasonal characteristics are in close relation with precipitation because the latter is the primary water source in the HRB. In summer, elevated precipitation causes TWS increases. Such a positive relationship is verified by the similar changes between precipitationand TWS during 2005-2008 as depicted in figure 4. In March to May,i.e., spring in the HRB, TWS decreases remarkably because of agricultural irrigation. The relationship between temperature and TWS is not as direct as that with precipitation. In the upper and middle HRB, where temperature impacts glacier/snow melt in the upper HRB, high temperature results in more evapotranspiration if there is sufficient water. However, figure 4 shows similar time series changes in temperature during 2005-2008. It can be inferred that at least in 2005-2008, precipitation dominates the pattern of TWS changes in HRB.

Figure 4 Seasonal changes of total TWS estimated by GRACE in the entire HRB
5 Results and discussion
5.1 Temporal variations of groundwater storage
Constrained by availability of observational groundwater data in the HRB, it is impossible to conduct a comprehensive applicability analysis for the GRACE derivation of groundwater variations. A simple validation in the upper and middle HRB can firmly suggest it is applicable to be used in the entire HRB. In view of the coarse spatial resolution of GRACE, its application to a large area such as the entire HRB will be more suitable.
Figure 5 displays seasonal variability of the GW variations and the TWS, SM, SWE variations from 2003 to 2008 in the whole HRB. The GRACE-derived GW variations are strongly correlated with the GRACE-derived TWS variations with a correlation coefficient of up to 0.93 (p<0.01). It could be inferred that GW is the principal contributor to the TWS changes. The SM and SWE variations are both negligible. Similar to TWS variations, groundwater storage is also greatly influenced by precipitation. More precipitation in the summer will recharge groundwater so that watershed GW increases. In addition to precipitation, glacier melt water also recharges the groundwater although with a limited amount. In autumns and winters, both rainfall and snowfall supplies are limited, while GW is heavily withdrawn for irrigating crops like wheat. This makes GW storage drop to the lowest recorded as illustrated in figure 5. Therefor GW in the HRB shows significant cyclical seasonal changes.

Figure 5 Seasonal changes of groundwater estimated by GRACE in the entire HRB
Figure 6 shows interannual variability of the GRACE-derived GW from 2003 to 2008 in the whole HRB. At an interannual scale, GRACE GW variations are also in close accordance with TWS variations (the blue dashed line in figure 6). In figure 6, solid line represents the GRACE-derived GW variations in the HRB. Overall, groundwater levels of the HRB between 2003 and 2008 showed an increasing trend. The groundwater level declined with diminishing amplitude from 2003 to 2004. In middle of 2004, the groundwater storage exceeded the 6 year average. In the summer of 2005, the groundwater quantity reached its highest peak, and since then the increasing magnitude began to lessen and finally reach a balanced state in 2008. Groundwater storage is apparently not influenced by precipitation. Abundant precipitation in 2007 didn’t adequately recharge the groundwater. This is because groundwater storage in the HRB is highly influenced by human activities (e.g., irrigation), especially in recent years.
In recent years, in order to allocate sufficient water to the HRB downstream area to maintain a sustainable ecological water use, a number of water conservation measurements have been adopted in the midstream areas, where there is large population and most of the water is used for agriculture and industry. With the benefit of these water allocation policies, water stress in the lower reaches has been alleviated to some extent. The study by Hu and Lan (2009) reported that since the implementation of the water transfer scheme from the midstream to downstream beginning in 2000, the groundwater level rose in the downstream areas by10% in water resources by the year of 2005. In addition, a decrease in groundwater level and amount were observed in sites of the middle reaches because more water has flown into downstream area via the Zhengyixia site, which is the inlet of the downstream reaches. Hu and Lan (2009) also predicted that, on basis of past observational records, in the coming years of 2006-2008 water resources in the middle reaches would decline. Our analysis as shown in figure 6 appears to be consistent with their studies. Other evidence arises from precipitation variations. Since 2000, precipitation in the upstream reaches has presented an unmistakably ascending trend, a trend which is also seen for glacier runoff and its supply rate. At the same time, glaciers have recessed by about 10% in the center and western parts of the upper HRB during the period of 2003 to 2007 (Niuet al., 2010). Both inflows of increasing precipitation and glacier melt water have made the GW in the entire watershed rise in those years as presented by figure 6. The groundwater variations during 2003 and 2008 were consistent with the study results obtained by other researchers.
然而本文的主要目的,不只是抒发以上自己阅读了微小说《等》之后的感慨,而是想着重赏析一下它的表现形式与表达技巧,因为这能有效地帮助或启发更多的微小说创作者去进行更好的文学创作。为什么要这样做呢?因为表现形式与表达技巧都是为作品内容和作品主题服务的。新颖的表现形式和贴切的表达技巧,一定会增强文学作品的阅读吸引力和艺术感染力。下面就分别对微小说《等》的新颖的表现形式与贴切的表达技巧进行赏析。

Figure 6 Interannual changes of groundwater estimated by GRACE in the entire HRB
5.2 Spatial variations of groundwater storage
The groundwater distribution in the HRB is to some extent affected by geological structure and natural factors like climatic conditions so that there would be a strong spatial correlation between groundwater level and natural settings. However, human activities weaken this relationship. Note that in figure 7, different colors represent groundwater variations instead of actual groundwater amounts in units of equivalent water height. This represents the variation relative to the average of each grid during the 6 years studied.
By and large, the groundwater resources in the HRB tend to increase, although with different amplitudes, in different regions from 2003 to 2008. However, the groundwater is still characterized by notable local variability in partial areas.
In the upstream region, which is the water source area for the whole watershed, groundwater storage seems to drop in the period from 2003 to 2004. In 2005, it rises higher than the average level over 6 years. In 2005 and 2006, groundwater storage presents a slightly descending trend, and then from 2006 to 2008, it begins ascending, higher than average. Precipitation and glacial melt water are the main source flowing into the upstream area. As revealed by meteorological and hydrological stations in the upstream region, there was more precipitation in 2007-2008. This has brought increased water supplies to groundwater in the upstream area. In addition, increasing glacier melt water may contribute partially to the increase of groundwater upstream.
In the middle HRB, where the region is mainly occupied by agricultural irrigation land, there are frequent interactions between surface water and groundwater due to intensive human activities such as irrigation. The groundwater resources in that area keep descending from 2003 to 2004, followed by a slight rebound in 2005, and then they decline again in next three years. A notable decrease in groundwater can be found in the Minle and Gaotai basins over the entire 6 years. The spatial and temporal variations detected by GRACE are in agreement with the study of Hu and Lan (2009). They reported the characteristics and trends of groundwater variation in the middle and lower reaches since 1980 based on groundwater monitoring wells, and concluded that groundwater resources in the middle HRB dropped significantly during the period of 1980 to 2005. We also confirm this decrement trend by using 52 GW wells in the Zhangye, Gaotai and Linze basins with records from 2005 to 2008.
Figure 7 also shows that the groundwater table rises more or less in most areas in the downstream region during the 6 years studied. However, the groundwater table went down slightly in 2003 and 2004, and then reached a stable state from 2005 to 2007. In 2008 there seemed to be a significant rise in groundwater storage. According to the ecological assessment report conducted by Luet al. (2012), after a number of years of water transfer enforcement, the water stress situation in the lower of the HRB was mitigated, and GW table began to rise again after a few years. The ecological effects of remedial measures can be observed by the mitigation of desertification and salinification, and the extension of oasis andPopulous diversifoliaareas. We also analyzed GW burial depth data from 12 observation wells in the downstream region (see figure 1). These observation wells are distributed along the watercourse in the downstream area of the HRB. Some groundwater observation wells are located near the river. Due to the continuous exchange of water between the groundwater and the river, the groundwater level re-peatedly rose and declined. On the other hand, for observation wells which are far away from the river and located in the desert, the groundwater level is not recharged by the river. The change rates of GW burial depth of observation wells located in the HRB downstream region in the period of 2003 to 2008 are described in table 1. The records of nine monitoring sites displayed the recovery of the groundwater level during the six years studied, while the remaining three groundwater monitoring sites showed a decline. In recent years, because a large amount of water flows into the downstream areas of the HRB, the surface runoff and groundwater resources are recharged. However, groundwater in some regions is not recharged by precipitation or surface runoff. The groundwater levels of these regions are declining due to two factors: Firstly, the vegetation in these regions draws on groundwater to survive; Secondly, evapotranspiration causes the excretion of groundwater resources into the air. It is clear that the groundwater resources monitored in the lower HRB are in a state of restoration from 2003 to 2008, which is consistent with our GRACE-based conclusion. The inlet site, Zhengyixia, accordingly, shows an increasing surface runoff supplies to the downstream areas, a result of the implementation the water transfer scheme over many years which has consequent and positive impacts to GW in the lower HRB. However, the causes of GW table increases in the lower HRB are complex because of terrains which are themselves complex, because of inherent spatial and temporal variability of groundwater induced by land use changes, and due to frequent human activities occuring in the whole watershed. The GRACE-based approach is able to detect changes in the GW, but does not lead to easily explained reasons for these changes, which may necessitate the use of an integrated model that couples the surface hydrological model with the groundwater dynamics model.

Table 1 Change rates of groundwater burial depth from monitoring wells in the downstream area of HRB (in unit mm/month)
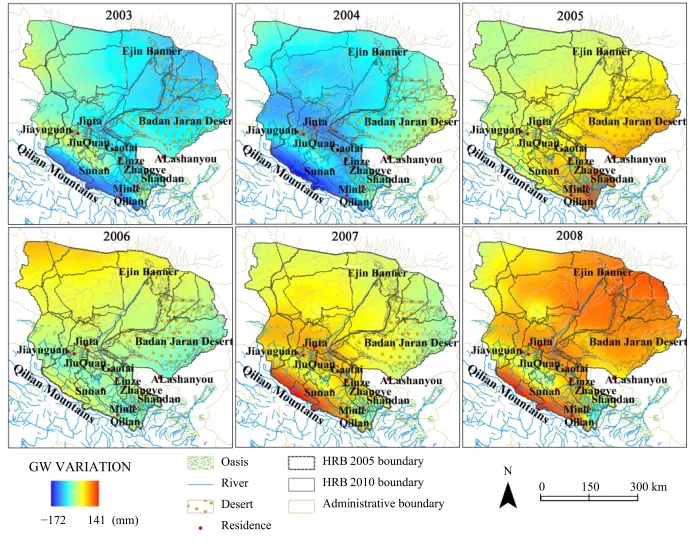
Figure 7 Spatial variability of groundwater in HRB during 2003-2008
6 Summary
This paper estimates groundwater variations in an arid inland river basin by using gravity satellite data. In that there are limited GW wells in the downstream region, we validated the GRACE derived GW variations in the upper and middle reaches that have relatively numerous monitoring wells. The validation reveals a strong agreement between GRACE-derived and measured GW level, indicating this approach is applicable to the inland HRB. According to the preliminary results, GW storage in the HRB reaches its highest peak in the summer of 2005, and then begins to drop and stop increasing in 2008. Spatially, in the upper HRB, the groundwater level shows a decline in first two years and slight increase in the following years, which is opposite to that in the middle HRB, where groundwater levels increase slightly in 2005 and then decline in following three years. In the lower HRB, GRACE detects a continual increase in the full six years of the study which is consistent with other studies that are based on GW wells and confirms the positive effects of the enforced water transfer scheme in the HRB.
Auxiliary hydrological data such as SM and SWE are needed for the GRACE approach, and can affect accuracy of GW variation estimates. Therefore, more reliable soil moisture data and snow water equivalent data are needed for improving estimation accuracy.
This study offers a new and effective way to monitor GW changes, especially in data-sparse or ungauged areas. However, there are certain issues that should be resolved. First, the GRACE data accuracy should be improved, so that it could be more widely applied. Following this, the GRACE-based results should be further verified and evaluated quantitatively.
Despite the weakness of coarse spatial resolution, the GRACE-based approach appears helpful and promising, especially in western China, where there is generally a shortage of observations. Therefore, more research efforts on this method should be pursued.
Acknowledgments:
This study was financially supported by NSFC/China (No. 91125006), IAM grant (No. IAM201215) and partially by State Key Laboratory funding (No. SKLFSE201009).
Andersen OB, Seneviratne SI, Hinderer J,et al., 2005. GRACE-derived terrestrial water storage depletion associated with the 2003 European heat wave. Geophysical Research Letters, 32(18): L18405.
Chen JL, Wilson CR, 2008. Low degree gravity changes from GRACE, Earth rotation, geophysical models, and satellite laser ranging. Journal of Geophysical Research, 113: B06402.
Chen RS, Kang ES, Yang JP,et al., 2003. Seasonal groundwater level variance in midstream of Heihe mainstream basin. Journal of Arid Land Resources & Environment, 5(17): 36-43.
Famiglietti JS, Lo M, Ho SL,et al., 2011. Satellites measure recent rates of groundwater depletion in California's Central Valley. Geophysical Research Letters, 38: L03403.
Feng Q, Cheng GD, Endo KN, 2001. Towards sustainable development of the environmentally degraded River Heihe basin, China. Hydrological Sciences Journal, 46(5): 647-658.
Hu XL, Lan YC, 2009. Study on change characteristic and evolutionary trend of groundwater resources of the middle and lower Heihe river basin since 1980. Ground Water, 31(6): 1-4.
Hu XL, Lu L, 2009. Spatio-temporal variability of groundwater level in the middle Heihe river basin. Journal of Desert Research, 4(29): 777-784.
Liston GE, Elder K, 2006. A meteorological distribution system for high-resolution terrestrial modeling (MicroMet). Journal of Hydrometeorology, 7(2): 217-234.
Lu ZY, Tang DS, Zheng B,et al., 2012. Post-evaluation of the ecological and environmental impact of water diversion project in the low reaches of Heihe river. Acta Scientiae Circumstantiae, 31(7): 1556-1561.
Luo XP, Wang KL, Jiang H,et al., 2012. Estimation of land surface evapotranspiration over the Heihe River basin based on the revised three-temperature model. Hydrological Processes, 26(8): 1263-1269.
Muskett RR, Romanovsky VE, 2011. Alaskan permafrost groundwater storage changes derived from GRACE and ground measurements. Remote Sensing, 3(2): 378-397.
Niu ZR, Zhao WZ, Chen XL,et al., 2010. Study of the water resources characteristics in the mid-west sub-water systems of the Heihe river. Journal of Glaciology and Geocryology, 32(6): 1194-1201.
Rodell M, Houser PR, Jambor U,et al., 2004. The global land data assimilation system. Bulletin of the American Meteorological Society, 85: 381-394.
Schmidt R, Schwintzer P, Flechtner F,et al., 2006. GRACE observations of changes in continental water storage. Global and Planetary Change, 50(1): 112-126.
Strassberg G, Scanlon BR, Rodell M, 2007. Comparison of seasonal terrestrial water storage variations from GRACE with groundwater-level measurements from the High Plains Aquifer (USA). Geophysical Research Letters, 34(14): L14402.
Sun AY, 2013. Predicting groundwater level changes using GRACE data. Water Resources Research, 49(9): 5900-5912.
Swenson S, Wahr J, 2002. Methods for inferring regional surfacemass anomalies from Gravity Recovery and Climate Experiment (GRACE) measurements of time-variable gravity. Journal of Geophysical Research, 107(B9): 2193.
Swenson S, Wahr J, 2006. Post-processing removal of correlated errors in GRACE data. Geophysical Research Letters, 33(8): L08402.
Syed TH, Famiglietti JS, Rodell M,et al., 2008. Analysis of terrestrial water storage changes from GRACE and GLDAS. Water Resources Research, 44(2): W02433.
Wahr J, Molenaar M, Bryan F, 1998. Time variability of the Earth's gravity field: Hydrological and oceanic effects and their possible detection using GRACE. Journal of Geophysical Research: Solid Earth, 103(B12): 30205-30229.
Wahr J, Swenson S, Zlotnicki V,et al., 2004. Time-variable gravity from GRACE: First results. Geophysical Research Letters, 31: L11501.
Wang GX, Yang LY, Chen L,et al., 2005. Impacts of land use changes on groundwater resources in the Heihe River Basin. Journal of Geographical Sciences, 15(4): 405-414.
Yeh PJF, Swenson SC, Famiglietti JS,et al., 2006. Remote sensing of groundwater storage changes in Illinois using the Gravity Recovery and Climate Experiment (GRACE). Water Resources Research, 42: W12203.
Zhang ZZ, Chao BF, Lu Y,et al., 2009. An effective filtering for GRACE time-variable gravity: Fan filter. Geophysical Research Letters, 36(17): L17311.
: Cao YP, Nan ZT, Hu XL, 2014. An estimation of groundwater storage variations from GRACE gravity satellites in the Heihe River Basin, northwestern China. Sciences in Cold and Arid Regions, 6(6): 0577-0586.
10.3724/SP.J.1226.2014.00577.
Received: April 23, 2014 Accepted: June 19, 2014
*Correspondence to: Dr. ZhuoTong Nan, Professor of Cold and Arid Regions Environmental and Engineering Research Institute, Chinese Academy of Sciences. No. 320, West Donggang Road, Lanzhou, Gansu 730000, China. Tel: +86-931-4967236; E-mail: nztong@lzb.ac.cn
猜你喜欢
阿来研究(2021年2期)2022-01-18 05:35:30
阿来研究(2021年1期)2021-07-31 07:38:26
考试与评价·高二版(2020年5期)2020-09-10 07:22:44
心声歌刊(2019年6期)2020-01-18 09:16:56
故事作文·低年级(2019年4期)2019-04-17 18:51:26
故事作文·低年级(2019年4期)2019-04-17 18:51:26
当代作家(2018年11期)2018-11-27 05:00:00
时代英语·高一(2017年5期)2017-11-14 17:00:51
湖南工业职业技术学院学报(2016年6期)2016-04-17 06:44:28
新闻传播(2015年19期)2015-07-18 11:03:26
 Sciences in Cold and Arid Regions2014年6期
- Sciences in Cold and Arid Regions的其它文章
- A discussion on improving typhoon observation through radar by scanning the negative elevation angle
- The effects of the identity of shrub species on the distribution and diversity of ground arthropods in a sandy desert ecosystem of northwestern China
- An analysis on ecological civilization construction in Gansu based on a quantified SWOT framework
- The effects of the identity of shrub species on the distribution and diversity of ground arthropods in a sandy desert ecosystem of northwestern China
- Study on dynamic changes of land desertification in the circum-lake zone of the Qinghai Lake in the past 30 years supported by Remote Sensing and Geographical Information System
- Impacts of reduced wind speed on physiology and ecosystem carbon flux of a semi-arid steppe ecosystem