Simulation and experimental research on line throwing rocket with flight
Wen-bin GU,Ming LU,b,*,Jin-qing LIU,Qin-xing DONG,Zhen-xiong WANG,Jing-hi CHEN
aCollege of Field Engineering,PLA University of Science and Technology,Nanjing,China
bWuhan Ordnance N.C.O School,Wuhan,China
1.Introduction
Currently,the effective way is to transport the emergency supplies,equipment and personnel to the other side by helicopters[1,2]and form an air bridge by thrown rope[3-5]in disaster emergency rescue operations when roads and bridges are heavily damaged.However,sometimes the rescue operation is influenced by weather and turbulence in the mountains and canyons,so helicopter cannot be used for transportation.Limited helicopter rescue is difficult to meet the demand of large-scale rescue;while the throwing range of line throwing rescue equipment at home and abroad is short,and its impact point deviation is large,which has no ability to ferry personnel and goods across.Therefore,these ways cannot form longdistance air bridge and ferry personnel and goods across in disaster emergency rescue operations when serious natural disasters,such as earthquake and floods,occurred.A precision-guided line throwing rocket studied in this paper overcome these shortcomings.It can send the rope to the other side quickly and accurately in complex geographical conditions so that an air bridge is formed in a short time.At present,the research on the complex flight dynamics of rocket with rope is less.According to Kane’s method[6-11],a finite segment model[12,13]for rope of line throwing rocket was used in this paper,then the flying process was simulated and experimented.
2.Dynamic modeling of line throwing rocket
2.1.Assumption
Exactly speaking,the motion of line throwing rocket is three-dimensional,and the rope is a continuous system.Only three-dimensional,continuous model can describe the motion of line throwing rocket completely and accurately.But it is quite difficult to simplify the motion of line throwing rocket,and reveal the basic rules and characteristics of the motion of line throwing rocket.Here,the following assumptions are made:the sideslip angle of rocket is 0,the motions of rocket and rope are in a plumb plane with flight direction,and the weather conditions are standard without wind and rain.The rope is divided into a number of discrete segments[14-19],and the elongation and bending of rope in the axial direction are not considered.The advantages of the discrete model are that the computer programming is easy,and the numerical solution and large-scale differential equations are easy to be deal with.
The coordinate system shown in Fig.1 is an inertial coordinate system.The launch point is defined as the origin of coordinates.X axis is along the rocket flight direction and is locally parallel to the ‘ground’.Y axis is vertical to the‘ground’.
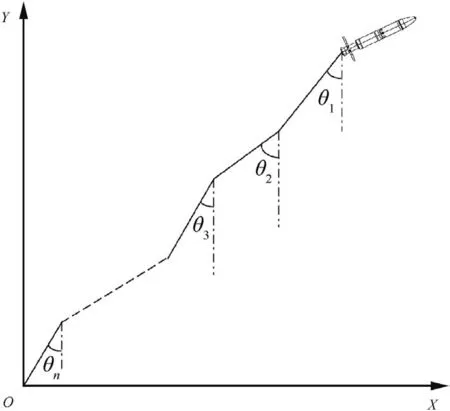
Fig.1.Simplified model.
The whole system is located in the XOY plane,and is in a planar motion.The rocket is simplified as a mass point,and the rope is divided into n arbitrary segments in accordance with the finite segment method,wherein the length of each segments is liand the last segment is variable-length and variable-mass segment.The labels from the rocket pulled segment to the ground segment are 1,2,3,.,n.It is assumed that the mass of each rope segment mainly distributes on end of the segment further from the rocket and the different sections are connected by hinges without considerations on the elongation and bending of rope in the axial direction.When the rope is pulled out and the length of the last segment is changed till it fits the setting condition,a new rope segment n+1 will be pulled out.
2.2.Kinematics analysis
2.2.1.Position analysis
Assuming that the position of rocket in the inertial frame at time t is[x0(t),y0(t)]′,and the angle between the ith rope segment and Y axis is θi(t).The rocket position[x0(t),y0(t)]′,and the angle between each line segment and Y axis θi(t),are defined as the generalized coordinates.There are totally n+2 generalized coordinates.Then the position of each rope segment is

2.2.2.Velocity analysis
The velocity is produced by derivation of the position of the rocket and each rope segment.If)=ωi(t),the velocity of rocket isand the velocity of the intensive mass point on each rope segment is

2.2.3.Partial velocity analysis
The partial velocity of each rope segment can be obtained from the generalized velocity
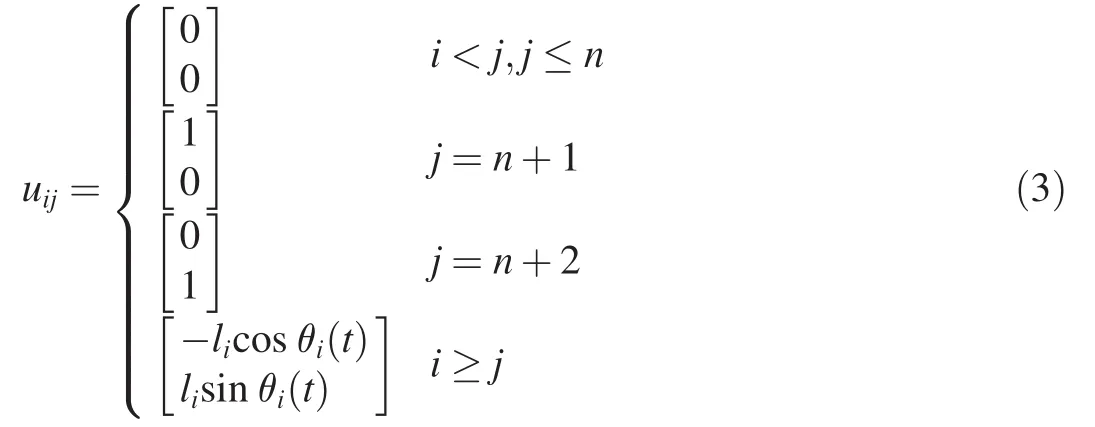
The derivation of the partial velocity is shown below:

2.2.4.Acceleration analysis
The acceleration can be produced by the derivation of velocity of the rocket and each rope segment,and the accelerations of rocket and each rope segment are

2.3.Dynamic analysis
Assuming that the active force acting on rocket and each rope segment is fzi,i=0,1,2,...,n,and the matrix formulation is fz.
2.3.1.Generalized active force
According to the Kane’s method,the generalized active force of the jth generalized coordinates is

The generalized active force of the whole system is

2.3.2.Generalized inertial force Fl*
According to the Kane’s method,the generalized inertial force of the jth generalized coordinates is

The generalized inertial force of the whole system is

2.4.Dynamics equation
According to the Kane’s equation

Putting Eq.(9)into Eq.(10),we have:

By transposition,

Eq.(12)can be rewritten as

where A=u′Mu,fl=Fl-
Eq.(13)includes n+2 equations and totally n+2 variables.The kinematic parameters of rocket and rope sections can be obtained.
2.5.Calculation program
The calculation program is shown in Fig.2.
3.Comparison of simulation results and experiment results
A rocket is taken for example,where the length,diameter and total weight of rocket are 1 m,122 mm and 20 kg,respectively,the gunpowder weight is 2.33 kg,the total impulse of rocket is 4770 N s,the working time of engine is 0.43 s,the linear density of rope is 0.043 kg/m,each rope section is taken as 1 m,and the emission angles are 30°and 40°.The simulation and experimental conditions are no wind and no rain.The simulation and experimental results are compared.The test setup is shown in Fig.3.
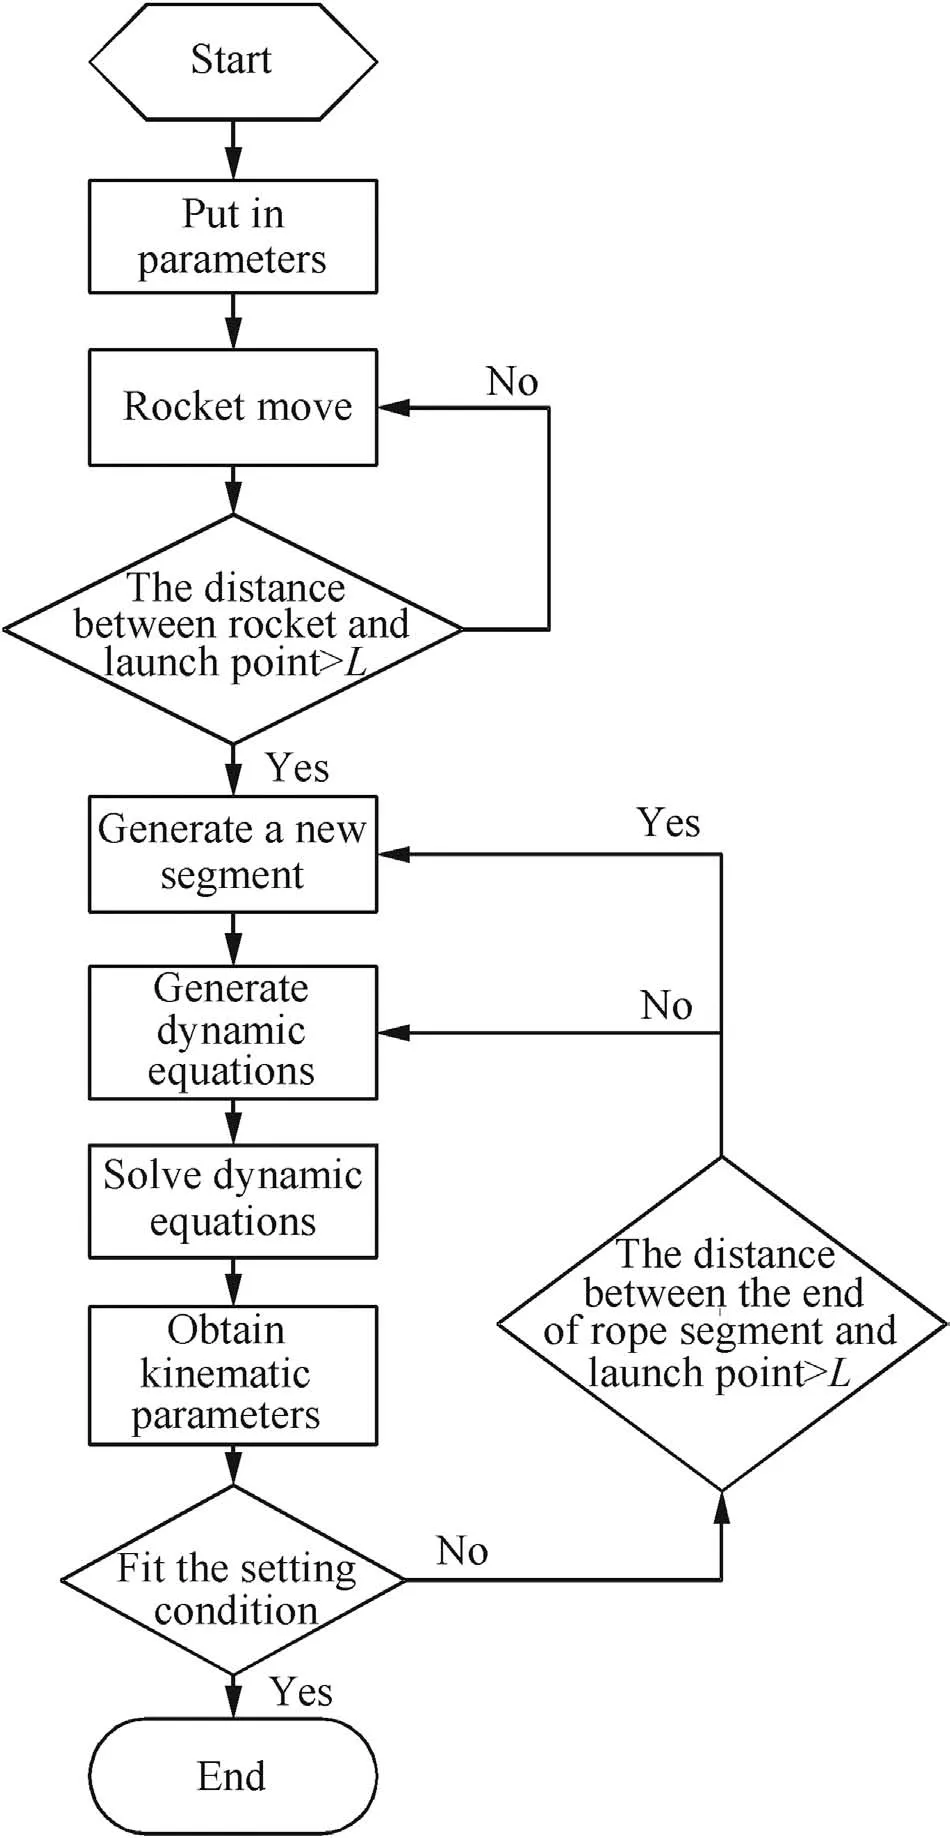
Fig.2.Flow chart of calculation.
Data comparisons of simulation results and experimental results can be seen in Tables 1 and 2.The range,maximum velocity,and flight time obtained by simulation and test at the launch angle of 30°are listed in Table 1.It can be seen from Table 1 that the range measured in simulation experiment is 7.2 larger than the test data,and the relative error is 1.13%;the maximum velocity in simulation calculation is 7.1 larger than the measured test data,and the relative error is 3.4%;the flight time in simulation is 0.5 less than the test data.
The range,maximum velocity and flight time obtained by simulation and test at the launch angle of 40°are listed in Table 2.It can be seen from Table 2 that the range in simulation is 10.1 larger than the test data,the relative error is 1.6%;the maximum velocity in simulation calculation is 7.2 larger than the measured test data,and the relative error is 3.5%;the flight time in simulation is 0.6 less than the test data.By comparing Table 2 with Table 1,we can find that,when the launch angle is changed to 40°,the range and the maximum velocity all get smaller,and the flight time get longer.
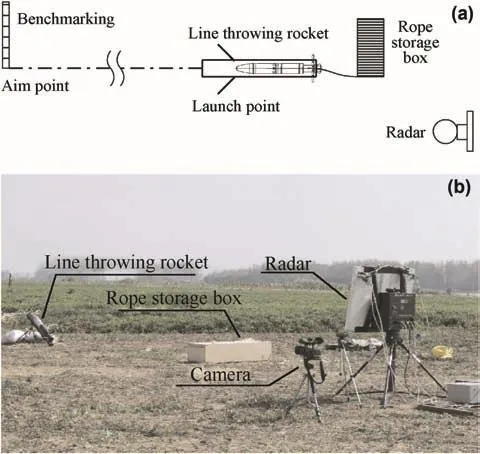
Fig.3.Set of the experiment.(a)Schematic diagram of setup.(b)Set of experiment.

Table 1Comparison of simulation and experimental results at launch angle of 30°.

Table 2Comparison of simulation and experimental results at launch angle of 40°.
The velocities of rocket measured by radar and obtained by simulation at the launch angle of 30°are shown in Fig.4.It can be seen from Fig.4 that the maximum velocity measured in the test is 199.5 m/s,the calculated maximum velocity is 206.6 m/s after the engine stopped work;at 1 s,2 s,3 s and 4 s,the test velocities are 154.3 m/s,99.3 m/s,73.8 m/s and 60.5 m/s,and the calculated velocities are 158.7 m/s,98.9 m/s,70.3 m/s and 58.5 m/s.The absolute errors are 2.8%,0.4%,5.0%and 3.4%with the average value of 2.9%.
The velocities of rocket measured by radar and obtained by simulation at the launch angle of 40°are shown in Fig.5.It can bee seen from Fig.5 that the maximum velocity measured by the test is 198.9 m/s,the calculated maximum velocity is 206.1 m/s after the engine stopped work;at 1 s,2 s,3 s and 4 s,the test velocities are 151.3 m/s,103.2 m/s,76.1 m/s and 58.1 m/s,and the calculated velocities are 159.9 m/s,100.5 m/s,71.4 m/s and 59.4 m/s.The absolute errors are 5.4%,2.7%,6.6%and 2.2%with the average value of 4.2%.
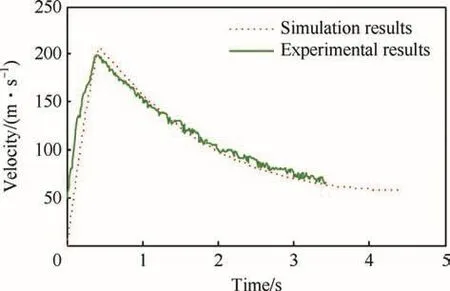
Fig.4.Curves of simulation and experimental velocities at launch angle of 30°.
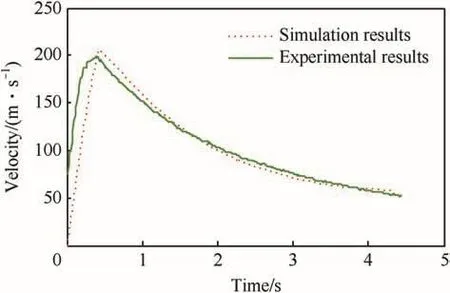
Fig.5.Curves of Simulation and experiment Velocities at launch angle of 40°.
To further validate the model,the line density of rope is changed into 0.023 kg/m,the experiments are taken at the launch angles of 30°and 50°,and the other conditions remain unchanged.
The range,maximum velocity,and flight time of the new rope obtained by simulation and test at the launch angles of 30°and 50°are shown in Tables 3 and 4.By comparing Table 3 with Table 4,we can find that the range gets longer,the maximum velocity gets faster and the flight time gets longer when the line density of rope decreases.It can be seen from Table 4 that the simulated results are not in well agreement with the experiment data.It is because that many random factors exist in the experiment,and the two-dimensional model is a simplified model,which cannot give an accurate calculation.

Table 3Comparison of simulation and experimental results at launch angle of 30°.

Table 4Comparison of simulation and experimental results at launch angle of 50°.
The velocities of rocket with new rope measured by radar and obtained by simulation at the launch angles of 30°and 50°are shown in Figs.6 and 7.
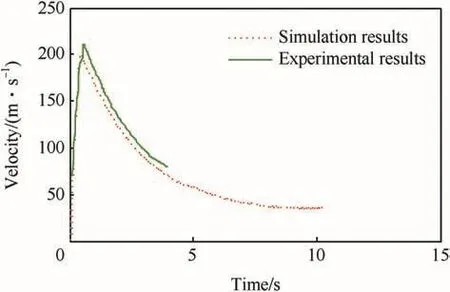
Fig.6.Curve of simulation and experiment velocities at launch angle of 30°.
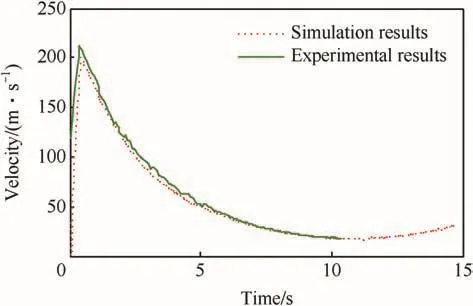
Fig.7.Curves of simulation and experiment velocities at launch angle of 50°.
It can be seen from the above data comparison that the rope characteristics and the launch angle are the important factors affecting the range,maximum velocity and flight time of line throwing rocket.The simulation results are basically close to the experimental results.The discrete model can approximately describe the motion of line throwing rocket when the length of segment is small enough.
4.Conclusions
The finite segment method was used to model the rope,and the kinematics parameters of line throwing rocket were analyzed based on Kane’s method.A dynamics model of line throwing rocket with flight was developed.The simulation results are consistent with experimental data.The dynamics model reveals the basic rules and characteristics of the motion of line throwing rocket,and it is theoretically significant for the further study on the disturbance of rope as well as the guidance and flight control of line throwing rocket.
The dynamics model is a two-dimensional model of the ideal case,without considering the effects of weather conditions,rope characteristics and other factors.In the further study,we willestablish a three-dimensionalmodel,describing the motion of line throwing rocket completely and accurately.
[1]Liu JC.Helicopter in marine search and rescue operations.World Shipping 2001;4(4):15-6.
[2]Zhang FG.Study of the optimal search and rescue model of helicopter on sea.Syst Eng Theory Pract 2001;21(3):87-91.
[3]Vogl Joseph Dwayne. Line throwing rescue line. US:20000569840.2002-10-03.
[4]Silberhuette pyrotechnik veb.Line throwing apparatus.China:GB19810022727.1982-03-24.
[5]Wang HT,Liu LB,Xiong W.Improved design of pneumatic line-thrower.J Chin Hydraul Pneum 2013;4:110-2.
[6]Huston RL,Liu YW.Dynamics of multibody systems.Tianjin:Tianjin University Publishing House;1987.
[7]Kane TR,Levinson DA.Dynamics:theory and applications.New York:McGraw-Hill;1985.
[8]Kane TR,Likins PW,Levinson DA.Spacecraft dynamics.New York:McGraw-Hill Book Company;1993.
[9]Kane TR,Levinson DA.Formulation of equations of motion for complex spacecraft.J Guid Control Dyn 1980;3(2):99-112.
[10]Huston RL,Kammen JW.Validation of finite segment cable models.Comput Struct 1982;15(6):653-60.
[11]Wang Y,Huston RL.A lumped parameter method in the nonlinear analysis of flexible multibody systems. J Comput Struct 1994;50(3):421-32.
[12]Ablow CA,Schechter S.Numerical simulation of undersea cable dynamics.Ocean Eng 1983;10(6):443-57.
[13]Burgess JJ.Modeling of undersea cable installation with a finite difference method.In:Proceedings of the first international offshore and polar engineering conference,Edinburgh,Scot.Gold CO,USA:International Society of Offshore and Polar Engineers(ISOPE);1991.pp.222-7.
[14]Kamman James W,Huston Ronald L.Modeling of variable length towed and tethered cable systems.J Guid Control Dyn 1999;22(4):602-8.
[15]Driscoll FR,Lueck RG,Nabon M.Development and validation of a lumped-mass dynamics model of a deep-sea ROV system.Appl Ocean Res 1999;22:l69-182.
[16]Buckham B,Nahon M.Dynamics simulation of low tension tethers.In:Oceans conference record(IEEE),Seattle,WA,USA.Piscataway,NJ,USA:Institute of Electrical and Electronics Engineers Inc.;1999.pp.757-66.
[17]Buckham B,Nahon M,Cote G.Validation of a finite element model for slack ROV tethers.In:Oceans conference record(IEEE),Providence,RI,USA.Piscataway,NJ,USA:Institute of Electrical and Electronics Engineers Inc.;2000.pp.1129-36.
[18]Buckham B,Driscoll FR,Meyer N.Development of a finite element cable model for use in low-tension dynamic simulation.In:Proceedings of the fourth international symposium on cable dynamics;2001.
[19]Buckham Bradley J,Driscoll Frederick R.Three dimensional dynamics simulation of slack tether motion in an ROV system.In:Proceedings of the international offshore and polar engineering conference,Honolulu.HI,United States:International Society of Offshore and Polar Engineers;2003.pp.674-81.
- Defence Technology的其它文章
- Shock tube design for high intensity blast waves for laboratory testing of armor and combat materiel
- Formation of explosively formed penetrator with fins and its flight characteristics
- Experimental investigation of a cook-off temperature in a hot barrel
- Formulation development and characterization of cellulose acetate nitrate based propellants for improved insensitive munitions properties
- Deconsolidation and combustion performance of thermally consolidated propellants deterred by multi-layers coating
- Burning characteristics of microcellular combustible objects

