Comparative Analysis of Some Fatigue Crack Propagation Models
YANG Peng,GU Xue-kang
(China Ship Scientific Research Center,Wuxi 214082,China)
1 Introduction
Based on linear elastic mechanics,Irwin[1]has studied the fracture property of plate with central through crack under tensile loading and initially defined the multiply of the square root of semi-length of crack and stress as stress intensity factor.Paris[2]has firstly supposed that fatigue crack propagation rate has close relationship with stress intensity factor range ΔK after investigating fatigue phenomenon under constant amplitude loading in which he has taken ΔK as controlling parameter and given one linear fatigue crack propagation model to describe the stable propagation phase of fatigue crack.Elber[3]has initially presented crack closure theory which supposes the real controlling factor of fatigue crack propagation is effective stress intensity factor range ΔKeff.After that,many researchers have proposed some fatigue crack propagation models by consistent endeavor and lots of tests.Then,people mainly recognize that there are three driving forces in fatigue crack propagation,such as ΔK,ΔKeffand maximum stress intensity factor Kmax.These models are mainly split into one-parameter and two-parameter models by number of driving forces.The two-parameter model considers that there are two driving forces ΔK and Kmaxin fatigue crack propagation.Sadananda and Vasudevan[4]have presented a classical two-parameter model not containing unstable phase of fatigue crack propagation,which Cui et al[5]have extended to totally describe the three phases of crack propagation.Some one-parameter models consider effective stress intensity factor range ΔKeffas driving force,such as the famous McEvily model.McEvily and Ishihara[6]have improved this one-parameter model,but the improved model could only be applied to near-threshold and stable phases not containing unstable phase of crack growth.For overcoming the restriction,Cui and Huang[7]have extended McEcily model in which condition controlling parameter of unstable propagation for fatigue crack has been introduced and yield strength has been replaced by virtual strength,thereby the application range has been expanded into the whole phase of fatigue crack propagation and the model is suitable for smooth specimens without initial crack.Furthermore,for strengthening the description ability to fatigue crack propagation and more accurately considering the influence factors,Wang and Cui[8]have further modified McEvily model with more than ten parameters which recognizes maximum stress intensity opening factor Kopmaxhas a fuzzy definition and is not given an explicit general expression in McEvily model.So Kopmaxhas been abandoned in Wang’s model,meanwhile,a parameter called crack opening function has been brought in.At the same time,Wang’s model supposes that:(1)Crack fracture toughness Kc has close relation to stress ratio and stress-strain state at crack tip;(2)When maximum stress intensity factor is equal to Kc,the unstable fracture happens;(3)Carck opening function is relative to stress ratio,crack length,and so on.For describing the three phases of crack propagation with a continuous expression,the authors of this paper have supposed a new one-parameter fatigue crack propagation model called Tangential model[9]which could properly represent fatigue crack growth of aluminum alloy and steel.
Due to the complexity of fatigue crack propagation mechanism,such as crack propagation driving force,mean stress,loading sequence,initial crack,welding technology,joint form,plate thickness,temperature,and so on,though researchers have presented many models for fatigue crack propagation,it is doubtful whether these models could properly describe fatigue crack propagation or accurately predict structural fatigue life which needs plenty of tests and engineering applications to validate and more definite theoretical explanation.Based on the experimental data of the fatigue crack propagation of aluminum alloy,the paper investigated the accuracies and differences of these models for fatigue crack propagation,and verified these models whether they could effectively assess and predict structural fatigue life.
2 One-parameter models
One-parameter model takes stress intensity factor range ΔK or effective stress intensity factor range ΔKeffas driving force.At present,a series of one-parameter models such as McEvily model and its improvements take effective stress intensity factor range ΔKeffas driving force.The other classical one-parameter model called Paris model is generally applied in engineering,whose essence is linear assumption of stable phase of fatigue crack propagation.The authors of the paper have proposed a new one-parameter model called Tangential model taking stress intensity factor range ΔK as driving force,whose essence is using the property of tangential function to describe the three phases of fatigue crack propagation.
2.1 The original McEvily model
McEvily et al[10]have presented the following fatigue crack propagation model considering short crack elastic-plastic behavior,crack closure level and Kitagawa effect.

where a is semi-length of crack,Δa is crack growth length,R is stress ratio,A is material property parameter,Kmaxis maximum stress intensity factor,k is the parameter to describe the change of crack closure level along with crack semi-length,Kopmaxis the maximum stress intensity factor at crack opening level,ΔKeffthis the threshold of effective stress intensity factor range,reis scanting of material intrinsic property,σmaxis maximum stress of loading cycle,σYis yield stress,and Y(a)is geometric correction coefficient.This model could only describe near-threshold and stable propagation not containing unstable propagation.
2.2 The extended McEvily model
2.2.1 First extension
For extending McEvily model to describe the whole process of fatigue crack propagation,Cui and Huang[7]have modified McEvily model as follows:
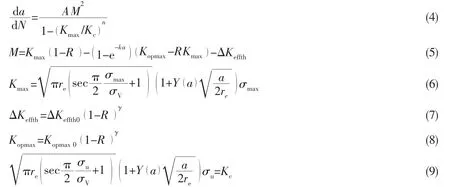
where Kcis material fracture toughness,n is the parameter presenting the effect of Kmax/Kc,Kop,max0and ΔKeff,th0respectively are maximum opening factor and threshold of effective stress strength range factor under R=0,γ is the parameter reflecting the effect of stress ratio,σuis real ultimate strength,σVis virtual strength without defect in ideal material.For there are nine parameters in this model,such as A,n,k,γ,Kc,re,σV,Kop,max0and ΔKeff,th0,so the model is called‘Nine-parameters model’.
2.2.2 Second extension
During the study of McEvily model,Wang et al[11]have found that fixing the slope of crack stable propagation at 2.0 could not properly fit many test results.Thus,they have supposed that:(1)The slope parameter controlling crack growth changes from 2 to m,(2)Assuming ΔKeffthand Kop,maxare the function of R,McEvily model is improved as follows:

2.2.3 Third extension
Wang and Cui[8]have improved McEvily model as follows after considering the variation of fracture toughness Kcand the stress intensity factor at crack opening level.
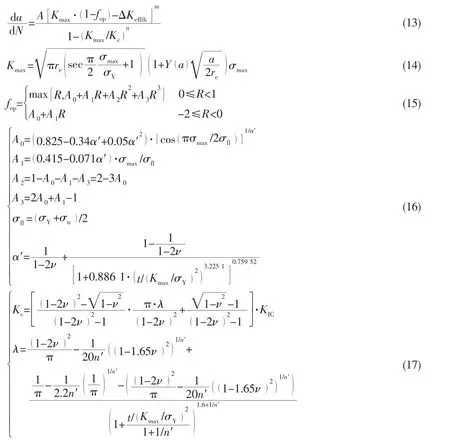

where the new symbols are explained as:KICis the fracture toughness of plane strain,fopis crack opening function,σfland σVare flow stress and‘virtual strength’of material,respectively,ν is Poisson’s ratio,n′is hardening exponent of the power-law material;α′is the plane stress/strain constraint factor;α is a parameter used to calculate the‘virtual strength’of the material,t is the thickness of plate.The above model is also called‘Unified fatigue model’.
2.4 Tangential model
The authors of the paper have presented the new crack propagation model[9]as:

where a1,a2,k1and k2are material properties respectively in which k1and k2only depend on ΔKthand ΔKf,a1and a2are relative to material property,stress ratio and loading environment.For ΔKthand ΔKfare relative to R,k1and k2are the function of R.Then the model considers the influence of R by a1,a2,k1and k2which could be obtained by fitting the test data of crack growth under various stress ratios,such as for aluminum alloy 6013-T651[12],the expressions are:

3 Two-parameter models
Sadananda and Vasudevan[4]have supposed a two-parameter model which takes stress intensity factor range ΔK and maximum stress intensity factor Kmaxas driving forces.

Based on the above model,Cui et al[5]have given an improved model to describe the whole process of fatigue crack propagation.

4 Comparative analysis of fatigue crack propagation models
Paris et al[12]have given test data of fatigue crack propagation of aluminum alloy 6013-T651 under various stress ratios.The paper used the above models to analyze the process of fatigue crack propagation for aluminum alloy 6013-T651 under stress ratio of 0.1,then,it needs to establish the values of k,and A.In this test,Y(a)=0.65,σmax=100 MPa and σY=400 MPa.On the basis of some Refs.[13-16],it is obtained that re=1×10⁻⁶m,k=13 000,meanwhile,the unit of crack propagation rate ΔKeffth=2.43 MPa·after using McEvily model to fit the test data of fatigue crack propagation of aluminum alloy 6013-T651.Because of adding parameters Kcand m in Cui’s model,it is supposed thatand n=1.5 could be more appropriate on the basis of the is m/cycle.
It is obtained that A=2.26×10⁻⁹and parameters of McEvily model.Based on the parameters of Cui’s model,the parameters of A,m,and ΔKeffthare obtained by nonlinear fitting of fatigue test data in Wang YF’s model.Thus,the parameters of these one-parameter models could be obtained and shown in Tab.1 in which the parameter determining process of Wang’s model refers Ref.[17]and the parameters of Tangential model refers Ref.[9].According to Tab.1,each fatigue crack propagation curve is shown in Fig.1 which reveals McEvily model,Cui’s model and Wang’s model are more accurate than Wang YF’s model and Tangential model near threshold,but Wang YF’s model and Tangential model are more exact than the former three at stable phase;meanwhile,the Cui’s model,Wang YF’s model and tangential model closely match the test data at unstable phase.

Tab.1 Fatigue crack propagation parameters of one-parameter models
In addition,it is found that McEvily model has larger error at unstable phase because of McEvily model not considering correction at unstable phase.Thus,it could not describe unstable phase of crack propagation,while using the correction method supposed by Cui et al[7],both Cui’s model and Wang YF’s model match test data at unstable phase.Thought Wang’s model has taken the same correction method,there still are differences with test data.The reason is the value of parameter n given by Chen[17]has a certain problem.
Kcis a material parameter with physical meaning,generally,the crack appears unstable growth when maximum stress intensity factor at crack tip is equal to fatigue fracture toughness Kc.Schijve[18]has pointed out Kcis relative to loading sequence,stress ratio,temperature and stress-stain state at crack tip which causes the determination work of Kcvery complex.Kcin engineering practice is between plane stress and plane strain state.Generally the fracture toughness Kcvaries from 42 toDuring the fitting analysis process of fatigue crack propagation,the fatigue crack propagation at unstable phase is mainly determined by Kcand n,proper choice of Kcand n could make the model closely match the test data.Nevertheless,the choosing course should not only obey physical meaning,but also consider the test data of crack growth,which needs to adjust n.In addition,the unstable phase of crack growth only occupies a little part in the whole life,thus the fracture toughness Kchas little effect on fatigue life assessment.

Fig.1 Comparisons among different one-parameter models
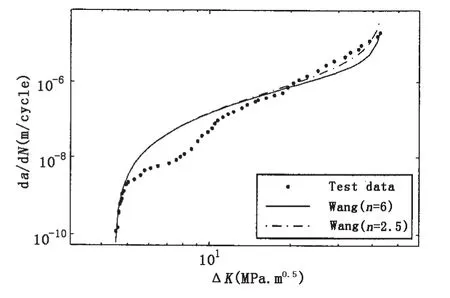
Fig.2 Model of Wang
According to instability criterion of fatigue crack growth and the fatigue test data of aluminum alloy 6013-T651,the Ref.[17]sets Kcaboutand n 6.0 in Wang’s model.Due to improper choice of n,the Wang’s model has obvious deviation from test data at unstable phase in Fig.1.Adjusting n to 2.5 gets a satisfied result shown in Fig.2.

Tab.2 Fatigue crack propagation parameters of two-parameter models
In the two-parameter model improved by Cui,Bian et al[19]have obtained the fatigue crack propagation parameters shown as Tab.2 by nonlinear fitting using Eq.(27)for aluminum alloy 6013-T651 under R=0.1.Based on the data in Tab.1 and Tab.2,the fatigue crack propagation curves of typical one-parameter models and two-parameter models are shown in Fig.3 from which it is concluded that all of these models could closely describe the whole phase of fatigue crack growth.But,Cui’s two-parameter model and Tangential model are poorer than McEvily model and Wang’s model near threshold,while the former two are better at stable phase.The reason is the curvature varies very rapidly from near-threshold to stable phase that cause its difficulty to have the same precision at the two phases.So the existing models remain to be further modified.
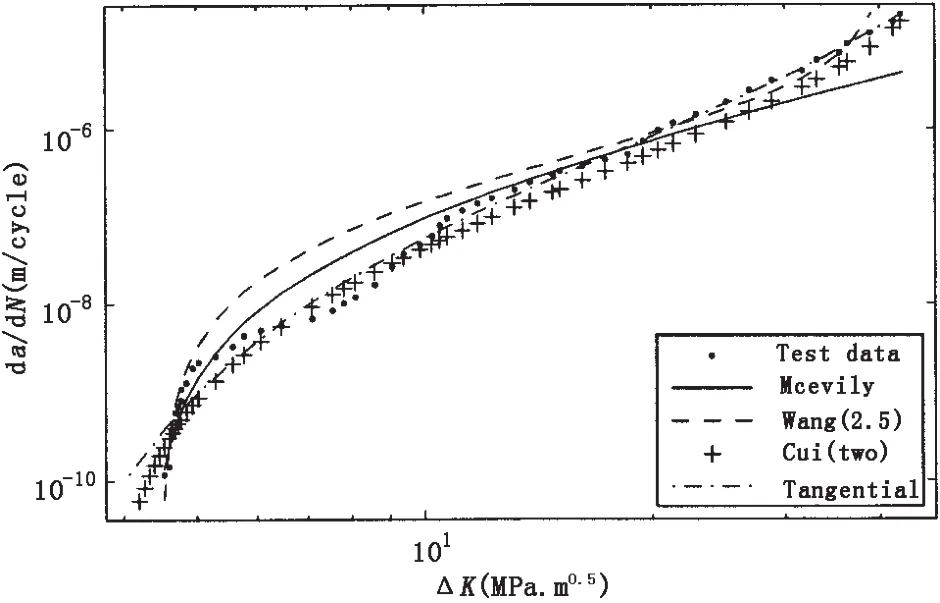
Fig.3 Comparisons among various fatigue models
Setting Y(a)and stress range respectively equal to 1.12 and 68 MPa while calculating stress intensity factor range.For different initial crack lengths,the a-N relationships of the former McEvily model,Wang’s model,Cui’s two-parameter model and Tangential model have been calculated shown in Fig.4 for aluminum alloy 6013-T651 under R=0.1.When crack semi-length grows from 2 mm to 50 mm,the loading cycle number is 3.9×10⁵by test data.Cui’s two-parameter model most closely matches the test data;meanwhile,the value of Cui’s oneparameter model is 1.4×10⁵,which worst matches the test data and is 0.36 times of test result.When crack semi-length grows from 5 mm to 50 mm,the loading cycle number is 9.2×10⁴by test data.McEvily model and Tangential model most closely match the test data;meanwhile,the value of Cui’s two-parameter model is 1.4×10⁵,which worst matches the test data and is 1.52 times of test result.This means while the crack growth processes(or initial crack lengths)are different,the coincidence degrees of the fatigue life assessing the result of these model to test result are varying,but maximum result of these models is not more than three times of minimum result.
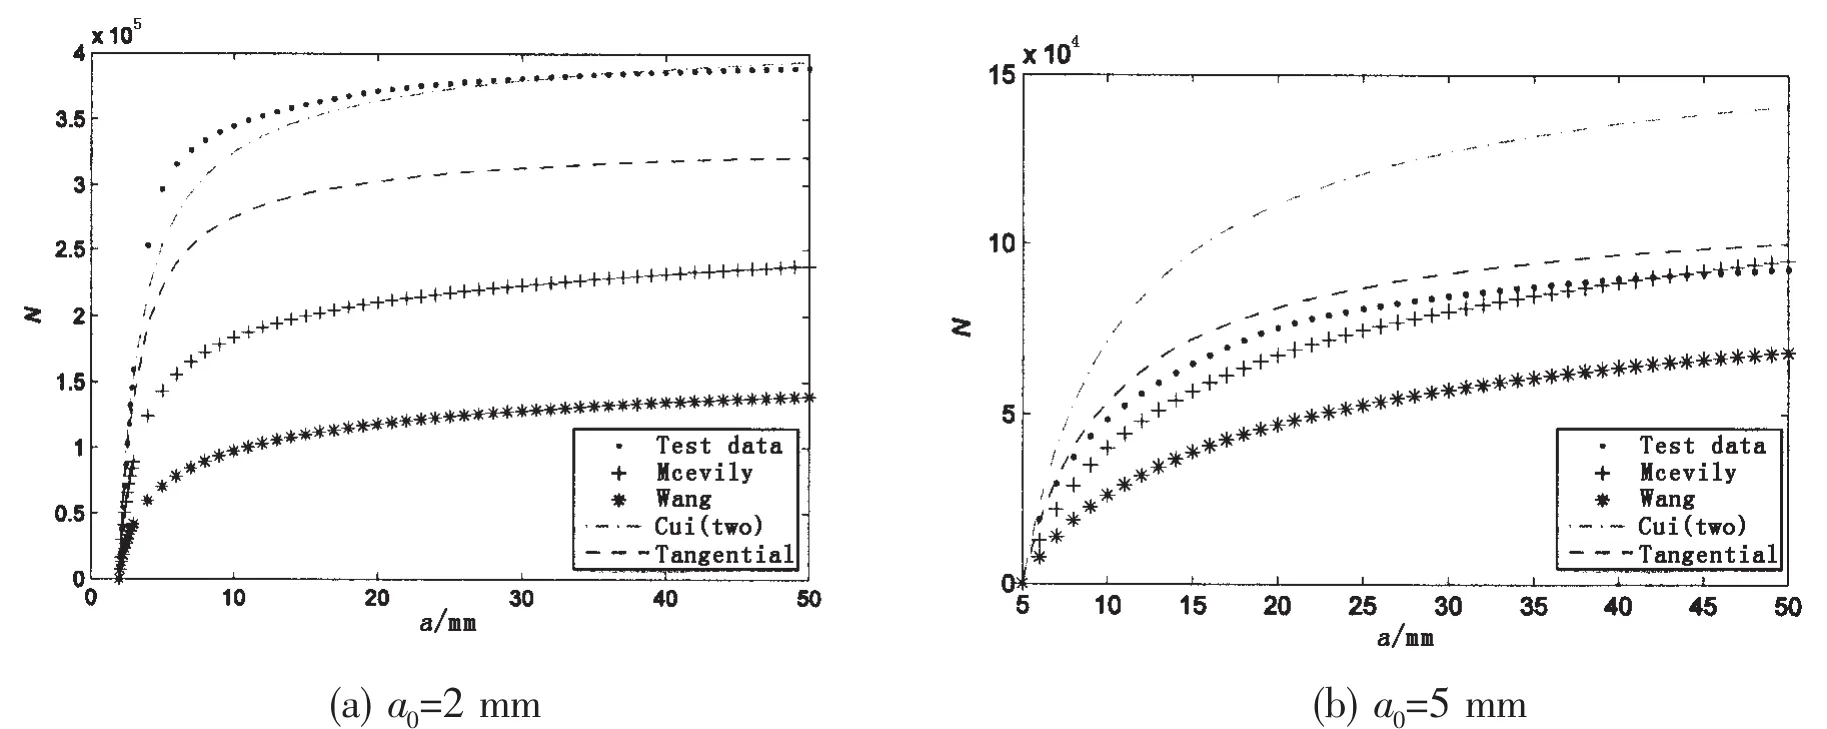
Fig.4 a-N curve
5 Conclusions
Initial McEvily model and two-parameter model mainly described the near-threshold and stable phases of fatigue crack propagation.The improved models and Tangential model could describe the whole phase of crack propagation.It is concluded that all of these models could closely describe the whole phase of fatigue crack growth.But,Cui’s two-parameter model and Tangential model are poorer than McEvily model and Wang’s model near threshold,while the former two are better at stable phase.The reason is the curvature varies very rapidly from near-threshold to stable phase which causes it is difficult to have the same precision at two phases.So the existing models remain to be further modified.In addition,while the crack growth processes(or initial crack lengths)are different,the coincidence degrees of the fatigue life assessing result of these model to test result are varying,but maximum result of these models is not more than three times of minimum result.
[1]Irwin G.Analysis of stresses and strains near the end of a crack traversing a plate[J].Journal of Applied Mechanics,ASME,1957,24.
[2]Paris P C,Gomez M P,Anderson W P.A rational analytical theory of fatigue[J].Trends Eng,1961,13:9-14.
[3]Elber W.The significance of fatigue crack closure[M].In Damage Tolerance in Aircraft Structures,Special Technical Publication,1971:230-242.
[4]Sadananda K,Vasudevan A K.Short crack growth and internal stresses[J].International Journal of Fatigue,1997,19:99-108.
[5]Cui W C,Bian R G,Liu X C.Application of the two-parameter unified approach for fatigue life prediction of marine structures[C].Proceedings of the 10th International Symposium on Practical Design of Ships and Other Floating Structures,2007,2:1064-1070.
[6]Mcevily A J,Ishihara S.On the dependence of the rate of the fatigue crack growth on the σna(2a)parameter[J].International Journal of Fatigue,2001,23:115-120.
[7]Cui W C,Huang X P.A general constitutive relation for fatigue crack growth analysis of metal structures[J].Acta.Metall.Sinica.,2003,16:342-54.
[8]Wang F,Cui W C.On the engineering approach to estimate the parameters in an improved crack growth rate model for fatigue life prediction[J].Ship and Offshore Structures,2010,3(8):227-241.
[9]Yang P,Gu X K.A tangential model for fatigue crack growth rules[J].Shipbuilding of China,2012,53(1):53-61.
[10]Mcevily A J,Bao H,Ishihara S.A modified constitutive relation for fatigue crack growth[C]//In Proceedings of the Seventh International Fatigue Congress(Fatigue’99).Beijing:Higher Education Press:1999:329-336.
[11]Wang Y F,Cui W C,Wu X Y,et al.The extended McEvily model for fatigue crack growth analysis of metal structures[J].Int.J Fatigue,2008,30:1851-1860.
[12]Paris P C,Tada H,Donald J K.Service load fatigue damage-a historical perspective[J].International Journal of Fatigue,1999,21:35-46.
[13]Bao H.Ph.D.Thesis[D].University of Connecticut,1994.
[14]Ishihar S,Mcevily A J.Analysis of short fatigue crack growth in cast aluminum alloys[J].International Journal of Fatigue,2002,24:1169-1174.
[15]Mcevily A J,Ishihara S,Endo M,Sakai H.On one-and two-parameter analyses of short fatigue crack growth[J].International Journal of Fatigue,2007,29:2237-2245.
[16]Wang Y F,Yi G J,Huang X P,Cui W C.Determination of the parameter reflecting crack closure development in the fatigue crack propagation model[J].Shipbuilding of China,2008,49(4):45-51.
[17]Chen F L.Study on load sequence effect in the unified fatigue life prediction method[D].CSSRC,Wuxi,China,2011.
[18]Schijve J.Fatigue of structures and materials in the 20th century and the state of the art[J].International Journal of Fatigue,2003,25:679-702.
[19]Bian R G,Cui W C,Wan Z Q.A method for the evaluation of the two fatigue thresholds based on the two-parameter unified approach[J].Journal of Ship Mechanics,2010,14(1-2):94-100.
- 船舶力学的其它文章
- Transient Dynamic Analysis of Towed Low-tension Cable with Experimental Verification
- Characteristics of the Severe Slugging under Different Gas-Liquid Physical Parameters
- Research on Interaction between a Large Underwater Carrier and a Mini-underwater Vehicle
- Washes Produced by High Speed Displacement Ships in Shallow Water:Prediction vs Measurements
- Application of the Loading Inherent Subspace Scaling Method on the Whipping Responses Test of a Surface Ship to Underwater Explosions
- Research on Multiple Excitations Inversion-oscillations

