
Analysis of the Volatile Chemicals of Longjing Tea from Different Production Locations Using Electronic Nose
2013-12-13 06:30:54DeSongTangCunAoShuYingGongYingBinZhangZhiLeiGu
茶叶 2013年4期
De-Song Tang,Cun Ao,Shu-Ying Gong* ,Ying-Bin Zhang,Zhi-Lei Gu
1.Tea Research Institute,Zhejiang University,Hangzhou 310058,China.
2.Key Laboratory of Horticultural Plants Growth,Development and Biotechnology,Agricultural Ministry of China,Hangzhou 310058,China.
1.Introduction
During the last few years,electronic noses (E-nose)has been developed and applied for classification and prediction purposes by monitoring the flavour of several food products[1-5].But as comparison with conventional aroma analysis methods,e.g.GC-MS,E-nose give an overall response to a mixture without identifying the single components[6,7].How to get chemical information of volatile compounds related to E-nose response became the focus of research recently.
Some reports related the E-nose response to the exogenous standard chemicals added into the study materials,such as relating the response of E-nose to the reference wine with added off-flavour compounds[8],differentiating the rice extrudates with various volatile compounds of Mesona Blumes gum contents[9]and detecting the key aromas peculiar of different stages of the bread baking process using standard chemicals[10].In this kind of studies,the studied materials were not remained in their origrinal conditions.
To obtain the information of internal compounds response on the E-nose sensors might be better in accessing the actual relations between the E-nose and the aroma compounds.Lee,Kim,Sohn,& Yang[11]isolated and identified characteristic fragrant and sweet aroma compounds from red ginseng,which was significantly correlated with either the SY/LG sensor response or the SY/AA sensor response of electronic nose at 1%level;Solis-Solis et al[12]isolated the free aroma compounds from eight varieties of apricots by liquid-liquid extraction and solid phase microextraction,and identified by gas chromatography-mass spectroscopy,which served to recognize and classify all the analyzed varieties.In these studies,separation techniques were used to seek the chemical components responsible for the discrimination by E-nose,but it was difficult to employ these methods in application of on-line analysis.García-González et al[13]provided a good solution to chemical understanding of the sensor signals and to determine volatile compounds which played a major role in contributing to the responses of E-nose by coupling E-nose response to gas chromatography.In that study,the volatiles of virgin olive oil were separated prior they arrived the sensor chamber.It could quantify the individual contribution of volatile compounds to the E-nose sensor responses,but the problem of long sensor desorption time delayed with the chromatogram retention time remained to be solved.
Direct relating the individual chemical to the response of E-nose is an alternative method which could provide information that individual chemical response on the E-nose sensors,but until now there is few reports on this point.Only Cimato et al[14]using a linear regression method to relate the E-nonse response to the chemical map of extra virgin olive oils obtained by HS-SPME/GC/MS,which assessed the E-nose response pattern that was related with six volatile compounds.In the present work,multianalysis and chemometrics technique were employed to analyse the E-nose and GC-MS data of Longjing tea produced in different locations,and the relations of each compound to the E-nose response was evaluated in order to determine the key compounds which play an important role in discriminating Longjing tea according to the geographical locations by E-nose analysis.
2.Experimental
2.1.Materials
Longjing tea samples with the quality of superfine grade,made from the same plant variety,namely,Longjing43,were collected from five production locations in Zhejiang province,China:Longjingcun(LJC),Meijiawu(MJW),Shangmanlong(SMJL),Jingling(JL)and Xinchang(XC).
2.2.E-nose analysis
The tea samples were ground and passed through a 28-mesh sift.Then 0.50 g ground tea powder was placed into a 10 mL vial and 0.75 mL distilled water was added.The vial was incubated in a water bath at 35℃ for 15 min,and 2 mL of headspace gas of the flask was extracted using a syringe for analysis.
An Alpha FOX 4000 E-nose(MOS Toulouse,France)system was employed in this experiment.The system equipped with 18 metal oxide semiconductor gas sensors.The multi-sensor array was interfaced with a computer and the system was controlled by AlphaSoft software 2004(Version 9.0).The operation parameters were as follows:acquisition time,120 s;acquisition period,1.0 s;acquisition delay,300 s;flow rate,150 ml/min;injection volume,2000 μL;and injection speed,2000 μL/s.
2.3.GC-MS analysis
The volatile components of Longjing tea samples were collected using solid-phase microextraction(65 μm,PDMS/DVB,Supel)and determined by gas chromatography(Agilent 6890)coupled to quadrupolar mass-selective spectrometry(HP 5973,Agilent Technologies,USA,USA).Analytes were separated on a INNOWAX column(30 m ×0.32 mm,0.5 μm film thickness).The oven temperature was initially held at 50℃ for 5 min.For the first ramp,the temperature was increased to 220℃ at a speed of 3℃·min-1,in the second to 240℃ at 10℃·min-1,then held for 5 min.The operations conditions of HP Mass Spectrometer were as follows:The ion source and the transfer line were set to 230℃ and 250℃,respectively;ion source temperature,250℃;interface temperature,230℃;electron impact(EI)energy,70 eV;voltage,200V;mass range m/z,35-540 and scanning speed 1000 amu/s.
Identification of volatile components was confirmed by comparison of collected mass spectra with those of authenticated standards and spectra of the National Institute for Standards and Technology(NIST)mass spectral library and Wiley mass spectral library(version6.0).
2.4.Data analysis
For discrimination of the tea samples according to the production location,the methods of principal component analysis(PCA)[6]and linear discriminant analysis(LDA)[15,16]were employed to reduce the dimensionality of data

where TEis the false classified patterns and T is the total number of test patterns.
Differences among the volatile components of GC-MS data was determined by an overall ANOVA[19,20].And multiple comparison procedure(MCP)[21,22]were performed to find the canonical variables that explain the maximum of variability among analyzed tea samples.
In order to find the importance of each volatile component related to the response of the E-nose,the partial least squares regression(PLSR)[19,23]was performed among E-nose response(the independent variables)and the single chemical compounds(the dependent variables).The significant component was chosen by comparing the coefficient R2[24]from the PLSR regression model.
The data preprocessing and analysis was performed using Matlab R2009b(The Mathworks,Natick,USA).
3.Results and discussion
3.1.Discrimination of Longjing tea according to production location by E-nose

Fig.1.PCA plots of Longjing tea produced in different locations.
set and classification.The method of 10-fold cross validation[17,18]was used for performance evaluation of classification the data of Longjing tea samples.The classification error rate(Err)for the experiment is calculated as following:
For discrimination of the tea samples according to the production locations,the method of principal component analysis (PCA)was employed is to reduce the dimensionality of data set while retaining as much information as possible.The first significant component explains the largest percentage of the total variance,the second one,the second largest percentage,and so forth.Consequently the variables were compressed to get the most significant PCs scores.The corresponding score plot(Fig.1)shows the distribution in the discriminant space of the studied tea samples from different locations.This figure revealed a separation between the samples from different production locations.Teasamplesproduced in MJW and SMJL positioned on the left part of the graph,that is the negative part of PC1 axis,and the other samples from LJC,JL and XC were distributed in the positive part of the graph.The samples from Longjingcun located above those from Jingling and Xinchang.The 10-fold cross validation of discrimination performance showed that the error rate of classification obtained was 4%,which indicated that good discrimination of Longjing tea samples from different locations was obtained.
3.2.Difference of volatile components among the tea samples from different locations
A total of 38 peaks were commonly identified from the SPME-GC-MS of all the Longjing tea samples in this experiment,each compound was serially numbered according to the order of retention time(Fig.2).From a qualitative point of view,it could be observed that the profile of chromatogram varied greatly between the samples from different producing locations.The identified components were listed in Table1.There are 3 components dominated in the aroma of the tea samples from Longjingcun,namely linalool(No.12),cis-3-hexenyl hexanoate(No.17)and geraniol(No.31).Linalool(No.12)and geraniol(No.31)were in high content in all the samples from except that from XC.The compound cis-3-hexenyl hexanoate(No.17)was in high content in all the samples except that from SMJL.
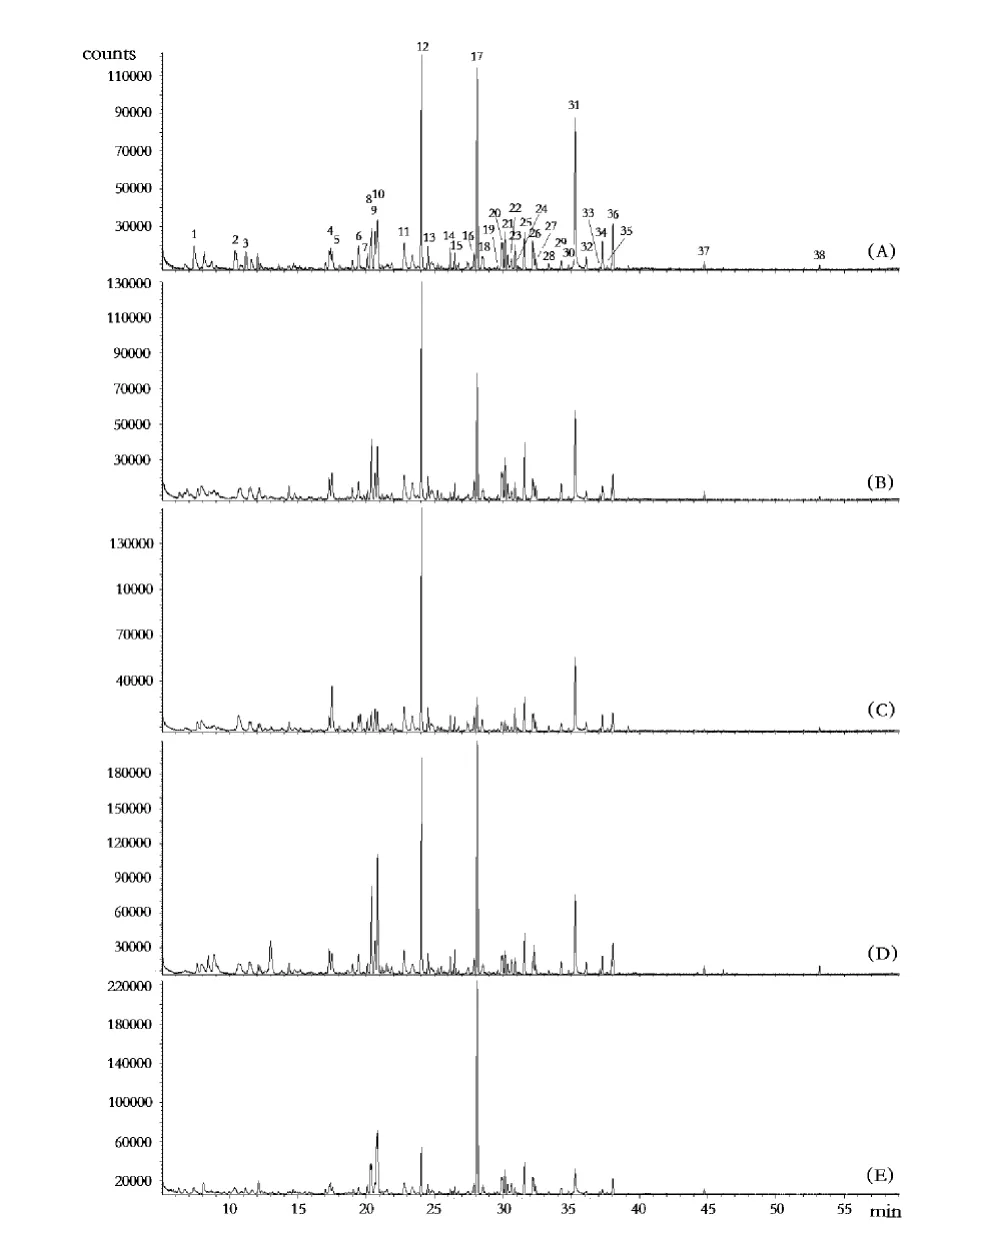
Fig.2.Chromatogram for Longjing tea samples from different producing area. (A)Longjingcun, (B)Meijiawu,(C)Shangmajuelong,(D)Jingling and(E)Xinchang.
ANOVA and MCP analysis was performed on the SPME-GC-MSdata,themultcomparefunctionin Matlab displaysa graph with each group mean represented by a symbol and an interval around the symbol(Fig.3).The means are significantly different if their intervals are disjoint,and are not significantly different if their intervals overlapped.It is observed that significant differences exist for the compounds of cis-3-hexenylhexanoate (No.17)and isoamyl isovalerate(No.10),both are significantly differentfrom each other among the tea samples from 5 locations.It should be noticed that the components of isoamyl isovalerate(No.10)and 3-hexenyl-butyrate(No.8)are significant different but they are not the predominant components,these two compounds might be easily affected by the producing areas.Some other components were not significantly different among all the locations,such 3-hexenyl-butyrate(No.8)was not significantly different between the JL and XC,and no difference was found for linalool(No.12)between JL and LJC.

Table1.The coefficient R2of the PLSR model for each identified chemicals.
The volatile flavor compounds of Longjing tea samples varied due to their geographical locations,Owuor et al[25]pointed out that it was not possible to produce tea of the same quality even from the same cultivars when the production location was varied because of the difference in the quality parameters with locations.The difference in environmental conditions might lead to the variation of volatile components in composition[26].In this study,the multcomparison of GC-MS data indicated that not all the components were significantly different,it could be inferred that not all the volatile components were necessary employed to trace the geographic origin of Longjing tea by E-noses.
3.3.Partial Least Squares Regression
PLSR isonemethod tomodela response variable when there is a large number of predictor variables[19,27-30]. In this work,the PLSR was used to examine the relationships between E-nose response and each individual volatile component of Longjing tea.The significance of each component was evaluated by comparing the coefficient R2,the higher values indicated that the component has a tronger correlation with E-nose response,it plays a more important role in the PLSR model.In other words,it has a more contribution to the discrimination of Longjing tea according to the producing location by E-nose.This technique wasused to discriminatethe chemical component which responded more significantly on the E-nose sensors,it was possible to give complementary information concerning the E-nose response to the individual chemical component instead of the total volatile components.
The contributing proportions R2calculated for each volatile component based on PLSR models ranged from 0.98 to 0.19(Table1).Itmeansthatidentified chemicals in tea aroma were not equal important in relating to the response of E-nose.R2value for isoamyl isovalerate(No.10),cis-3-hexenyl hexanoate(No.17),cadinene(No.25),phenylethylalcohol(No.33)and linalool(No.12)were higher than 0.80.These components play an important role in response on E-nose sensors.And isoamyl isovalerate(No.10)plays a more important role than cis-3-hexenyl hexanoate(No.17)though it has a smaller percentage content.It was interesting to find that the components of cadinene(No.25),phenylethylalcohol(No.33)and linalool(No.12)were significantly related to the E-nose response,even they were neither the predominant compound nor significantly different from each other in content.It means that the response of aroma of Longjing tea on the E-nose sensors were not consistent with the percentage of its content.
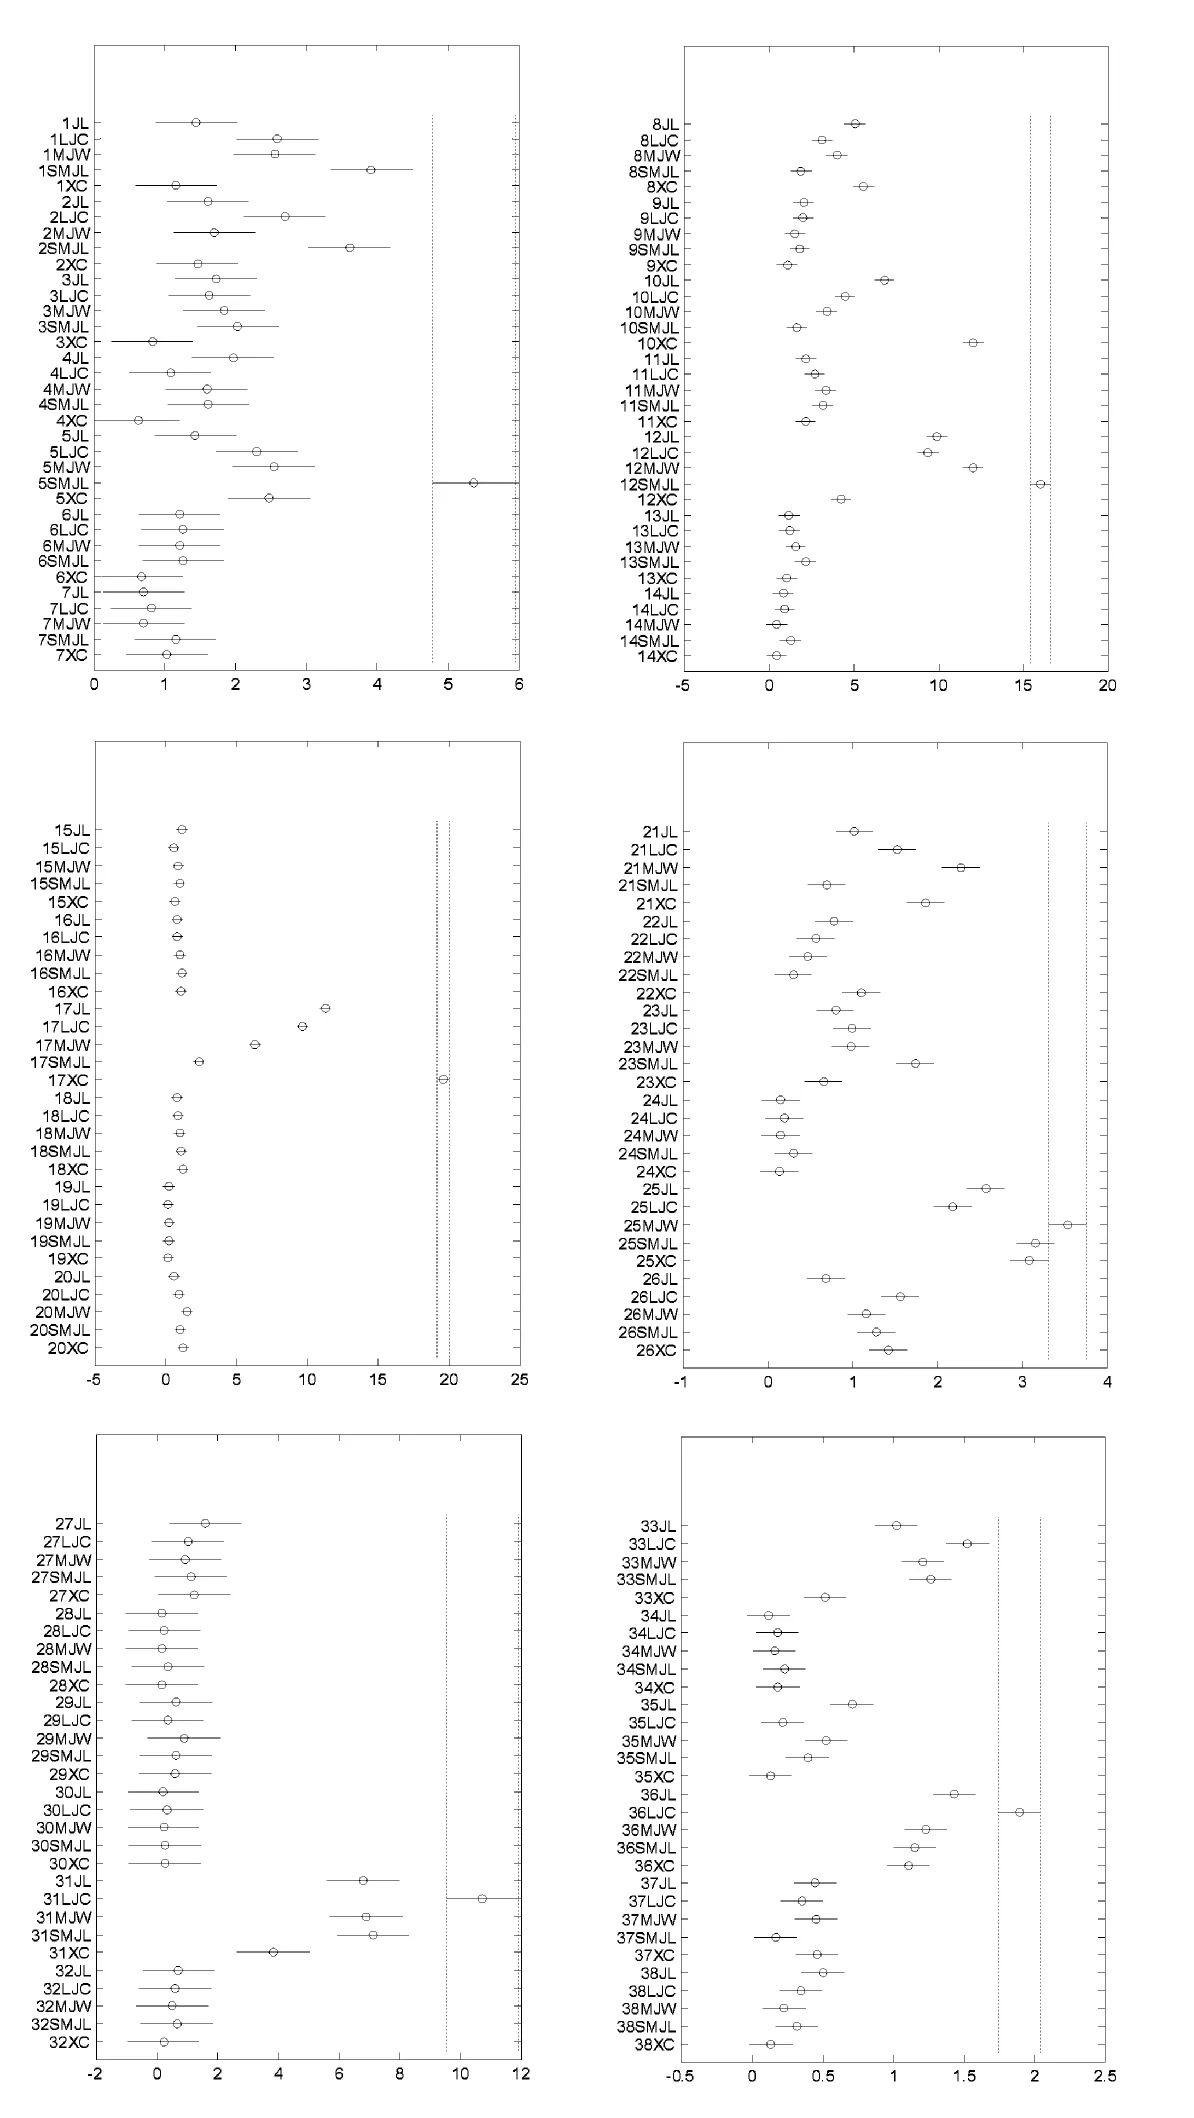
Fig.3.Multcomparison of each identified volatile chemicals of Longjing tea samples from different producing area.The digits are the number of the identified chemicals and the capital letters following the digit are the producing areas:JL-Jingling,LJCLongjingcun,MJW-Meijiawu,SMJL-Shangmanlong,XC-Xinchang.
The specific qualities and characteristics of agriculture products are linked with their geographical production location.The variations in environment and growing conditions are thought to cause variations in tea quality[25,26].Using chemometrics technolique such as PLSR analysis made it possible to identify the aroma compounds which plays an important role in discrimination of Longjing tea according to the producing areas using E-nose.
4.Conclusion
In this work,E-nose and SPME-GC-MS methods were employed in analysis of Longjing tea from different geographical locations.A good discrimination of Longjing tea samples was obtained by E-nose according to the producing area,and a total of 38 compounds were commonly identified from the SPME-GC-MS data.Each individual volatile component was related to E-nose response using PLSR and the significance of each component evaluated by the coefficient R2.It was found that the components isoamyl isovalerate,cis-3-hexenyl hexanoate,cadinene,phenylethylalcohol and linalool play an important role in response on E-nose sensors.
Using chemometrics technique such as PLSR analysis made it possible to identify the aroma compounds which plays an important role in discrimination of Longjing tea according to the producing areas.And it was possible to give complementary information concerning the individual chemicals interacts with the sensors of E-nose instead of the total volatile components.
Acknowledgement
The authors acknowledge the financial support from the China Agriculture(tea)Research System(CARS),Chinese UniversitiesScientific Fund and Scientific Research ProjectofZhejiang Education Department(Y201018805).
Reference
1.Santos JP,Arroyo T,Aleixandre M,Lozano J,Sayago I,García M,Fernández MJ,Arésa L,Gutiérrez J,Cabellos JM,Gil M,Horrillo MC.A comparative study of sensor array and GC-MS:application to Madrid wines characterization.Sensors and Actuators B,Chemical,2004,102(2):299-307.
2.Yu H,Wang J.Discrimination of LongJing green-tea grade by electronic nose.Sensors and Actuators B,2007,122:134-140.
3.Dutta R,Kashwanb KR,Bhuyanb M,Hines EL,Gardner JW.Electronic nose based tea quality standardization.Neural Networks,2003,16:847-853.
4.Gómez AH,Hu G,Wang J,Pereira AG.Evaluation of tomato maturity by electronic nose.Computers and Electronics in Agriculture,2006,54:44-52.
5.Wang B,Xu S,Sun DW.Application of the electronic nose to the identification of different milk flavorings.Food Research International,2010,43:255-262.
6.Perisa M,Escuder-Gilabert L.A 21st century technique for food control:Electronic noses.Analytica Chimica Acta,2009,638:1-15.
7.Cevoli C,Cerretani L,Gori A,Caboni MF,Toschi TG,Fabbri A.Classification of Pecorino cheeses using electronic nose combined with artificial neural network and comparison with GC-MS analysis of volatile compounds.Food Chemistry,2011,129:1315-1319.
8.Ragazzo-Sanchez JA,Chalier P,Ghommidh C.Couplinggaschromatography and electronicnose for dehydration and desalcoholization of alcoholized beverages:Application to off-flavour detection in wine.Sensors and Actuators B:Chemical,2005,106(1):253-257.
9.Feng T,Zhuang H,Ye R,Jin Z,Xu X,Xie Z.Analysis of volatile compounds of Mesona Blumes gum/rice extrudates via GC-MS and electronic nose.Sensors and Actuators B:Chemical,2011,160(1):964-973.
10.Ponzoni A,Depari A,Falasconi M,Comini E,Flammini A,Marioli D,Taroni A,Sberveglieri G.Bread baking aromas detection by low-cost electronic nose.Sensors and Actuators B,2008,130:100-104.
11.Lee SK,Kim JH,Sohn HJ,Yang JW.Changes in aromacharacteristics during the preparation of red ginseng estimated by electronic nose,sensory evaluation and gas chromatography/mass spectrometry.Sensors and Actuators B:Chemical,2005,106(1):7-12.
12.Solis-Solis HM,Calderon-Santoyo M,Gutierrez-Martinez P,Schorr-Galindo S,Ragazzo-Sanchez JA.Discrimination of eightvarieties of apricot(Prunusarmeniaca)by electronic nose,LLE and SPME using GC-MS and multivariate analysis.Sensors and Actuators B:Chemical,2007,125(2):415-421.
13.García-González DL,Aparicio R.Coupling MOS sensors and gas chromatography to interpret the sensor responses to complex food aroma:Application to virgin olive oil.Food Chemistry,2010,120(2):572-579.
14.Cimato A,Monaco DD,Distante C,Epifani M,Siciliano P,Taurino AM,Zuppa M,Sani G.Analysis of single-cultivar extra virgin olive oils by means of an Electronic Nose and HS-SPME/GC/MS methods.Sensors and Actuators B:Chemical,2006,114:674-680.
15.Rezzi S,Axelson DE,Héberger K,Reniero F,Mariani C,Guillou C.Classification of olive oils using high throughput flow 1H NMR fingerprinting with principal component analysis,linear discriminant analysis and probabilistic neural networks.Analytica Chimica Acta,2005,552:13-24.
16.Ramadan Z,Mulholland M,Hibbert DB.Classification of detectors for ion chromatography using principal components regression and linear discriminant analysis.Chemometrics and Intelligent Laboratory Systems,1998,40:165-174.
17.Cawley GC,Talbot NLC.Ecient leave-one-out cross-validation of kernel Fisher discriminant classi'ers.Pattern Recognition,2003,36:2585-2592.
18.Lehmann C,Koenig T,Jelic V,Prichep L,John RE,Wahlund LO,Dodge Y,Dierks T.Application and comparison of classification algorithms for recognition of Alzheimer's disease in electrical brain activity(EEG)Journal of Neuroscience Methods,2007,161:342-350.
19.Aishima T.Correlating sensory attributes to gas chromatography-mass spectrometry profiles and e-nose responses using partial least squares regression analysis.Journal of Chromatography A,2004,1054(1-2):39-46.
20.Marin-Galiano M,Kunert J.Comparison of ANOVA with the Tobitmodel for analysing sensory data.Food Quality and Preference,2006,17(3-4):209-218.
21.St-Pierre F,Achim A,Stevanovic T.Cmposition of ethanolic extracts of wood and bark from Acer saccharum and Betula alleghaniensis trees of different vigor classes.Industrial Crops and Products,2013,41:179-187.
22.Pizarro JN,Guerrero E,Galindo PL.Multiple comparison procedures applied to model selection.Neurocomputing,2002,48(1-4):155-173.
23.Branden KV,Hubert M.Robustness properties of a robust partial least squares regression method.Analytica Chimica Acta,2004,515(1):229-241.
24.Farahani HA,Rahiminezhad A,Same L,Immannezhad K.A comparison of Partial Least Squares(PLS)and Ordinary Least Squares(OLS)regressions in predicting of couples mental health based on their communicational patterns.Procedia Social and Behavioral Sciences,2010,5:1459-1463.
25.Owuor PO,Wachira FN,Ng'etich WK.Influence of region of production on relative clonal plain tea quality parameters in Kenya.Food Chemistry,2010,119:1168-1174.
26.Owuor PO,Obanda M,Nyirenda HE,Mandala WL.Influence of region of production on clonal black tea chemical characteristics.Food Chemistry,2008,108(1):263-271.
27.Santonico M,Bellincontro A,Santis DD,Natale CD,Mencarelli F.Electronicnose to studypostharvestdehydration of winegrapes.Food Chemistry,2010,121:789-796.
28.Song S,Zhang X,Hayat K,Jia C,Xia S,Zhong F,Xiao Z,Tian H,Niu Y.Correlating chemical parameters of controlled oxidation tallow to gas chromatography-mass spectrometry profiles and e-nose responses using partial least squares regression analysis.Sensors and Actuators B:Chemical,2010,147:660-668.
29.O'Sullivan MG,Byrne DV,Jensen MT,Andersen HJ,Vestergaard J.Acomparison of warmed-over flavour in pork by sensory analysis,GC/MS and the electronic nose.Meat Science,2003,65(3):1125-1138.
30.Lerma NLD,Bellincontro A,Mencarelli F,Moreno J,Peinado RA.Use of electronicnose,validated by GC-MS,to establish the optimumoff-vine dehydration time of wine grapes.Food Chemistry,2012,130:447-452.

- 茶叶的其它文章
- Effects of Brewing Conditions on Quality of Pu'erh Tea Infusion
- Analysis of Volatile Compounds of Jinmudan Oolong Tea by Different Wrapping-Twisting
- Stability of Tea Catechins and Antioxidant Properties of Green Tea Extracts as Affected by Boiling-treatment
- Oxidative Stability of Green Tea Extract-Enriched Rice Bran Oil During Storage
- The 30-Day Oral Administration Studies of Liposoluble Tea Polyphenols in Rats
- Effects of Tannic Acid on Active Aluminum Species Distribution in Various Tea Soils