高比表面积Y-掺杂二氧化铈纳米颗粒和纳米棒的制备及电学性质
2013-10-17 03:02:58王震平刘晓飞李国祥陈晓霞
无机化学学报 2013年1期
王震平 刘晓飞 李国祥 陈晓霞
(1内蒙古科技大学化学与化工学院,包头 014010)
(2内蒙古自治区计量测试研究院,呼和浩特 010020)
0 Introduction
Inorganic nanoparticles have many excellent sizeor shape-dependent properties such as sintering rates,sintering temperature,optical,electrical,and magnetic properties compared to the micrometer-sized powders[1-2].As one of the most important rare earth materials,ceria nanoparticles have been extensively studied because of their extensive application in solid oxide fuel cell(SOFC),catalysts,oxygen sensors,polishing materials,UV filters,etc.Therefore,a great deal of efforts has also been devoted to synthesis of the nanostructured cerium oxides by means ofone-pot approach,hydrothermal route,solvothermal synthesis,microemulsion,thermal decomposition,and sol-gel method[3-8].In recent years,since high surface area ceria nanoparticles show superior physical and chemical properties to bulk particles,much effort has been focused on decreasing the grain size into nanometer range,increasing specific surface area and narrowing particle size distribution to enhance catalytic activity,sinterability,and other properties[9].
As known,the cerium oxides with the fluorite structure are considered as good oxygen-ion conductors and one of the most promising electrolyte materials for intermediate-temperature SOFC because of their excellent ionic conductivity values when doped with divalent or trivalent cations,which is similar to that of Yttria-stabilised zirconia (YSZ)[10-11].Considering the relative abundance of rare earth elements,Y-doped ceria is a low-cost alternative for the electrolyte component in SOFC,and Y-doped ceria materials possessing high specific surface area would have high surface energy so as to easily fabricate ceramic electrolyte within shorter sintering time.In addition,to the best of our knowledge,there is no report to date whether different morphologies of Y-doped ceria powdershave influence on their properties.
In this work,a set of high surface area and high yield Y-doped ceria nanoparticles and nanorods were synthesized via a facile room-temperature aging and hydrothermal treatment of as-precipitated homogeneous colloids, respectively, and further characterized by XRD,TEM,SAED techniques.The effect of doping concentration and particle morphology on the physisorption property and impedance spectra of the Y-doped ceria powders was investigated in this study.The surface area and conductivity of the assynthesized ceria nano-powders were enhanced by this simple method.
1 Experimental
All chemicals were analytical grade and used without further purification
Y-doped ceria nanoparticles:A total1mmol mixture of Ce(NO3)·6H2O and Y(NO3)·6H2O dissolved in 15 mL distilled water with a Y content ranging from 5mol%to 30mol%were heated in the oil bath at 100 ℃ for a few minutes.When a large amount of vapor appeared,20 mL ammonia(NH3·H2O,28%)was added to the solution and very fine precipitates were formed immediately.After one-minute stirring,the flask containing the slurry was quickly taken out of the oil bath,cooled with water to room temperature and aged for 4 d in air atmosphere.Then the precipitates were separated by centrifuging,washed with distilled water and ethanol three times in turn,and dried at 80 C under air for 12 h.
Y-doped ceria nanorods:To investigate the influence ofdifferentmorphologies,10mol% and 30mol% Y-doped ceria nanorods were synthesized following the above route,butwhen the flask containing freshly precipitated products was cooled to room temperature, the slurry was mixed homogeneously,poured into 50-mL autoclave and the autoclave was heated at 150 ℃ for 24 h instead.Finally,the products were separated and collected by the above procedures.
Y-doped ceria electrolyte:The dried nanoparticle and nanorod powders were ground in an agate mortar and pressed under cool isostatic pressing of 200 MPa into cylindrical pellets (10 mm in diameter and 1.5 mm in thickness).The final pellets for conductivity measurement were obtained by calcining in air at 1 500℃ for 20 min.
Characterization:The TG-DSC measurement was performed with Model STA409 (Netzsch Geraetebau,Selb,Germany)at a heating rate of 10C·min-1from room temperature to 750℃.To investigate the crystalline structure of all the as-prepared samples,the powder X-ray diffraction (XRD)analysis was employed on a 21 kW extra power X-ray diffractometry (Model M21XVHF22,MAC Science Co.,Ltd.,Japan)using Cu Kα radiation (λ=0.154 18 nm)in the range of 20°~60°at room temperature.The lattice parameter (a)was calculated by the softwares Powder-X and TREOR[12].The crystallite size(DXRD)calculated from line broadening of the (111)XRD peak can be estimated according to the Scherrer equation (D=0.9λ/(βcosθ))[13].Particle sizes and morphologies were examined by transmission electron microscopy (TEM;Model 100CXII,JEOL,Japan)operated at100 kV.The selected-area electron diffraction (SAED)pattern of products was also collected from the TEM studies.
Physisorption properties: With the help of software Autosorb-I-Version 1.51,the specific surface area (SBET)and average pore diameter (d)were measured by nitrogen adsorption at-78℃,using Autosorb Analyzer(Quantachrome Co.Ltd.USA),and the measurements were performed after degasing the samples at 300℃ for 12 h under vacuum.The particle size DBETwas estimated from the formula:DBET=6 000/(ρ×SBET),where ρ is the theoretical density ofthe powder (7.13 g ·cm-3).The degree of agglomeration of the obtained particles was evaluated via DBET/DXRD[14].The pore volume (VBJH)and pore size distribution were investigated from the desorption branch of the isothermal on the basis of BJH method[15].
Impedance spectra: For conductivity (σ)measurement,platinum paste was painted onto both sides of the pellet,and baked at 800℃for 30 min to burn out organic binder and form Pt electrodes.The impedance spectra study was carried out on the symmetrical cell of type (Pt|Sample |Pt)in air and measured as a function of frequency (0.1 Hz~1 MHz)between 350 and 850℃using Solartron 1287 and 1 255 B.The impedance spectra data were analyzed by Equivalent Circuit of ZSimpWin 3.10 software.The apparent activation energy for conduction was estimated from the Arrhenius plot.
2 Results and discussion
Fig.1 showstheXRD pa tternsofthe assynthesized YxCe1-xO2-0.5xnanoparticles and nanorods.All the samples appear in the same phase of pure fluorite cubic structure (PDF No.34-0394,space group Fm3m,a=0.541 13 nm),which confirms the complete dissolution of Y dopant in the ceria.The broadening of the diffraction peaks distinctly indicates the formation ofnanocrystals.Both the average crystallite sizes (DXRD)and lattice constants (a)of YxCe1-xO2-0.5xdecrease with the x(see Table 1)in good agreement with effective ionic radii consideration(rYバ,0.115 9 nm)[16].And the lattice parameters (a)of the nanorods are a bit larger than that of corresponding particles at the same Y-doped concentration.

The TG-DSC curve of Y0.3Ce0.7O1.85nanoparticles is illustrated in Fig.2.It shows a 5.84%total weight loss in TG curve,which is associated with the loss of absorbent and lattice water.This is indicated in the DSC curve with two endothermic peaks at 88℃and 284℃attributed to the loss of water on surface and in lattice of the samples,respectively[17].

The TEM micrographs and the SAED patterns of of YxCe1-xO2-0.5xnanoparticles (x=0.1 and 0.3)are shown in Fig.3a and 3b.It is observed that largescaled nanoparticles are obtained and well monodispersed with particle size about 10~30 nm.The imagewith SAED pattern demonstratesthatthe prepared nanoparticles are polycrystalline ceria with a cubic fluorite structure consistent with the XRD measurements.Moreover,it also can be seen that the images of Y0.1Ce0.9O1.95nanoparticles show clearer grain boundaries and stronger polycrystalline SEAD ring patterns than that doped with 30mol%Y,suggesting that more doped yttrium is helpful to reduce the particle sizes and give rise to much smaller ceria nanoparticles without agglomerates.As shown in Fig.3c,large-scaled uniform Y0.3Ce0.7O1.85nanorods with about 30 nm in diameter and 100~300 nm in length aresynthesized underhydrothermalcrystal-growth conditions.Correspondingly,the SAED ring patterns reveal polycrystallinity of the as-obtained nanorods and are also indexed to cubic fluorite structure.
The specific surface area(SBET)calculated by the Multipoint-BET method,the pore volume (VBJH)calculated by the BJH method,and average pore diameter (d)of all the Y-doped ceria nanoparticles and nanorods are summarized in Table 1.

Table 1 Lattice Parameter(a),Average Pore Diameter(d),and BJH Pore Volume(VBJH),BET Surface Area(SBET),Aglomeration Degree(DBET/DXRD)of YxCe1-xO2-0.5xnanoparticles and nanorods and Relative density of corresponding electrolyte ceramics
Among them,the SBETof all the as-prepared samples are much higher than that of bulk ceria powders (~4 m2·g-1),while the average pore diameter of the products are much smaller than the bulk one(~31.86 nm).The SBETof Y0.3Ce0.7O1.85nanoparticles are up to 197 m2·g-1which exceeds those of as-reported ceria-based nanoparticles prepared by salt-assisted solution combustion synthesis (157 m2·g-1)[18],coprecipitation technique (110 m2·g-1)[19],microwaveinduced combustion process (34 ~44 m2·g-1).Mean particle sizes(DBET)of YxCe1-xO2-0.5xare calculated from the specific surface area data according to DBET=6 000/(ρ·SBET)(see Table 1)and decreased linearly with x.The degree of agglomeration of the obtained particles is estimated via DBET/DXRDand the ratios are nearly equal to 1,which reveals less agglomeration of asprepared samples.As to the nanorods,the SBETvalues of 10mol%and 30mol%Y-doped products are also higher than that of the bulk one,but smaller than that of nanoparticles.Correspondingly,the average pore diameter and agglomeration degree are larger than that of nanoparticles,it might be ascribed to the hydrothermal conditions,under which thecolloid precipitate tends to crystallize well and grow to larger sizes.

Nitrogen adsorption-desorption isotherms of Y0.3Ce0.7O1.85nanoparticles and nanorods are presented in Fig.4.On the basis of BJH method,the pore size distribution curves are drawn from the desorption branchs of the isothermals and also inserted into Fig.4.The pore size distribution results suggest the narrow pore size distribution ranges ofY-doped ceria nanoparticles mainly locate at~38 nm(Fig.4a).It can be also noticed that all curves represent only one peak,which indicates that the particles are uniform and less agglomerate.However,the pore size distribution curves of Y0.3Ce0.7O1.85nanorods exhibit multi-peaks at about 28 nm and 40 nm (Fig.4b),that is,the nanorods distribut inhomogeneous and are not seriously agglomerated compared to the nanoparticles.In addition,the relative density of YxCe1-xO2-0.5xnanoparticles and nanorods electrolytes (x=0.1 and 0.3)are all above 94%(see Table 1),which indicates that as-prepared Y-doped ceria nanopowders with high specific surface area could be easily sintered to dense ceramic electrolyte within shorter time.
The impedance spectra and equivalent circuit model of Y0.3Ce0.7O1.85nanoparticles measured at 450℃ are shown in Fig.5,in which two distinct semicircles are bulk and grain-boundary response of the Y-doped ceria electrolyte.Various contributions could be distinguished from each other with the aid of the equivalent circuit model(Fig.5 inset).Rbis bulk resistance,Rgbis grain-boundary resistance,Rctis the resistances on electrode interface.CPEgbis grain boundary capacitance,and CPEctis electrode interface capacitance.The total resistance of electrolyte:


And the resistance data measured at different temperatures can be converted to a conductivity σ,using the equation:
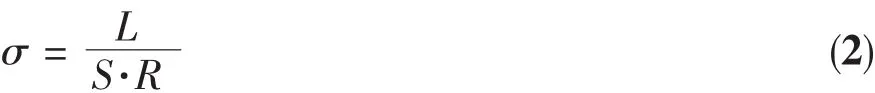
where L is the pellet thickness and S is the electrode area on the pellet surface.
Arrhenius plots of total electrical conductivities for Y-doped ceria ceramics measured in air at 350~850 ℃ are shown in Fig.6 in the form of ln(σT)versus 1 000 T-1.And the conductivity data are analyzed further using Arrhenius equation:

where Eais the activation energy of electrical conduction,κ the Boltzmans constant,T the absolute temperature and A the pre-exponential factor being a constant in a certain temperature range.

The composition dependence of both the total electrical conductivity and apparent activation energy are consistent,with a maximum totalelectrical conductivity (4.32 S·m-1at 850 ℃)and minimum apparent activation energy (0.81 eV) at the Y0.3Ce0.7O1.85nanoparticles electrolyte.With increase of Y dopping amount, the electrical conductivity increases and activation energy decreases,respectively,and the conductivity of nanorods is also smaller than that of nanoparticles with the same Y content.This could be ascribed as follows:firstly,the electrical conductivity of Y-doped ceria is high related to oxygen defect and transportation of oxygen ions,with increase of Y content,the concentration of oxygen vacancy increases,so as to improve the conductivity accordingly[20];secondly,smaller grain size and higher surface area for ceria by Y doping facilitatethesinteringpropertiesforhigh dense ceramicelectrolyte,which reducesthe activation energy for electrical conduction and enhances the conductivity of electrolyte[21].
3 Conclusions
Shape-controllable s ynthesis of large-scaled Y-doped ceria nanoparticles and nanorods are achieved by a simple room-temperature aging and hydrothermal treatment route of high-temperature precipitates.The morphology,surface area and particle size of the asprepared nanopowders are greatly improved via introduction of Y doping.The highest specific surface area (SBET)of 197 m2·g-1and narrow BJH pore size distribution range of~38 nm are achieved in 30mol%Y-doped ceria nanoparticles.The impedance spectra of Y-doped ceria electrolytes sintered at 1 500℃are measured in air at 350~850 ℃,higher conductivity and lower activation energy are obtained with increase of Y-doped content.In addition,the nanoparticle powders with smaller particle size and higher surface area are more easily sintered and densified,so the electrical conduction of the electrolyte is better than that of nanorods with the same Y content.It has demonstrated in this paper that,by Y doping and appropriate crystal-growth route,a simple approach is employed to form the morphological controlled and high surface area ceria-based nanomaterials which could be easy to sinter within shorter time to produce dense ceramic electrolyte with better electrical properties.
[1]Feng X D,Sayle D C,Wang Z L,et al.Science,2006,312:1504-1508
[2]Van Herle J,Horita T,Kawada T,et al.Solid State Ionics,1996,1255:86-88
[3]Yang S W,Gao L.J.Am.Chem.Soc.,2006,128:9330-9331
[4]Guo Z Y,Du F L,Li G C,et al.Inorg.Chem.,2006,45:4167-4169
[5]Yan L,Xing X R,Yu R B,et al.Physica B,2007,390:59-64
[6]Bumajdad A,Zaki M I,Eastoe J.et al.Langmuir,2004,20:11223-11233
[7]Wang Y,Mori T,Li J,et al.J.Am.Ceram.Soc.,2002,85:3105-3109
[8]Hartridge A,Bhattacharya A K.J.Phys.Chem.Solids,2002,63:441-448
[9]Zhang Y W,Si R,Liao C S,et al.J.Phys.Chem.B,2003,107:10159-10167
[10]Steele B C H.Solid State Ionics,2000,129:95-110
[11]Zhou Y C,Rahaman M N.J.Mater.Res.,1993,8:1680-1686
[12]Dong C.J.Appl.Cryst.,1999,32:838-838
[13]Guinier A.Theorie et Technique de la Radiocristallographie.3rdEd..Paris:Dunod,1964:114-116
[14]Fu Y P,Lin C H.J.Alloys Compd.,2005,389:165-168
[15]Barrett E P,Joyner L G,Halenda P H.J.Am.Chem.Soc.,1951,73:373-374
[16]Shannon R D.Acta Crystallogr.,1976,32A:751-767
[17]Djuricic B,Pickering S.J.Eur.Ceram.Soc.,1999,19:1925-1934
[18]Chen W F,Li F S,Yu J Y,et al.Mater.Sci.Eng.B,2006,133:151-156
[19]Tadokoro S K,Porfírio T C,Muccillo R,et al.J.Power Sources,2004,130:15-21
[20]Wang Y R,Mori T,Li J G,et al.J.Eur.Ceram.Soc.,2005,25:949-956
[21]Tadokoro S K,Muccillo E N S.J.Alloys Compd.,2004,374:190-193
猜你喜欢
光子学报(2022年5期)2022-06-28 09:24:42
建材发展导向(2019年8期)2019-05-13 01:09:10
山西青年(2016年24期)2016-02-04 05:41:49
创新科技(2015年3期)2015-12-24 06:23:34
亚太教育(2015年18期)2015-02-28 20:54:31
应用化工(2014年9期)2014-08-10 14:05:08
大学化学(2012年1期)2012-03-31 21:34:16
大学化学(2011年5期)2011-04-02 16:26:27