Modeling Optimal Fare and Service Provisions for a Crowded Rail Transit Line
2013-09-25 13:13:14QINFeifeiJIAHaicehng
交通运输系统工程与信息 2013年2期
QIN Fei-fei,JIA Hai-cehng
(1.Dep.of Economics and Social Science,Molde University College,Molde N-6402,Norway;2.School of Urban Rail Transportation,Soochow University,Suzhou 215006,Jiangsu,China;3 Dep.of Logistics,Suzhou University of Science and Technology,Suzhou 215011,Jiangsu,China)
1 Introduction
Over the lastdecade urban scale and car ownership are both on a substantial growth,leading to increasing traffic congestion and environmental pollution.To help alleviate congestion and protect the environment,the enthusiasm forconstructing rail transit lines is booming in China.In the end of 2008,11 cities had rail transit lines in operation.However,the expected modal shift toward rail transit will only occurifitcan offergreatadvantagesoverits competing modes. Thus,designing an efficient operational scheme has far-reaching impacts not only on the transit line itself,but also on the overall urban transport system.
In the strategic and tactical planning,fare,frequency and number of carriages are three key design variables[1].Irrespective of ownership,most rail transit operators in China set fares roughly to cover a fixed percentage of total costs and determine frequency according to the rule of thumb of“Maximum Section Load”.Obviously,these decision rules fail to make resources reach Pareto Optimality.To determine what“optimal operational configuration”would look like,we jointly optimize fares,frequency and numberofcarriagesunder alternative management objectives by taking some relevant“externalities,”such as in-vehicle crowding,congestion-relief benefitand noise pollution into consideration.
The rest of the paper is structured as follows:in Section 2,an in-depth literature review on optimal operation design is presented from two distinct strains.In Section 3,having taken both positive externality and negative externality into account,micro-economic models for profit and social welfare maximization are presented to provide explicit decision rules for fares,frequency,and number of carriages.Furthermore,the comparative static analysis(CSA)is employed to compare the relative order of magnitude between social welfare optima and profit optima.In Section 4,we conduct a detailed numerical case study for Suzhou rail transit line 1 to assess its current operating scheme.Finally,the major findings are summarized in Section 5.
2 Literature review
As a response to the substantial change of the urban transport environment,a large body of researches has been increasing over several decades.Particularly,after the appearance of the seminal paper written by Vickrey[2],numerous efforts have been made from two distinct strains in urban transportation economies.
The first strain directly concerns minimizing“totalsystem costs”.Assumingthe demand is inelastic,it involves a trade-off between two types of resources:those provided by operators and those contributed by passengers—namely their time.This approach was first addressed by Mohring[3,4]and has been extended to include more factors by Jansson et al.[5-8]and recently by Jara-Díaz et al.[9-11].Specific contributions foreach paperin thisstream are presented in Table 1.
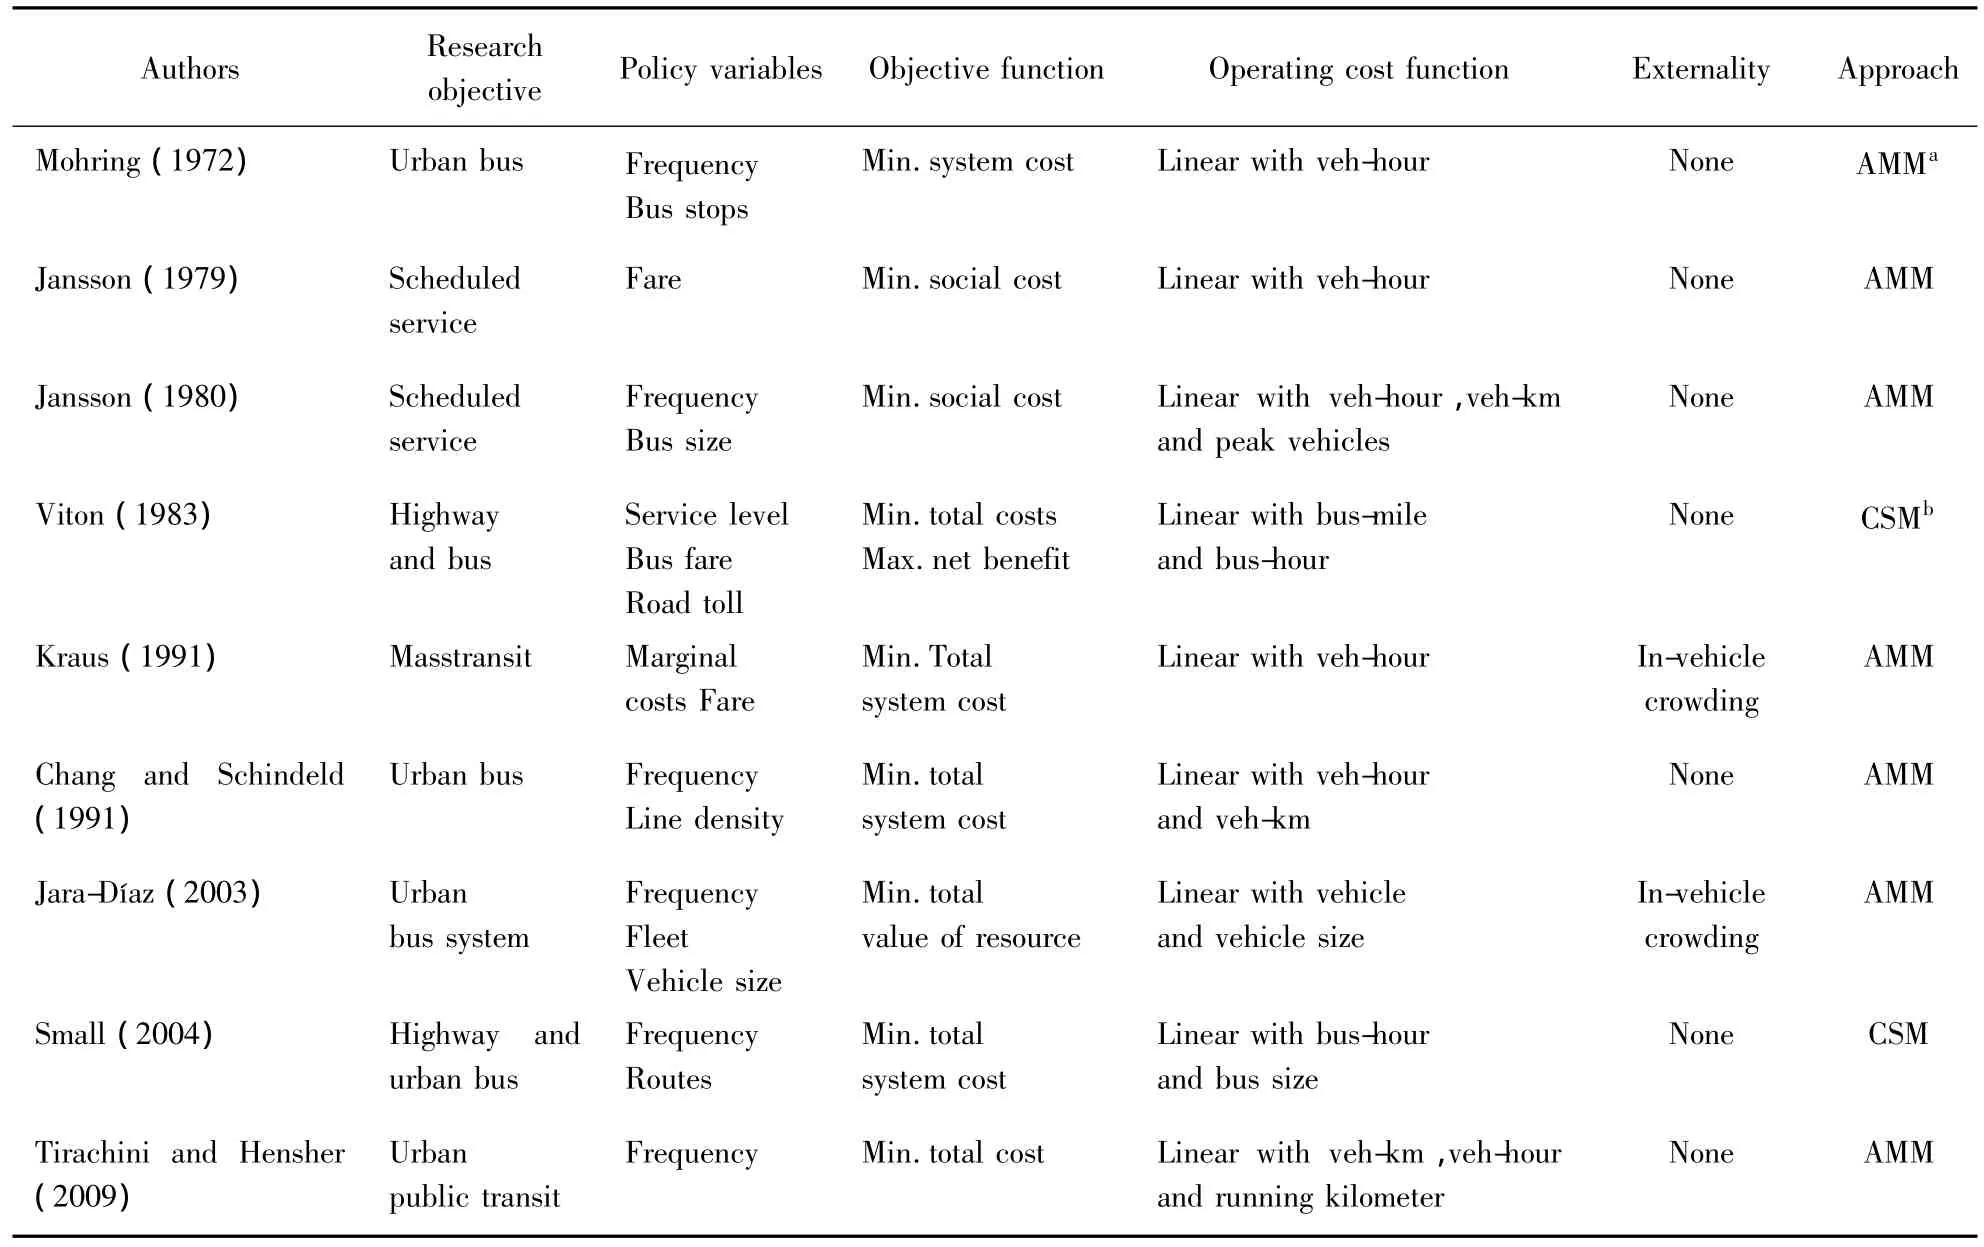
Table 1 Literatures of minimizing total system costs for inelastic demand

Table 2 Literatures of maximizing social welfare for elastic demand
In the last decades,although this approach has provided a good guide to improve transit operations,a minor drawback can be easily detected,that is,this approach is merely restricted to the supply side so that passengers’responses to different service levels are left out or hidden behind the user cost concept.Having observed this,the second strand of research emphasizing passengers’reactions to various service combinations should be modeled through the generalized cost-based functions.This approach was put forward first by Nash[12]and then was proved to be rational by Larsen[13].Pertinent references for this approach are Viton et al.[14–19].The summary of important studies in this strand is presented in Table 2.
In view of the above literatures,it seems that although the bus systemoptimization has received great attention,relatively few efforts have been devoted to the rail transit services,which is the central concern here.The present paper contributes to the existing literatures in two ways.First,the train length,reflected by the number of carriages per train,is optimized in addition to the convention control variables,such as fares and frequency.Another feature that differentiates this paper from previous studies is the incorporation of in-vehicle crowding effect into the operation optimization,which is captured by replacing the constant value of riding time with the proposed invehicle crowding cost function.
3 Theoretical modeling for rail transit operational configurations
3.1 Building blocks for analytical mathematical models
We consider one representative passenger traveling along one rail transit line during a particular period,and his/her traveling choice is based on the generalized cost(G).Hereby,the demand(Q)can be written as:

We assume the demand function is concave with respect to generalized costs,which indicates∂Q/∂G<0 and ∂2Q/∂G2≥ 0 .The generalized cost function comprises the fare charged(p),the riding time costs(Cv)and the waiting time costs(Cw):

where the in-vehicle time(Tv)and waiting time(Tw)can be converted to monetary values using the value of riding time(Pv)and the value of waiting time (Pw),respectively.Many empiricaland theoretical researches revealed that standing passengers virtually place higher values of riding time than seated passengers do[20].Known as the earliest work,Kraus[21]advocated that the disutility arising from in-vehicle crowding can be considered through a variable value of riding time,which increases with occupancy rate or load factor.Following this,the value of riding time can be decomposed into two parts by introducing the crowding penalty function,ρ,for standing:
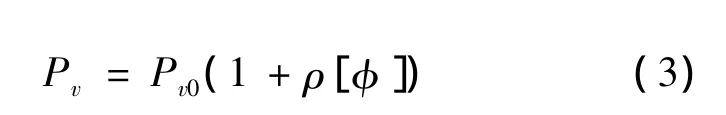
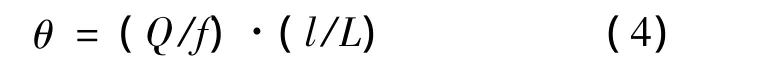
wherePv0is the value of riding time for seating.As a mark-up,the crowding penalty(ρ)varies with the load factor(φ),which is the fraction of the average number of passengers(θ)per departure to the total seating capacity of the train.Iflis the average trip length andLdenotes the route length,the average number of passengers on-board,θ,can be written as:
Since we adopt number of carriages per train(N)as one of the control variables,the total seating capacity per departure is the product of number of carriages(N)and the number of seats per carriage(σ).Ultimately,the load factor can be expressed as:
In terms of high-frequency rail transit service,the well-known“wait equals half of the headway”rule can be regarded as a good approximation to represent the average waiting time.Combining all formulas proposed above,the detailed form of the generalized cost is:
Generally,the total operating costs comprise two parts:fixed costs and variable costs.In the short term,fixed operational costs are such costs that do not vary with outputs.Since the fixed cost component is not relevant to the optimal operation decisions,we can disregard them and only consider variable operating costs.To this end,the variable operating cost can be modeled as:
whereCois the variable operating costs per hour;c2is the cost proportionate to ridership;c1denotes the incremental cost per departure.Generally,we can assumec1[N]is linear with the number of carriages as

whereK1stands for the fixed parts that does not vary with the train length andK2is the extra costs of adding one more carriage.It is clear that the operating cost function is slightly convex,i.e.,almost linear.
From a social macroscopic point of view,the consumer surplusshould beincluded asakey component of social welfare.Commonly,the aggregate consumer surplus can be expressed as the integral function of generalized costs(G):

whereSdenotes the consumer surplus,which follows that∂S/∂G=-Q.
In the case of rail transit,the external effects can be divided into two parts:negative and positive externalities.The main negative externality is noise pollution,which can be treated as varying linearly with frequency.Since one of the important reasons for operating rail transit along arterial roads is to relieve congestion,another external effect is the benefit from congestion relief.Forthe ease ofmodeling,the external benefit of improving traffic congestion is specified as a function of patronage that transfers from private cars.

whereEBdenotes the external benefit function and parameter γ is the percent of passengers that transfer from private cars.ECis the marginal external cost of running one additional train.Consequently,this type of external cost is linearly proportional to the service frequency(EC·f).
3.2 Optima under two advocated management objectives
3.2.1 Social welfare maximization optimal results
The socialwelfare maximization solution is always viewed as an ideal benchmark to evaluate the efficiency of operation schemes.In this sub-section,wefirstassume thatin the pursuitofPareto efficiency,the public authority aims to maximize social welfare(SW),which can be expressed as the sum of consumer surplus and producer surplus,but necessarily should be supplemented by the external costs from noise pollution and the external benefits from relieving surface congestion.

It is easy to prove that the Hessian matrix of the second derivative of Eq.(11)with respect to control variables is negative semi-definite.Thus,we can rely on equating the first derivatives to zero to express the decision rules for three control variables.
Firstly,taking the partial derivatives of Eq.(11)with respect to fares gives:
By setting Eq.(12)equal to zero and factoring out the non-zero item ∂Q/∂p,the optimal fare per trip(pw)can be written as:
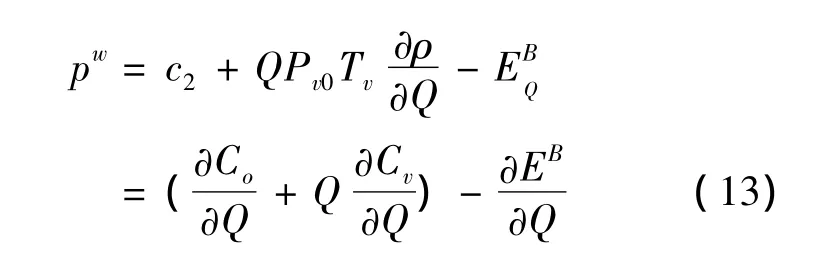
In what follows,for distinguishing maximizing outputs under different management objectives,the superscriptWindexes the social welfare optimum,and the super index π denotes the profit maximization results.
Without a budget constraint,the welfare optimal price comprises three parts:the first part is the marginal production cost(c2).The second part is the marginal in-vehiclecrowdingcostsQ(∂CV/∂Q),which can be viewed as a“mark-up”component to internalize the in-vehicle crowding costs that passengers impose on each other.The third part is the additional external benefits arising from inducing passengers from the under-priced automobile use(∂EB/∂Q).Furthermore,in Eq.(13),the first two terms(Q(∂CV/∂Q)andc2)reflect the marginal cost inside the rail transit system,which can be named the inner-system marginal cost.While the third term captures the marginal effect on non-rail transit users,we can define it as the outer-system marginal cost.Although the sign of social optimal price(pw)is ambiguous,some interesting findings can be found.Firstly,if private cars can be sufficiently charged in congested conditions,the external benefit term from alleviating surface congestion (∂EB/∂Q)may disappear.In this case,the expression for the socially optimal fare is simplified to only include the innersystem marginalcost,which definitely takesthe positive sign.Furthermore,if the in-vehicle crowding is modest so that the crowding mark-up can be disregarded(i.e.,Q(∂CV/∂Q)),thesocially optimal fare is well below the average variable costs,resulting in a financial deficit.On the other hand,if the level of crowding is so severe that most passengers have to stand in the crowded coaches,charging the socially optimal fare may generate profit for running the rail transit in densely populated areas.Secondly,if the road congestion cannot be effectively internalized,the more serious the congestion is,the lower the socially optimal price could be.In some extreme cases,under-priced car traffic could lead to rail transit fares being negative.The negative fares mean instead passengers pay for their trips;the transit authority should provide subsidies to encourage private car users to switch their traveling modes.Similarly,the rationality to charge negative transit fares under the second-best condition is also discussed by many transportation economists[10,22,23], implying the robustness of the present result.
By partially differentiating Eq.(11)with respect to frequency and making it equal to zero,the optimal frequencyfwcan be obtained as:

From Eq.(14),it is worth noting that if the number of carriages is exogenously given,the optimal frequency follows a modified version of the“square root formula”.More specifically,for the case of low and moderate demand,the first term(Pw/2)in the parentheses dominates over the second term,which indicates that the optimal frequency increases proportionallywith the square rootofdemand.Whereas in the case of higher demand the crowding externality will cause the second term tobe a dominant term,so that the optimal frequency would be approximately proportional to the total demand.As for the massive capacity mode running in high-density corridors,the latter case is more likely to happen than the former one.Thus,the policy recommendation is that when it is impossible to act on the train length,the social optimal reaction to soaring demand is to make the frequency proportional to the total demand,not to the square root of the demand.In what follows,to simplify the expression,we denote ∂ρ/∂φ as ρφ.Similarly,the optimal number of carriages per train,Nw,can be derived as:

The ultimate expression for optimal frequency and numberofcarriages can be obtained by simultaneously solving Eqs.(14)and(15),which yields:
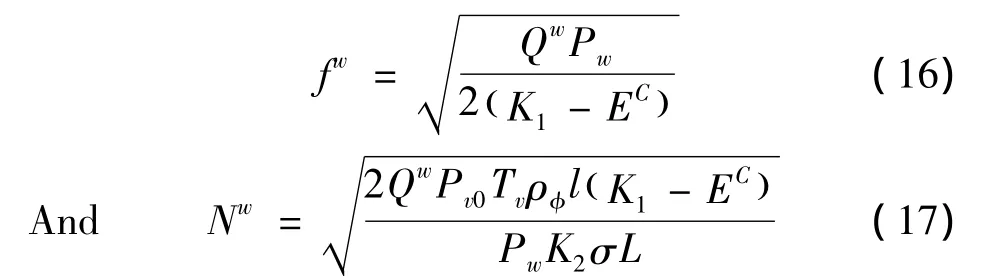
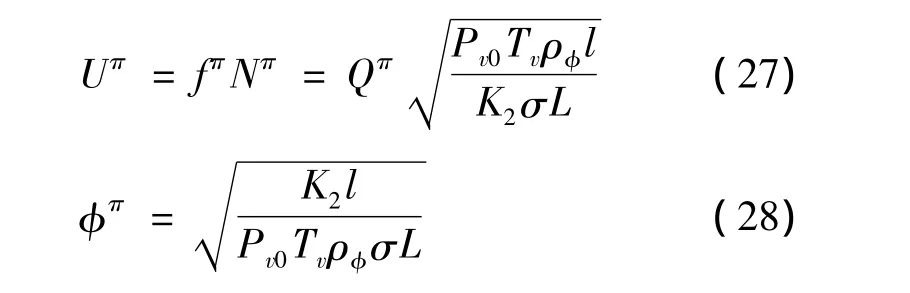
To reflect the total holding capacity of each departure,we introduce a new variable,U,which is the product of service frequency(f)and the number of carriages(N).As a result,by multiplying Eqs.(16)and(17),the total number of carriages per hour can be presented as:

Substituting Eq.(18)into Eqs.(3)and(4)yields the optimal load factor ΦW.

3.2.2 Profit maximization optimal results
Suppose that rail transit services are provided by acommercialmonopolist.Thus,the management objective for this can be presented as:

Given the profit function in Eq.(21),the firstorder condition with respect to price can be expressed as:

Through mathematical manipulation,the decision rules for the profit maximizing frequency are given by:

With the same approach,we can derive the following formulas to obtain the corresponding number of carriages under profit maximization:

Analogously,simultaneously solving Eqs.(23)and(24)yieldsthedecision ruleforoptimal frequency and numberofcarriagesunderprofit maximization:

Comparing Eq.(16)with Eq.(25)and Eq.(17)with Eq.(26),we can conclude that in the absence of externality,the decision rules of service provisions are independent on the type of management objectives and keep the same form.But this does not mean the values are identical in these two cases.
Following the same procedure as before,we can derive the total holding capacity and optimal load factor for profit maximization:
It is interesting to note that no matter which management objective is pursued,the optimal load factors take the same value,suggesting that the crowding levels are identical in both cases.
3.3 Comparison of social welfare optima and profit optima
Clarifying the divergence of profit optima and social welfare optima has received wide attention for many years.It is a standard result that a profitmaximizing monopolist intends to charge a higher fare and offer a lower level of quality than socially desired.Recently,this argument has been challenged by Van Reeven[24].To refute the justification for subsidizing transit arising from Mohring effect,he argued if the operator takes the demand effect of pricing and frequency decisions into consideration,the profit-maximizing monopolist may provide frequency at least as high as the socially optimal frequency.Triggered by this paper,Savage and Small[25]and Basso and Jara-Díaz[26]criticized that Van Reeven’s result isestablished on a very criticaldemand assumption.If this assumption is relaxed,it could give rise to a contrary conclusion.As a reaction to the above criticisms,Karamychev and Van Reeven[27]proposed a rejoinder through generalizing the demand function of Basso and Jara-Diaz[26].
The compassion for the discrepancy in profit and social welfare maximizing is motivated by this current debate.The novelty of this comparison is that besides discussing the relative magnitude of frequency,the number of carriages and the total holding capacity also enter into comparison picture.
The preceding analysis clearly shows that the magnitudes of frequency and number of carriages under profit and social welfare maximization are greatly influenced by their corresponding demand.As a result,we first need to compare the relative order of magnitude betweenQπandQW.TheTopkis’s Theorem adopted in the following comparison is:if∂SW/∂G≥ ∂π/∂Gand two objective functions,SWand π both have increasing differences,we can conclude that

To apply Topkis’s theorem,we regard the demand as an endogenous variable and assume that other variables,such as fare,frequency and numbers of carriages are exogenously given.Partially differentiating the social welfare and profitfunctions in Eqs.(12)and(20)with respect to demand yields:
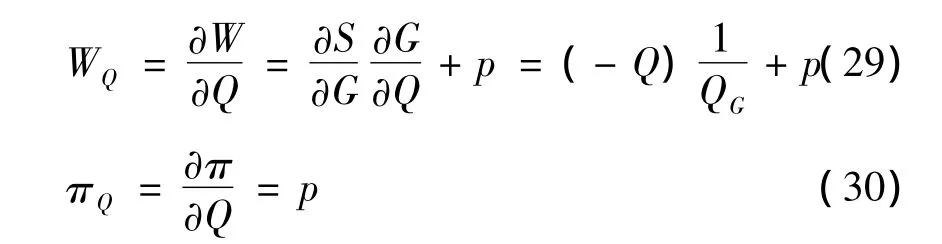
By subtracting Eq.(30)from Eq.(29)and rearranging some items,we get:

Since the demand function is concaved with the generalized costs(that is,∂Q/∂G<0),Eq.(31)takes the positive sign so that we can conclude that∂SW/∂Q≥ ∂π/∂Q.
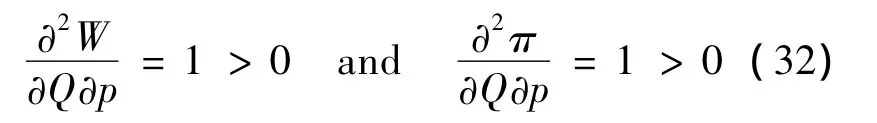
To fulfill thesecond sufficientcondition of Topkis’s Monotonic Theorem that the objective functions should have increasing differences(ID),we take the cross derivative of the objective functions with respect to the fare as:
Holding the validity of the two necessary conditions,we can conclude that the social optimal circumstance characterizes a higher demand than the profit maximization case(Qw>Qπ).Based on the above relative relationship,explicit optimum expressions clearly demonstrate that in any case,the number of carriages and total holding capacity per hour are greater for social welfare maximization than for profit maximization.
Although the relative magnitude for demand,fare and number of carriages is quite clear now,we cannot say whether a profit-maximizing monopolist produces lower or higher frequencies than a social planner does.If the external cost is modest or low,the commercial monopolist would supply frequencies that are less than socially desired.However,if the noise of train vibrations greatly influences residents’lifes,it is possible that the monopolists intend to run more frequent services than the social welfare-maximization operators would do.Accordingly,the consideration of external costs makes the comparison result ambiguous.Since the relative magnitude of frequency between optimal social welfare and profit maximization is theoretically indeterminate,attempts to qualify the relative magnitude will be made through the following empirical case study.
4 Numerical case studies for Suzhou Rail Transit Line 1
4.1 General information about Suzhou Rail Transit Line 1
Conforming to the soaring transport requirement in an urban congested corridor,Suzhou Rail Transit Line 1 was commenced to construct in 2007 and was opened to the public in 2012.As the monopolistic provider,Suzhou Metro Company will retain full responsibility for operating services with freedom to decide levelofservices,fare rates and some necessary investment.Although obtaining the actual patronage and operating cost is impossible before its real operation,the computer-based simulation method can provide relative reliable data and parameters.Here,we will adopt the relevant traffic data and parameters that Suzhou Metro Company used for planning.The notations and values used throughout this paper are summarized in Table 3.
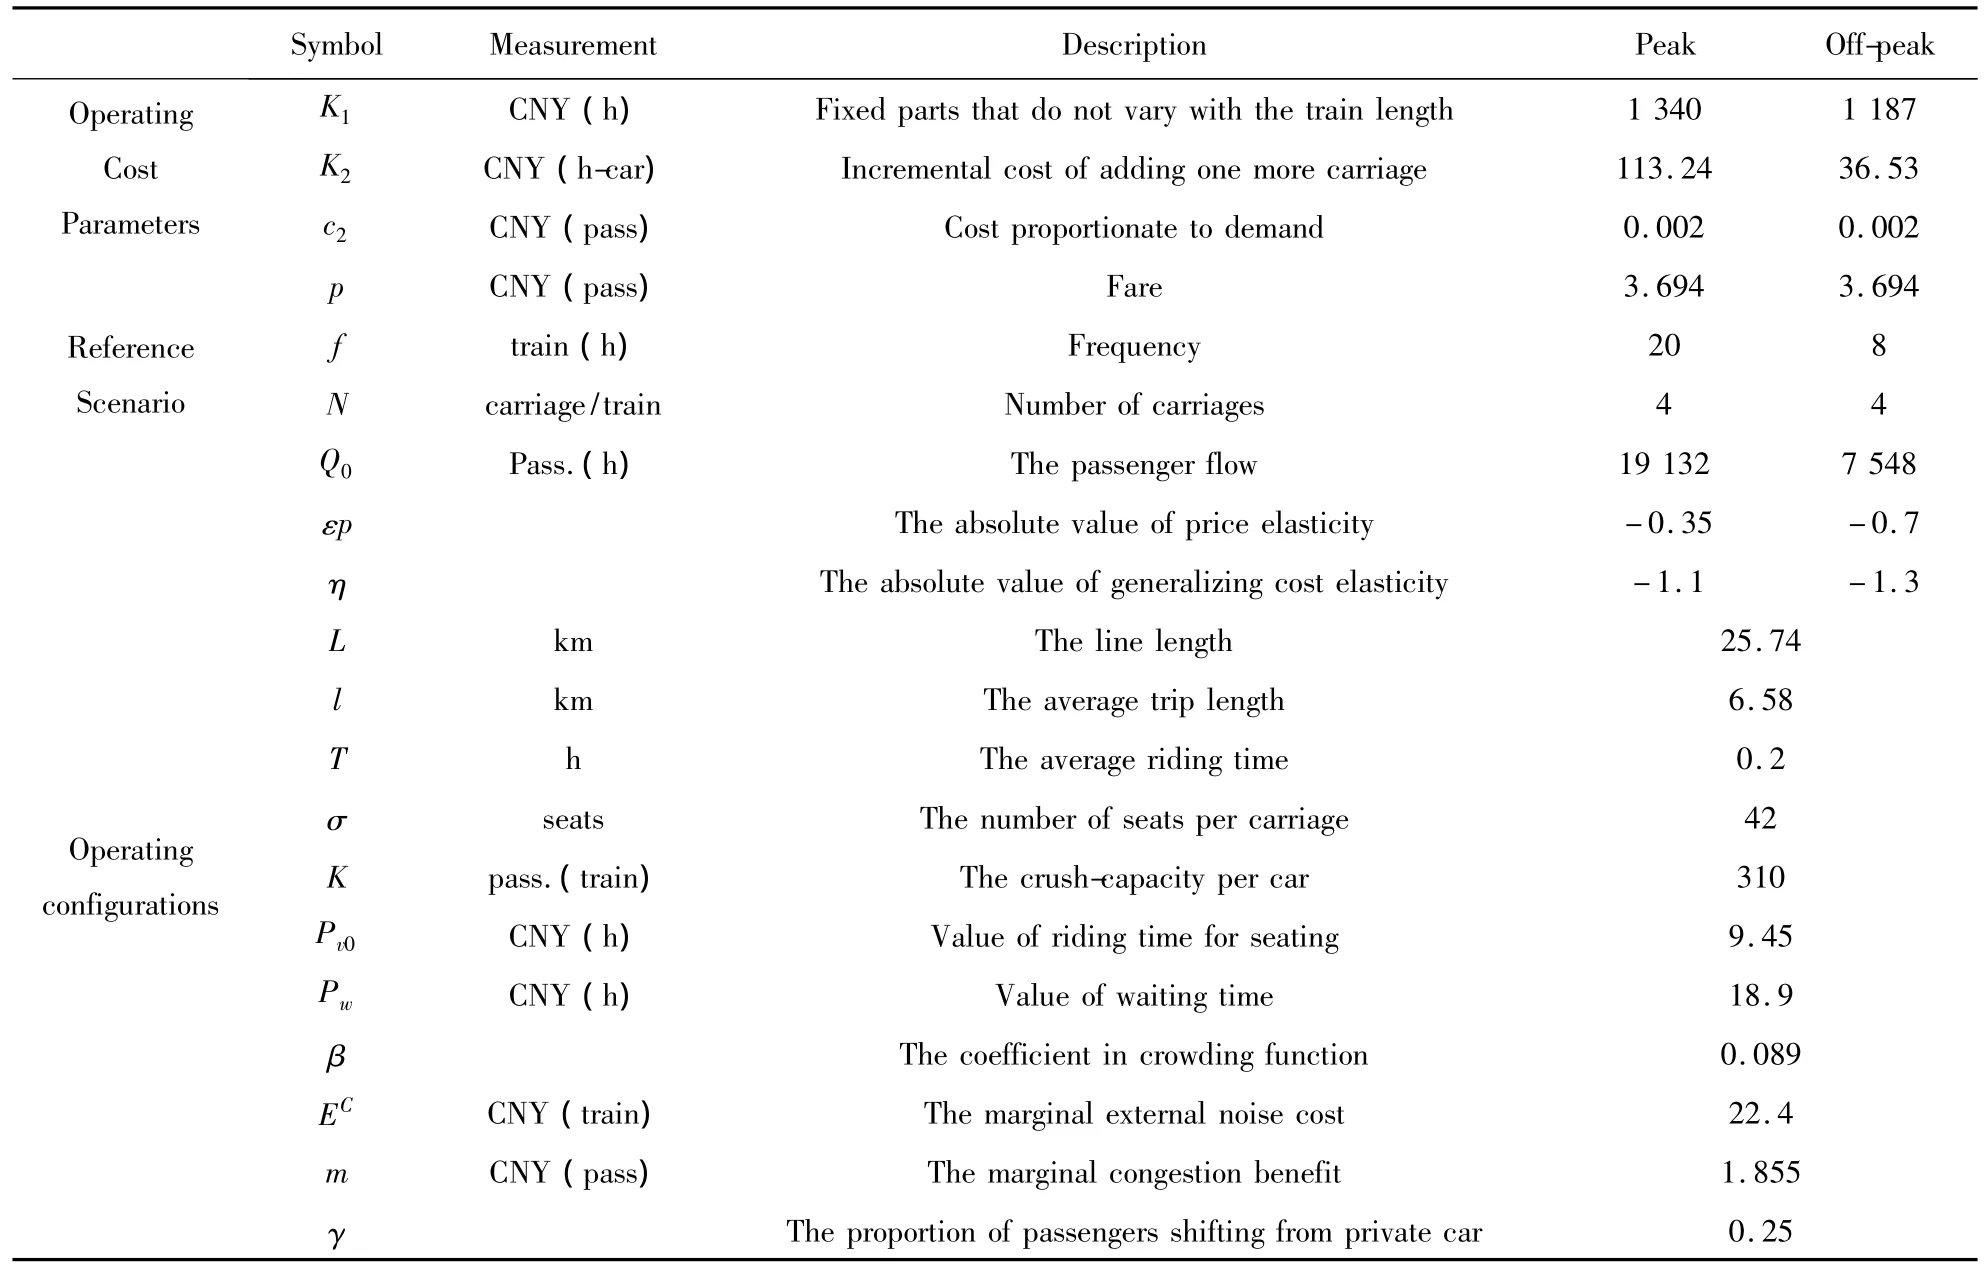
Table 3 Current operation design and parameter values
4.2 Specifications of the explicit function form and data calibration
Following previous modeling,demand function employed is assumed to exponentially depend on generalized cost.

whereAand λ are parameters assigned to the demand function.Based on this demand function form,the elasticity of demand with respect to the fare is λ·pwith λ being positive.
In thispaper,the in-vehicle crowding cost function can be explicitly specified as:

The above non-linear crowding cost function is borrowed from our previous work[28].
Regarding the noise pollution cost,Zhang[29]analyzed the noise pollution by applying a preventive expenditure approach,his estimation is used here.Additionally,from the social welfare points of view,it is necessary to incorporate the decongestion benefits.Larson[30]proposed a simplified formula to calculate the congestion relief benefits for Oslo’s transit system.Following his work,we constructed a similar function to reflect the marginal benefit as the number of private cars is reduced:

wheremis the marginal benefit of one addition rail transit passenger,which is the savings of travel time and other externalities due to the removal of car travel.Q0is the ridership in the initial situation.In 2008,Zhu and Zheng[31]estimated the external congestion cost for private car trips in Shanghai.In the absence of empirical research for Suzhou,a crude value from his work was adopted in this paper.
4.3 Comparisons of four optimal scenarios with designed operation scheme
Given available estimates of the parameters,it is possible to optimize the fare,frequency,and number of carriages by two scenarios:maximizing social welfare(Scenario 1:MAX-SW)and profit(Scenario 2:MAX-π ). Besides these two management objectives,another more realistic management objective is added,thatis the socialwelfare maximization subject to break even(Scenario 3:MAX-SWB).Relevant results are represented in Table 4.
The first row of Table 4 presents fare levels.As expected,there exist substantial gaps between current fares and socially optimal ones.During peak times,the severe congestion in the surface road causes the socially preferable fare to be negative(- 0.13 CNY),whereas the socially optimal fare in the offpeak period is extraordinarily small(0.21 CNY).Thus,relative to the current fare levels,the significant price reductions would be socially beneficial.For profit maximization,fares in both periods turn out to be substantially higher than current price levels.Specifically,prices in the peak rise by 200% as compared to a 50%increase in the off-peak period.In the presence of budgetary constraints,the break-even requirementyields fares that are intermediates between the socially optimal value and the one that would be set by a profit maximizing monopolist.Therefore,if the Suzhou Metro Company is only required to cover operating costs and capital costs of rolling stocks,the current fare level is quite high,calling for the substantial reductions.
The second row of Table 4 depicts the magnitude of frequencies.During the peak period,the value of the socially optimal frequency(13.62 veh/h)is below what is currently offered by the company(20 veh/h),while the optimal frequency provided during the off-peak period is higher than the current operation.As expected,due to the insignificant external noise pollution,the frequency for the profit maximization at any period is well below the socially desired frequency and current operation,which indicates monopolistic operators are intended to under-supply the frequency.Another clear result that emerges from Table 4 is that the imposition of a break-even constraint implies the frequency fell by 35.7 percent in peak time and increased by 14 percentin the off-peak time,compared with frequency in the base case.
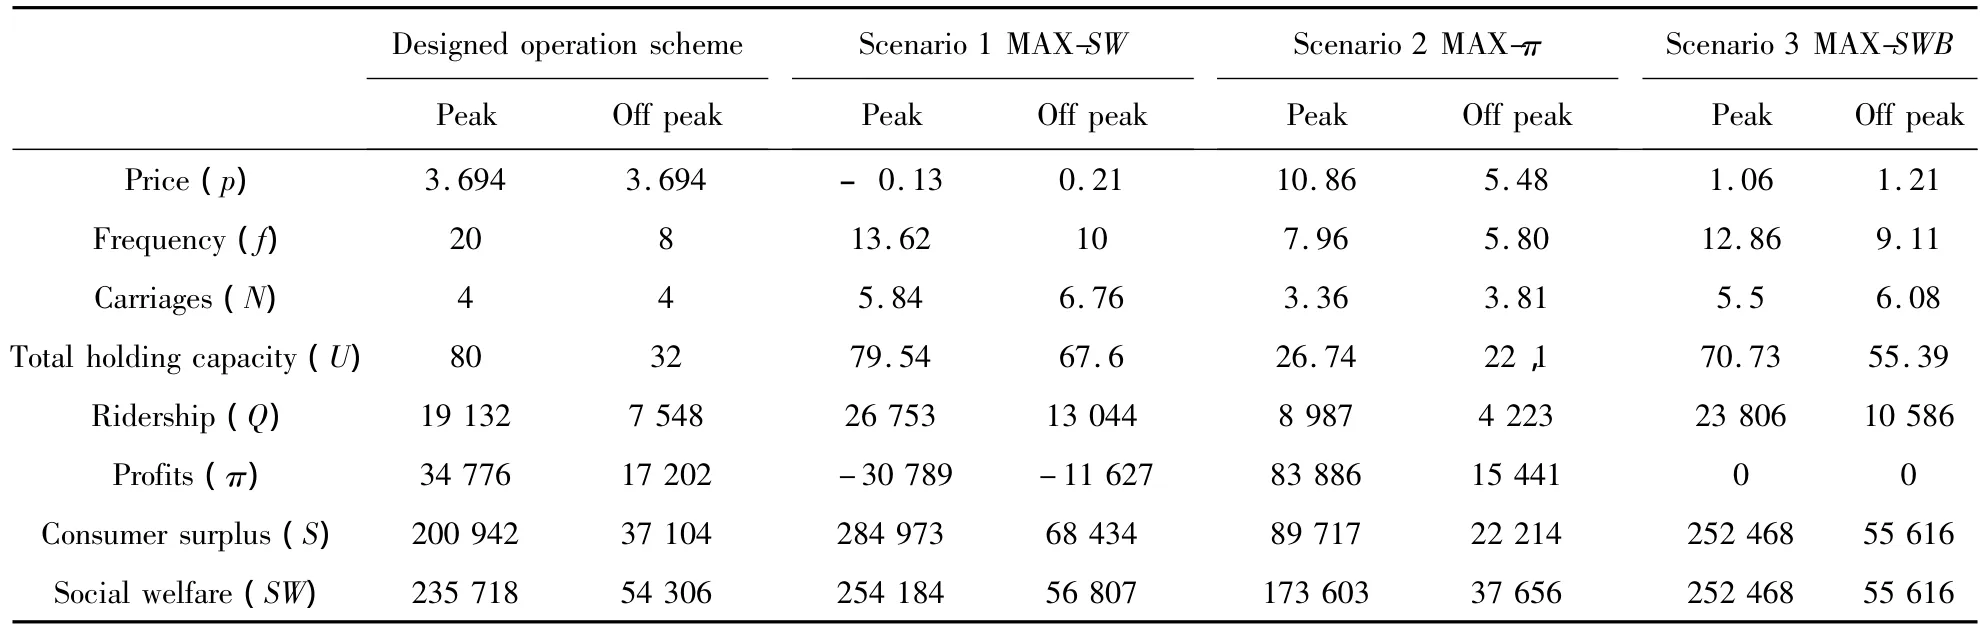
Table 4 Comparison of optimum with current service characteristics
In regarding the number of carriages,if the rail transit operator is social efficiency orientated,it would prefer to afford more carriages than the commercially monopolistic operator does.This result is in opposition to the conventional view on bus size,that is,the social-welfare maximizing operator has incentive to use smaller buses offering better service frequency.The explanation for this curious result could be that the social-welfare maximizing operator pays some attention to increase consumer surplus using more carriages to reliefovercrowding,while the profit maximizing operator only considers its profit and disregards the intra-marginal user benefits.The typical length of the rail train(4 carriages)currently adopted is relatively short compared to the socially desired ones(that are 5.84 carriages in the peak and 6.76 in the off-peak),but very approximate to the profit maximization of the desired ones.
If the social welfare is pursued to its absolute maximum(that is the social welfare maximization),the largest social welfare has been achieved at the expense of very high subsidies(30,789 for perk hour and 11,627 CNY for off-perk period),which have substantialfinancialcosts.Comparing the social welfare maximization scenario(Max-SW)with the social welfare maximization subject to the break-even scenario(Max-SWB),it reveals that with the breakeven removed,the improvement in social welfare is relatively small(only 1,716 CNY for one peak hour and 1,191 CNY for one off-peak hour).The consumer surpluses under the current operation arrangements are lowerthan those underthe socialwelfare maximization,and maximizing social welfare is subject to budget constraint due to high charged fares and low service levels(especially for off-peak periods).A practical application of this result is that for a given set of data inputs,the social welfare maximization under the break-even option is preferable and quite acceptable because it yields zero deficits with only a small sacrifice in social welfare.
5 Conclusions
By means of a simple line model,this paper deals with jointly optimizing fares,frequency and number of carriages under alternative management objectives.A synthesis of theoretical comparisons and empirical assessment depict the following results:whatever the objective pursued,the resulting optimal decision rules for frequency and number of carriages substantially follow the modified“square root formula”so that the line capacity,defined as the product offrequency and numberofcarriages,proportionally varies with demand.Secondly,in the absence of external costs,the form of decision rules for fare and service provisions are independent on the type of management objectives,while their values are different.Specifically,contrasted with purely profit optimum,social welfare optimum is characterized with lowerfares,greaterfrequency,more numberof carriages and higher ridership.Thirdly,the change from the current operating position to social optimum outputs calls for reducing fares,reducing frequency and adopting more carriages per train.Finally,for the given traffic data and parameters,maximizing social welfare subject to the break-even constraint is an economically and politically preferable objective because it does not need any subsidy with a marginal reduction of social welfare.
Acknowledgements
This research was substantially supported by the Ministry of Education(MOE)of Humanities and Social Sciences Project of China(No.12YJA630097).
[1]van de Velde D.Organizational forms and entrepreneurship in public transport:part 1:classifying organizational forms[J].Transport Policy,1999,6:147-157.
[2]Vickrey W.Pricing in urban and suburban transport[J]. American EconomicReview, 1963, 53:452-465.
[3]Mohring H.Optimization and scale economies in urban bus transportation[J].American Economic Review,1972,62:591-604.
[4]Turvey R,Mohring H.Optimal bus fares[J].Journal ofTransportEconomics and Policy, 1975, 9:280-286.
[5]Jansson J O.Marginal cost pricing of scheduled transport services[J].Journal of Transport Economics and Policy,1979,13:268-294.
[6]Jansson J O.A simple bus line model for optimization of frequency and bus size[J].Journal of Transport Economics and Policy,1980,14:53-80.
[7]Viton P A.Pareto-optimal urban transportation equilibria[J].Research in Transportation Economics,1983,1:75-101.
[8]Chang S K,Schonfeld P M.Multiple period optimization of bus transit system[J].Transportation Research Part B,1991,25(6):453-478.
[9]Jara-Diaz S R,Gschwender A.Towards a general microeconomicmodelforthe operation ofpublic transport[J].Transport Reviews,2003,23(4):453-469.
[10]Small K A.Road pricing and public transport[C].In:Santos G,(Ed.),Road Pricing:Theory and Evidence,Elsevier,Oxford,2004,133-158.
[11]Tirachini A,Hensher D A,Jara-Díaz S R.Comparing operator and user costs of light rail,heavy rail and bus transit over a radical public transport network[J].Research in Transportation Economics,2010,29(1):231-242.
[12]Nash C A.Management objectives,fares and service levels in bus transport[J].Journal of Transport Economics and Policy,1978,12:70-85.
[13]Larsen O I.Marginal cost pricing of scheduled transport services[J].Journal of Transport Economics and Policy,1983,17:315-317.
[14]Viton P A.The possibility of profitable bus service[J].Journal of Transport Economics and Policy,1980,14:295-314.
[15]Else P K.Optimal pricing and subsidies for scheduled transport services[J].Journal of Transport Economics and Policy,1985,19(3):263-279.
[16]Oldfield R H,Bly P H.An analytic investigation of optimal bus size[J].Transportation Research Part B,1988,22(5):319-337.
[17]Jansson K.Optimal public transport price and service frequency[J].Journal of Transport Economics and Policy,1993,27:33-50.
[18]Evans A W,Morrison A D.Incorporating accident risk and disruption in economic models of public transport[J].Journal of Transport Economics and Policy,1997,31:117-146.
[19]Jansson K,Lang H,Mattsson D.Optimal economic interventions in scheduled public transport[J].Research in Transportation Economics,2008,23:30-40.
[20]Polydoropoulou A,Ben-Akiva M.Combined revealed and stated preference nested Logit access and mode choice model for multiple mass transit technologies[J].Transportation Research Record 1771,TRB,National Research Council, Washington, D.C.,2001,38-45.
[21]Kraus M.Discomfort externalities and marginal cost transit fares[J].Journal of Urban Economics.1991,29(2):249-259.
[22]Jansson K.Pricing and financing of the railway in a competitive environment[C].International Conference Series on Competition and Ownership in Land Passenger Transport(THREDBO 6),Cape Town,South Africa,1999.
[23]Kijung A.Road pricing and bus service policies[J].Journal of Transport Economics and Policy,2009,43(1):25-53.
[24]Van Reeven P.Subsidisation of urban public transport and the mohring effect[J].Journal of Transport Economics and Policy,2008,42(2):349-359.
[25]Savage I,Small K A.A comment on 'subsidisation of urban public transport and the mohring effect[J].Journal of Transport Economics and Policy,2010,44(3):373-380.
[26]Basso L J,Jara-Diaz S R.The case for subsidisation of urban public transport and the Mohring effect[J].Journal of Transport Economics and Policy,2010,44(3):365-372.
[27]Karamychev V, van Reeven P.Oversupply or undersupply in a public transport monopoly a rejoinder and generalization[J].Journal of Transport Economics and Policy,2010,44(3):381-389.
[28]Qin F,Jia H.Remodeling in-vehicle crowding cost functionsfor public transit[C]. 75th Annual Transportation Research Board Meeting,Washington,D.C.,2012.
[29]Zhang G.The analysis of external cost for urban travel modes[D].Master's thesis,Civil and Engineering Department,National Taiwan University,2007.
[30]Larsen O I.The social optimum public transport model[R].Discussion Paper of Institute of Transport Economics(TOI),2004.
[31]Zhu C,Zheng W.The analysis of external cost for private car trips in Shanghai[C].In:Proceedings of 16th Symposium on Urban Transportation across the Taiwan Strait,Nanjing,2008.