
Cavitation bubbles collapse characteristics behind a convex body*
2013-06-01 12:29LIYao李瑶XUWeilin许唯临ZHANGYalei张亚磊ZHANGJingwei张敬威
水动力学研究与进展 B辑 2013年6期
LI Yao (李瑶), XU Wei-lin (许唯临), ZHANG Ya-lei (张亚磊), ZHANG Jing-wei (张敬威),
CHEN Chun-qi (陈春祺), Arong (阿蓉)
State Key Laboratory of Hydraulics and Mountain River Engineering, Sichuan University, Chengdu 610065, China, E-mail: elizabeth2172@163.com
Cavitation bubbles collapse characteristics behind a convex body*
LI Yao (李瑶), XU Wei-lin (许唯临), ZHANG Ya-lei (张亚磊), ZHANG Jing-wei (张敬威),
CHEN Chun-qi (陈春祺), Arong (阿蓉)
State Key Laboratory of Hydraulics and Mountain River Engineering, Sichuan University, Chengdu 610065, China, E-mail: elizabeth2172@163.com
(Received December 3, 2012, Revised May 18, 2013)
Cavitation bubbles behind a convex body were experimentally studied by a high speed camera and a hydrophone synchronously. The experiments were conducted in a circulating water tunnel with five various contraction ratios:β=0.497,β=0.6,β=0.697,β=0.751, andβ=0.799. The distributions of the cavitation bubble collapse positions behind the five different convex bodies were obtained by combining the images taken by the high speed camera. According to the collapse positions, it was found that no cavitation bubble was collapsed in the region near the wall until the ratio of the water head loss over the convex body height was larger than 20, which can be used to predict if the cavitation damage would occur in the tunnel with orifice energy dissipaters.
convex body, cavitation bubble, collapse, high speed camera, cavitation noise
Introduction
The orifice spillway, a type of inner dissipater, can be used to reduce the investment of hydraulic buildings and greatly dissipate the energy of the high speed flow by combining the permanent spillway with diversion tunnels. It is used widely for its large flow coefficient, high energy dissipation and low rate of cavitation[1]. In the Xiaolangdi water conservancy project in China, the three orifice plates in the flood discharge tunnel have the energy dissipation ratio of 44% and keep the flow velocity through the gate within 35 m/s under the head of 145 m[2]. Early researches about inner dissipaters were focused on the sudden expansion and the orifice plate by Borda and Prandtl[1]. In recent years, many studies about the plug dissipater were mainly concerned with the head loss[3-7]and the cavitation[8,9], and model tests and CFD simulations[10-12]were widely used to study the sudden reduction and enlargement. For example, a synergistic erosion model can be built by considering the phenomenon from the viewpoint of the fluid–particle interaction, which may help to understand the mechanism of the severe damage caused jointly by cavitation and silt erosion[13]. Naoe and Futakawa[14]studied the cavitation bubble behavior in the mercury by the visualization of growth and collapse behavior of the mercury cavitation bubble in contact with a solid wall, using precisely controlled pressure pulse and the high speed video camera. Lauer et al.[15]investigated the differences in the collapse evolution between detached and attached bubbles by numerical modeling of symmetric and asymmetric cavitation bubble dynamics.
Prototype tests of the Xiaolangdi project orifices showed that the cavitation did occur downstream the orifices with an intensity. However, there was no sign of cavitation damage found on the wall of the tunnel, which suggests that the cavitation conditions have not reached the stage to erode the water tunnel. So the positions and the number of collapsed cavitation bubbles might be the keys to the cavitation erosion,but they could not be determined by the cavitation noise survey only. This paper focuses on the cavitation bubble collapse characteristics behind the convex bodies in a water tunnel.
1. Experiments
The experiments were conducted in the circulating water tunnel of the State Key Laboratory of Hydraulics and Mountain River Engineering, Sichuan University, China. The experiment field is as shown in Fig.1, and the sketches of the cross section and the elevation of the water tunnel’s experiment section are shown in Fig.2.
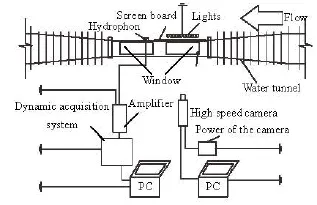
Fig.1 Sketch of the experiment field

Fig.2 Cross section and elevation of the water tunnel experiment section
The pictures of the flow passing the convex bodies of different contraction ratios are taken by the high speed camera and the hydrophone synchronously. The recordings of the high speed camera show the development and the traces of the cavitation bubbles in different flow fields. And by combining the recordings, the distribution of cavitation bubble collapse positions can be obtained. According to the distributions, the influence of the contraction ratioβand the inlet velocity0uon the positions of the cavitation bubbles collapsed in the flow behind the convex bodies in the water tunnel is studied. The contraction ratio is determined byhandHin Fig.2, i.e., =β()/HhH-. The five contraction ratios of the convex bodies are =β0.497, =β0.6, =β0.697, =β0.751 and =β0.799. Each of the five convex bodies is set on the floor of the water tunnel, to be tested in the flow with various inlet velocities: from 1 m/s to 10 m/s.
The flows are captured by the PCO. high speed camera, the B&K type 8103 hydrophone, and the TST6200 dynamic acquisition system and PC. The rates of pictures taken by the high speed camera are adjusted according to the variation of the cavitation states in the flow, from 498.87 fps to 1 301.38 fps. Diverse record rates could make sure that the camera can capture and trace the images of cavitation bubbles well in different conditions. In order to take clear images of cavitation bubbles, lights and screen board are used for appropriate brightness in the experiments. Either excessive brightness or darkness would affect the tracing and identification of the cavitation bubbles in the pictures taken by the high speed camera. The hydrophone is set in a small water tank linked to the outside of the downstream experiment section of the cycling water tunnel. The sampling length and frequency of the dynamic acquisition system used in the experiments are set at 512k per frame and 200 kHz, and the sensitivity of the hydrophone is –210 dB.
2. Cavitation bubbles in the flow behind the convex bodies
The shapes and the collapsing processes of cavitation bubbles are different in the flow of different cavitation states. The cavitation bubbles in the flow with a severer cavitation have a larger volume and take wormlike shapes. Some of them collapse more than once from occurrence to disappearance and take a long time to vanish.
The pictures in Fig.3 are taken at the rate of 665.16 frames per second in the circulating water tunnel, when the convex body has a contraction ratio of 0.6, and the inlet velocity of the flow is 6 m/s. The time corresponding to each picture is marked on it, about 0.0015 s for each interval. The black points circled in Fig.3 are the images of the same cavitation bubble, and one may see the whole process of the cavitation bubble from occurrence to disappearance. In the Fig.3, the cavitation bubble appears in the first picture and is fully developed in the next one. There is no sign of the cavitation bubble in the last picture, so the recording time of the third picture is taken as the collapsing moment of the cavitation bubble.
Figure 4 shows the synchronous noise signals in the same flow in Fig.3, as triggered by the experimental flow from the 2.535 s to the 2.539 s. The peak voltage at the 1 st 2.5382 s in Fig.4 is trigged by the noise of the collapsing cavitation bubble in Fig.3.
From the synchronous recording of the images and the voltage signals in the flow, one might consider the picture right before the cavitation bubble is traced as totally disappeared, as the image of the collapsing cavitation bubble for obtaining the statistics of the distribution of the positions of the collapsing cavitation bubbles. The cavitation bubbles in the flow under the same condition as shown in Fig.3 appear separately and randomly.
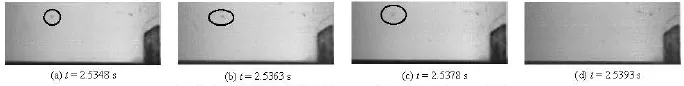
Fig.3 A cavitation bubble in the condition of =β0.6,0=u6 m/s

Fig.4 Noise montoring result in Fig.3
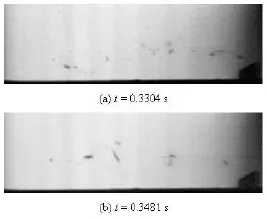
Fig.5 Cavitation belt in the condition of =β0.799,0=u10 m/s
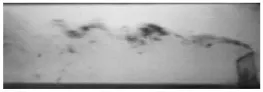
Fig.6 Cavitation belt in the condition of =β0.6,0=u8 m/s
Figure 5 shows the different curves formed by the cavitation bubbles in different times under the same condition that the inlet velocity is 10 m/s and the contraction ratio is 0.799. Figure 6 shows the cavitation belt when the inlet velocity is 8 m/s and the contraction ratio is 0.6. The two figures are taken, respectively, at the rate of 1 301.38 fps and 665.16 fps. The cavitation bubbles in both figures have a form of a parabolic curve in the flow. And not only continuous cavitation belts could be seen easily by naked eyes during the experiment, but also the noise of the cavitation is very loud.
The shapes and the collapse processes of the cavitation bubbles in Figs.5 and 6 are very different from those in Fig.3. The cavitation bubbles in the flow of Fig.3 are smaller in volume and have shapes closer to round ones. They only collapse once from occurrence to disappearance and take a much shorter time to vanish than the cavitation bubbles in Figs.5 and 6. Most of the cavitation bubbles in those two figures develop into a wormlike shape and collapse by stages, with a very large difference in duration among the cavitation bubbles. As the velocity of the flow increases, the tail of the cavitation belt flaps intensively with the flow, which disperses the cavitation bubbles and enlarges the area of cavitation bubble collapsing. That can be better shown in Figs.7-8.
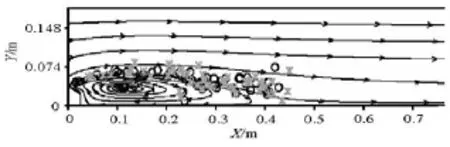
Fig.7 Positions where cavitation bubbles occur and collapse in the same flow of =β0.799,0=u10 m/s
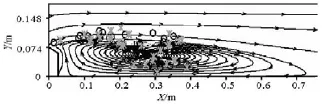
Fig.8 Positions where cavitation bubbles occur and collapse in the same flow of =β0.6,0=u8 m/s
The “○” and the “*” in Figs.7, 8 and 9, respectively, show the distributions of the occurrence and collapse positions of cavitation bubbles in the flow in Figs.5, 6 and 3, and the streamlines of the flows simulated by Fluent are also shown in those figures. It isobvious in Fig.7 that all the cavitation bubbles in the flow occur and collapse above the vortex behind the convex body. They flow downstream along the streamlines nearly parallel to the water tunnel. The vortex formed behind the convex body in the condition can not generate a heavy enough turbulence to trigger continuously the appearance of a cavitation belt or large cavitation bubbles, and the cavitation bubbles in the flow collapse far before the vortex drives them to the floor of the water tunnel. In Figs.7 and 8, the cavitation bubbles in the flow under those two conditions occur above and along the boundary of the vortex basically (the vortexes change under the turbulence of the flows, and the streamlines shown in Figs.7-9 are in the middle section of the water tunnel), and as they develop and move along the streamlines, some cavitation bubbles are driven to the bottom of the water tunnel and collapse there. More and more cavitation bubbles would appear and collapse near the bottom as the turbulence becomes more and more intensive. Consequently, the cavitation bubbles occurred at the tails of vortexes are more likely to collapse in the region near the wall.
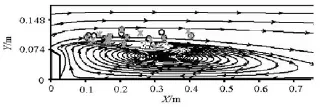
Fig.9 Positions where cavitation bubbles occurr and collapse in the same flow of =β0.6,0=u6 m/s
3. The distribution characteristics of collapsing bubbles behind the convex bodies
The positions and the number of collapsing cavitation bubbles greatly influence the cavitation damage of the water tunnel. The distribution of the collapsing positions of the cavitation bubbles is obtained by combining the pictures taken under the condition of the same contraction ratio and the flow of the same inlet velocity. And the centroids of the images of the collapsing cavitation bubbles are taken as the positions where the cavitation bubbles collapse, in this paper. The pictures of the selected groups are continuous. According to the different cavitation states of the different flows, the duration of each picture group is different.
The region 0 m to 0.02 m away from the wall of the water tunnel is taken as the region near the wall in this paper.0uandcu, respectively, are the inlet velocity and the contraction section velocity of the flow in the experiments.
3.1The distribution of cavitation bubbles collapsing when β was 0.497
The distribution of cavitation bubbles collapsing in the water tunnel with the convex body of =β0.497 is shown in Fig.10. The convex body is 0.093 m in height. The direction of the flow is arrowed in the graphs.
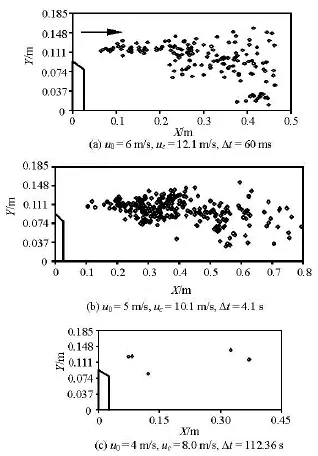
Fig.10 Distributions of the collapsing positions of the cavitation bubbles in the water tunnel with the convex body ofβ=0.497
Figure 10(a) is the distribution of the collapsing positions of cavitation bubbles in 60 ms. The inlet velocity of the flow is 6 m/s. The collapsing area of the cavitation bubbles expands as the flow flaps, because of the severe turbulence caused by the sudden expansion of the flow. 158 cavitation bubbles collapse in 60ms in the camera view, and most of them collapse in the central part of the flow, but there are 3 cavitation bubbles collapsed near the floor of the water tunnel during the time of statistics calculation. The smallest distance between the cavitation bubble collapsing position and the floor is 0.0161 m.
Figure 10(b) is the distribution of the collapsing positions of the cavitation bubbles in 4.1 s. The inlet velocity of the flow is 5 m/s. The distribution has a similar shape as in Fig.10(a). 294 cavitation bubbles collapse during the time in the view, but there is no bubble collapsed near the wall of the tunnel.
Figure 10(c) is the distribution of the collapsing positions of the cavitation bubbles in 112.36 s. The inlet velocity of the flow is 4 m/s. Only 5 cavitation bubbles are found in the view, and all of them collapse outside the region near the wall. The conditions of the flow with smaller inlet velocity, less than 4m/s, are also considered in the water tunnel, but no cavitation bubble is found in the camera view.
3.2The distribution of cavitation bubbles collapsing when β was 0.6
The distribution of cavitation bubbles collapsing in the water tunnel with the convex body of =β0.6 are shown in Fig.11. The convex body is 0.074 m in height.
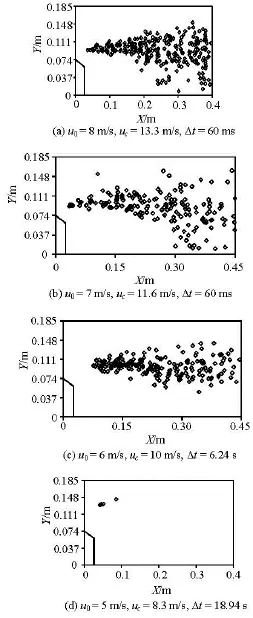
Fig.11 Distributions of the collapsing positions of the cavitation bubbles in the water tunnel with the convex body ofβ=0.6
Figure 11(a) is the distribution of the collapsing positions of the cavitation bubbles in 60 ms. The inlet velocity of the flow is 8 m/s. The downstream part of the collapsing area of the cavitation bubbles is much larger than the upstream part. 271 cavitation bubbles collapse during the time in the camera view, and quite some of them collapse near the floor of the water tunnel. The smallest distance between the cavitation bubble collapsing position and the floor is 0.0084 m.
Figure 11(b) is the distribution of the collapsing positions of the cavitation bubbles in 60 ms. The inlet velocity of the flow is 7 m/s. The distribution has a similar shape as in Fig.11(a), but with fewer collapsing cavitation bubbles. 171 cavitation bubbles collapse during the statistical 60ms, and some of them collapse in the region near the wall of the tunnel. The nearest distance of the collapsing cavitation bubble to the floor is 0.0118 m. Under the conditions in Figs.11(a) and 11(b), we see cavitation bubbles collapsed in the region near the wall of the water tunnel.
Figure 11(c) is the distribution of the collapsing positions of the cavitation bubbles in 6.24 s. The inlet velocity of the flow is 6 m/s. The collapsing area of the cavitation bubbles is much smaller comparing to those in Figs.11(a) and 11(b). There are 196 cavitation bubbles collapsed during the time in the camera view. The cavitation bubbles all collapse in the central part of the flow under the condition.
Figure 11(d) is the distribution of the collapsing positions of the cavitation bubbles in 18.94 s. The inlet velocity of the flow is 5 m/s. Very few cavitation bubbles are found collapsing under the condition, and none of them collapse near the floor of the water tunnel.
3.3The distribution of cavitation bubbles collapsing
when β was 0.697
The distributions of cavitation bubbles collapsing in the water tunnel with the convex body of =β0.697 are shown in Fig.12. The convex body is 0.056 m in height.
Figure 12(a) is the distribution of the collapsing positions of the cavitation bubbles in 60 ms. The inlet velocity of the flow is 9 m/s. The collapsing area of the cavitation bubbles expands a lot as the flow flaps. 259 cavitation bubbles collapse as in the statistics calculation in the camera view. They collapse in the central part of the flow except some cavitation bubbles that collapse near the floor of the water tunnel. The smallest distance between the cavitation bubble collapsing position and the floor is 0.0127 m.
Figure 12(b) is the distribution of the collapsing positions of the cavitation bubbles in 180 ms. The inlet velocity of the flow is 8m/s. Much fewer collapsing cavitation bubbles are shown in Fig.12(b) than in Fig.12(a). 188 cavitation bubbles collapse during 60 ms in the camera view. The nearest distance is 0.0086 m between the position of the collapsing cavitation bubble and the floor of the water tunnel. Thereare some cavitation bubbles both in Figs.12(a) and 12(b) that collapse in the region near the wall.
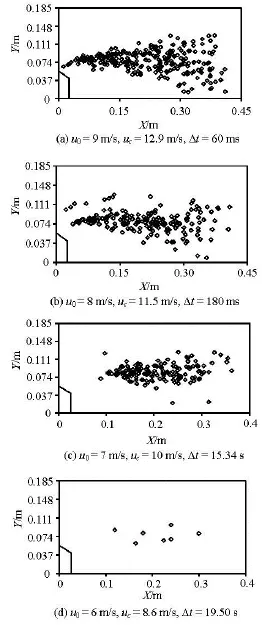
Fig.12 Distributions of the collapsing positions of the cavitation bubbles in the water tunnel with the convex body ofβ=0.697
Figure 12(c) is the distribution of the collapsing positions of the cavitation bubbles in 20.58 s. The inlet velocity of the flow is 7 m/s. The collapsing area of the cavitation bubbles is much smaller comparing to those in Figs.12(a) and 12(b). 149 cavitation bubbles collapse during the time in the camera view, they all collapse outside the region near the wall of the water tunnel.
Figure 12(d) is the distribution of the collapsing positions of the cavitation bubbles in 19.5 s. The inlet velocity of the flow is 6m/s. Only 7 cavitation bubbles are found in the view, and they all collapse in the central part of the tunnel. The flow with inlet velocity less than 6 m/s, is also considered, but no cavitation bubble is found in the view. So, the incipient cavitation condition is when the inlet velocity is 6 m/s.
3.4The distribution of cavitation bubbles collapsing
when β was 0.751
Figure 13 shows the distributions of cavitation bubbles collapsing in the water tunnel with the convex body of =β0.751. The convex body is 0.0465 m in height.
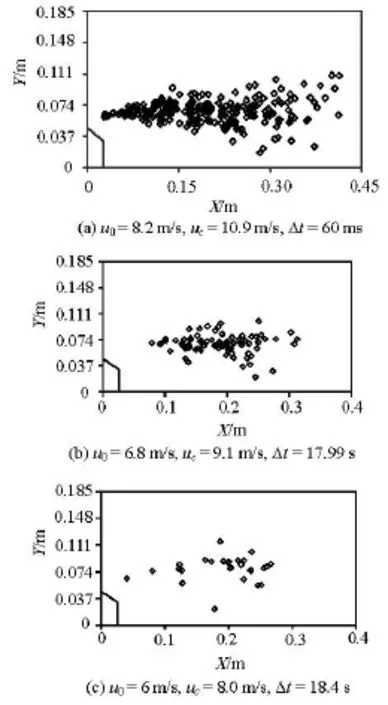
Fig.13 Distributions of the collapsing positions of the cavitation bubbles in the water tunnel with the convex body ofβ=0.751
Figure 13(a) is the distribution of the collapsing positions of the cavitation bubbles in 60 ms. The inlet velocity of the flow is 8.2 m/s. 225 cavitation bubbles collapse during the time in the camera view. There is 1 cavitation bubble that collapses near the floor of the water tunnel during the time, and the distance between them is 0.0175 m.
Figure 13(b) is the distribution of the collapsing positions of the cavitation bubbles in 17.99 s. The inlet velocity of the flow is 6.8 m/s. Although it takes much longer time to do the statistics calculation than for the case in Fig.13(a), there are much less cavitation bubbles collapsing in Fig.13(b), only 78 cavitation bubbles that collapse during the time in the view. And there is no cavitation bubble collapsed near the floor of the water tunnel in the time doing the statistics calculation.
Figure 13(c) is the distribution of the collapsing positions of the cavitation bubbles in 18.4 s. The inlet velocity of the flow is 6 m/s. There are much fewer collapsing cavitation bubbles there than in Figs.13(a) and 13(b). 25 cavitation bubbles collapse during the time in the camera view, and they all collapse in the region away from the wall of the water tunnel.
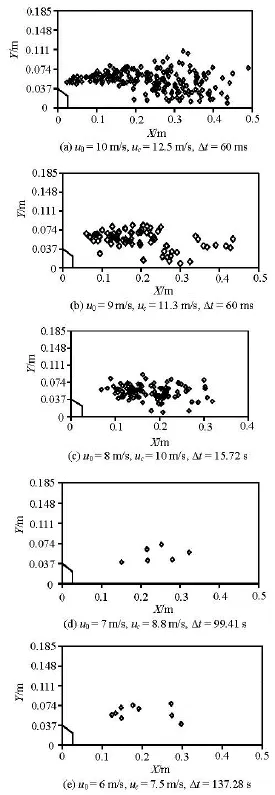
Fig.14 Distributions of the collapsing positions of the cavitation bubbles in the water tunnel with the orifice plate ofβ=0.799
3.5The distributions of cavitation bubbles collapsing when β was 0.799
The convex body in Fig.14 is 0.0373 m in height. Figure 14 shows the distributions of cavitation bubbles collapsing in the water tunnel with the convex body of =β0.799.
Figure 14(a) is the distribution of the collapsing positions of the cavitation bubbles in 60 ms. The inlet velocity of the flow is 10 m/s. The collapsing area of the cavitation bubbles expands a lot as the flow flaps. 195 cavitation bubbles collapse during 60 ms in the camera view. Plenty of them collapse near the floor of the water tunnel. The smallest distance between the cavitation bubble collapsing position and the floor is 0.0126 m.
Figure 14(b) is the distribution of the collapsing positions of the cavitation bubbles in 60 ms. The inlet velocity of the flow is 9 m/s. The number of the cavitation bubbles collapsing in the flow is less than a half of that in Fig.14(a), though both of them share the same statistical time. 70 cavitation bubbles collapse during 60 ms in the camera view. The nearest position of the cavitation bubble collapsing is 0.86cm away from the floor in the water tunnel. Under both the conditions in Figs.14(a) and 14(b), the cavitation bubbles collapse in the region near the floor of the water tunnel.
Figure 14(c) is the distribution of the collapsing positions of the cavitation bubbles in 15.72 s. The inlet velocity of the flow is 8 m/s. The collapsing area of the cavitation bubbles is much smaller than those in Figs.14(a) and 14(b). 103 cavitation bubbles collapse in the view of the statistics calculation, and 3 of them collapse in the region near the wall. Among their collapsing positions, the nearest distance to the floor of the water tunnel is 0.0092 m.
Figure 14(d) is the distribution of the collapsing positions of the cavitation bubbles in 99.41 s. The inlet velocity of the flow is 7 m/s. Very few cavitation bubbles are found under the condition, and they all collapse outside the region near the wall of the water tunnel.
Figure 14(e) is the distribution of the collapsing positions of the cavitation bubbles in 137.28 s. The inlet velocity of the flow is 6 m/s. Several cavitation bubbles are found under the condition, and they all collapse outside the region near the wall of the water tunnel. The conditions that the inlet velocity is less than 6 m/s are also considered, but no cavitation bubbles are found in the camera view. So, the incipient cavitation occurs in the flow when the inlet velocity is 6 m/s.
According to the experiments in this paper, as the inlet velocity increases, the number of the cavitation bubbles in the flow increases rapidly, and the flow ofa heavy turbulence expands the collapsing area of the cavitation bubbles greatly, in the water tunnel with the convex body of the same contraction ratio. Besides, the area where the collapsing cavitation bubbles touch the floor of the water tunnel also becomes larger and closer to the convex body, and there will be more cavitation bubbles collapsed in the region near the wall, i.e. more cavitation damages. With the same inlet velocity, an opposite trend will be seen when the contraction ratio increases.
In conclusion, the larger theβ, the larger the flow rate will be allowed to go pass the convex body without cavitation damage.

Fig.15 Empirical relationship between ΔP/ρghandu02/2gh
4. Critical conditions of avoiding cavitation bubbles collapsing in the region near the wall
More cavitation bubbles occur and collapse under the conditions of higher inlet velocity or smaller contraction ratios. Once the velocity at the contraction section is high enough, there will be cavitation bubbles collapsing in the region near the wall of the water tunnel.
From the distribution of the collapsing positions of the cavitation bubbles in different flows discussed above, for each contraction ratio, there will be a critical value of the inlet velocity. The cavitation bubbles would collapse outside the region near the wall of the water tunnel, if the inlet velocity is smaller than the critical value, which would increase with the rise of the contraction ratio, i.e., the critical values of the inlet velocity increase with the decrease of the convex body height. That means that a large height of the convex bodies could not avoid the cavitation bubbles collapsing in the region near the wall of the water tunnel.
Figure 15 shows the empirical relationship between dimensionless parameters of ΔP/ρghandu2/02ghof the convex bodies of five contraction ratios, where ΔP/ρghis the pressure head loss of the flow passing the convex bodies. Different symbols are used to distinguish the different cavitation states in various flows. The hollow symbols represent the conditions that there is no cavitation bubbles collapsing in the region near the wall or in the flow, and the solid symbols represent the opposite conditions. So, there is no cavitation bubble collapsing in the region near the wall or in the view if the value of ΔP/ρghis less than 20, i.e.,
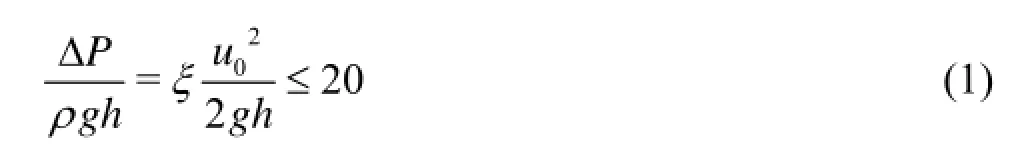
ξin formula (1) is the local resistance coefficient, which can be computed by the empirical formula for the orifice plate head loss:
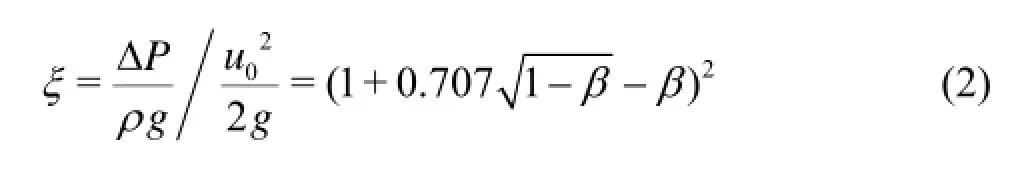
Andβin formula (2) is the contraction ratio of the contraction section in the water tunnel. So, formula (1) can be written in the following form
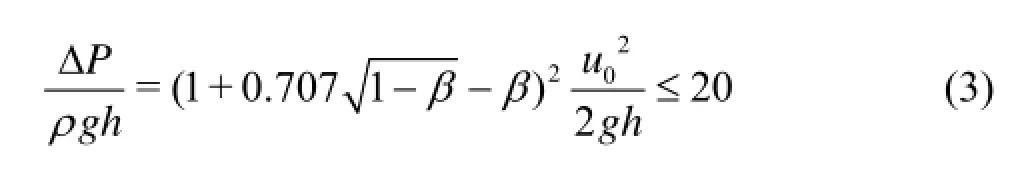
The above critical condition to prevent cavitation bubbles collapsing near the floor of the water tunnel can be used to predict if the cavitation damage willoccur in the tunnel with orifice energy dissipaters.
5. Conclusion
The images and noise signals are obtained by the high speed camera and the hydrophone synchronously. The characteristics of the cavitation bubbles behind the convex bodies of various contraction ratios are experimentally studied and analyzed in this paper. The distributions of the collapsing positions of cavitation bubbles behind the convex bodies of five different contraction ratios are obtained from the images taken by the high speed camera. The positions where the cavitation bubbles occur and collapse in different experiment conditions are traced to illustrate the different ways of collapse, and the cavitation bubbles at the tails of vortexes are more likely to collapse in the region near the wall. The results of the experiments illustrate that the larger theβ, the larger the flow rate will be allowed to pass the convex body without cavitation bubbles collapsed in the region near the wall. And it is also found that there is no cavitation bubble collapsed in the region near the wall until the ratio of the water head loss over the convex body height is larger than 20, which can be used to predict if the cavitation damage would occur in the tunnel with orifice energy dissipaters.
[1] ZHANG Chang-bing. Research on hydraulic properties of an orifice spillway tunnel[D]. Doctoral Thesis, Chengdu, China: Sichuan University, 2003(in Chinese).
[2] WU Jian-hua, AI Wan-zheng. Flows through energy dissipaters with sudden reduction and sudden enlargement forms[J].Journal of Hydrodynamics,2010, 22(3): 360-365.
[3] HE Yi-ying, YANG Fan. Application of plug energy dissipater to elimination of bubbles in cooling water occurred to the outlet of power plants[J].Journal of Hydraulic Engineering,2008, 39(8): 976-981(in Chinese).
[4] CHEN I. Y., TSENG C. Y. and LIN Y.-T. et al. Twophase flow pressure change subject to sudden contraction in small rectangular channels[J].International Journal of Multiphase Flow,2009, 35(1): 297-306.
[5] LI Zhuo, YU Jian and MA Chong-fang. Local resistances of single-phase flow across abrupt expansion and contraction in small channels[J].Journal of Chemical Industry and Engineering,2007, 58(5): 1127-1131(in Chinese).
[6] DAI Hui-chao, XU Wei-lin and GAO Ji-zhang et al. Application and improvement of turbulent model in high dam hydraulics[J].Water Resources and Power,2007, 25(4): 54-57(in Chinese).
[7] TAMURA Y., MATSUMOTO Y. Improvement of bubble model for cavitation flow simulations[J].Journal of Hydrodynamics,2009, 21(1): 41-46.
[8] YANG Zhi-ming. Discussion and new checking of scale effects for cavitation inception[J].Chinese Journal of Hydrodynamics,2008, 23(5): 580-584(in Chinese).
[9] LIU Shan-jun, YANG Yong-quan and XU Wei-lin et al. Hydraulic characteristics of throat-type energy dissipater in discharge tunnels[J].Journal of Hydraulic Engineering,2002, (7): 46-52(in Chinese).
[10] XIA Qing-fu, NI Han-gen. Numerical simulation of plug dissipater[J].Journal of Hydraulic Engineering,2003, (8): 37-42(in Chinese).
[11] YIN Ze-gao, SHI Bing and ZHAO Lin et al. Numerical simulation of plug energy dissipater flow[J].Advances in Water Science,2008, 19(1): 89-93(in Chinese).
[12] TIAM Z. Hydraulic characteristics of stepped plug dissipater in flood discharge tunnel[C].Proceeding of IAHR Congress EEEC.Seoul, Korea, 2005, 1445-1446.
[13] LI S. Cavitation enhancement of silt erosion–An envisaged micro model[J].Wear,2006, 260(9-10): 1145-1150.
[14] NAOE T., FUTAKAWA M. Optically observation of mercury cavitation bubble collapsing[J].Experimental Thermal and Fluid Science,2013, 44(1): 550-555.
[15] LAUER E., HU X. Y. and HICKEL S. et al. Numerical modeling and investigation of symmetric and asymmetric cavitation bubble dynamics[J].Computers and Fluids,2012, 69: 1-19.
10.1016/S1001-6058(13)60437-0
* Project supported by the Natural Science Foundation of China (Grant No. 51179114), the National Basic Research Development Program of China (973 Program, 2013CB035905).
Biography: LI Yao (1983- ), Female, Ph. D. Candidate
XU Wei-lin,
E-mail: xu_wl@sina.com

- 水动力学研究与进展 B辑的其它文章
- A three-dimensional hydroelasticity theory for ship structures in acoustic field of shallow sea*
- Experimental study of the interaction between the spark-induced cavitation bubble and the air bubble*
- A preliminary study of the turbulence features of the tidal bore in the Qiantang River, China*
- The calculation of mechanical energy loss for incompressible steady pipe flow of homogeneous fluid*
- Experimental study by PIV of swirling flow induced by trapezoid-winglets*
- Analysis of shear rate effects on drag reduction in turbulent channel flow with superhydrophobic wall*