Hydrodynamic effects on contaminants release due to rususpension and diffusion from sediments*
ZHU Hong-wei (朱红伟)
Shanghai Institute of Applied Mathematics and Mechanics, Shanghai Key Laboratory of Mechanics in Energy Engineering, Shanghai University, Shanghai 200072, China, E-mail: june0829@163.com
CHENG Peng-da (程鹏达)
Shanghai Institute of Applied Mathematics and Mechanics, Shanghai Key Laboratory of Mechanics in Energy Engineering and School of Mechatronical Engineering and Automation, Shanghai University, Shanghai 200072, China
ZHONG Bao-chang (钟宝昌), WANG Dao-zeng (王道增)
Shanghai Institute of Applied Mathematics and Mechanics, Shanghai Key Laboratory of Mechanics in Energy Engineering, Shanghai University, Shanghai 200072, China
(Received December 12, 2012, Revised January 18, 2013)
Hydrodynamic effects play a very important role in the contaminants release from sediments. Experiments were performed to study contaminants releasing characteristics due to resuspension. The time-dependent variation of COD concentration and relative roles under static and dynamic state of the overlying water were analyzed. Experimental results showed that COD concentration in the water column got a striking increment on the dynamic conditions, mainly by reducing the thickness of concentration boundary layer near sediment-water interface and destructing the surface structure of sediment. Hydrodynamics increased contaminants release rates and flux in unit time. Before reaching an equilibrium stage, the dynamic release caused by the resuspension was more effective than static one due to molecular diffusion. The release rate of COD increased with flow velocity and decreased with water depth. But at a shallow water depth, wave effects would dominate the causing resuspension, resulting in contaminants release in large quantity. The intensity of pollutant release increased with time in a rather circuitous process. The diffusion of pollutant from internal sediment to the sediment-water interface would maintain the endogenous release effects.
hydrodynamics, sediment resuspension, Chemical Oxygen Demand (COD), water pollution
Introduction
Eutrophication of rivers and lakes is one of the common problems in the water environment. Urban river has become a relative closed environment as the flow velocity is slow, resulting in a lot of accumulation of pollutants in the bottom sediments. This contaminant-containing sediments cause a serious deterioration on water quality. Contaminants may easily release into the overlying water when sediment is disturbed by driving or dredging[1-6]. Environmental dredging, which is a method to control the release of pollutants by removal of contaminated surface sediment, has been adopted by many countries in the world. However, dredging processes will still cause disturbance of the water body, increasing the concentration of contaminated sediment called “secondary pollution”. Therefore, the knowledge of hydrodynamic effects on the release of pollutants may be helpful to demonstrate its significance[7-10]. Usually, Chemical Oxygen Demand (COD) is used to indirectly reflect the level of organic pollution in water column[6,10]. As in lack of mature domestic evaluation about hydrodynamic effects, Suzhou Creek in shanghai was chosen as the study area by present research.
In this regard, the main objectives of the presentexperimental studies are firstly to quantify concentration variation of COD with time in static release due to molecular diffusion and dynamic release caused by sediment resuspension. In addition, this study aims to assess characteristics of the static and dynamic release and their different impacts on the water quality under kinds of hydrodynamic conditions.
1. Experimental methods
1.1Experimental flume and procedure
The time-dependent COD release characteristics have been experimentally investigated in an open flume under different flow velocity and water depth. The flume is a rectangular test section of 7 m in length, 0.25 m in width and 0.45 m in height[6]. Re-circulated water was supplied from a rectangular water tank of 1.5 m3. Required flow velocity (0.05 m/s-0.15 m/s) and water depth (0.1 m-0.2 m) were controlled by suitably adjusting both a frequency of pump and a tailgate. Sediment layer with 5cm thickness was gently and uniformly laid on the bottom of the flume before the experiments started, avoiding undesirable initial disturbance of sediment topography. The sediment samples were collected from Suzhou Creek and then transported immediately to the laboratory for the next procedure.
1.2Measurement methods
Experimental water samples were collected using siphon principle, three sampling frame were arranged respectively in upstream, center and downstream. Each sample section containing of 2 sampling points was settled at different depths with spacing of 0.05 m. Static experiments were carried in a barrel of 0.24 m in diameter. Turbidity was measured by using the LP2000 turbidity determination with unit in FTU. COD concentration in the overlying water was measured by the closed reflux colorimetric method[10]. Average velocity was got by LGY-II intelligent flow meter measuring flow velocity at three sections. One was close to the bottom sediment, another was in central water body, and the last one was near the water surface with three points of each section. Experimental period in each run was chosen for over two weeks (13d~18d) to cover the wide range of the residence time for the contaminants. As the experiments using tap water, the net of COD concentration of the overlying water column should be used.
2. Results
2.1Different effects between static and dynamic release
Pollutants release from sediments is composed of two parts: molecular diffusion at sediment-water interface and resuspension to the overlying water. When sediment structure is not broken, release takes process in static station, when resuspension occurs, it is a socalled dynamic process[11].
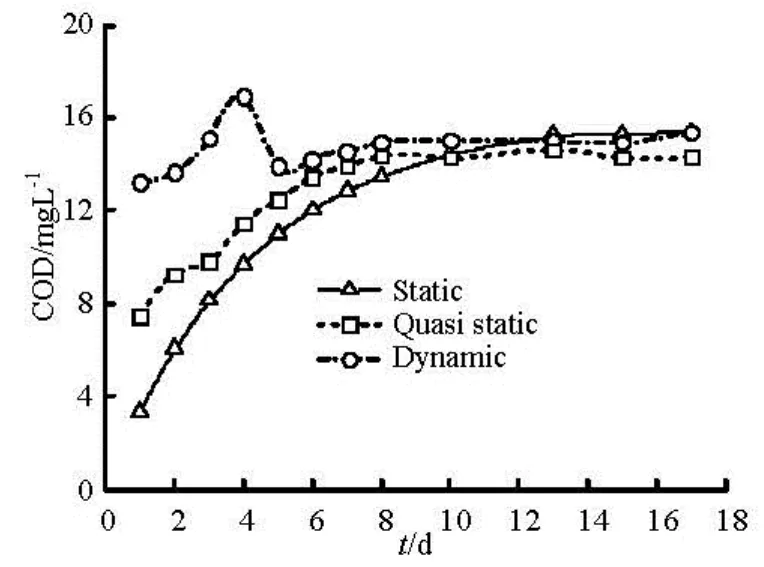
Fig.1 Comparison of dynamic release and static release
Sediment contaminants release depends on flow velocity in a large extent. The variation trend of COD concentration with time in three different stations is shown in Fig.1. As can be seen from the results, the static release exhibits a monotonously increasing with time, approximately can be fitted using Fick’s second formula. Unlike the static release, dynamic release peaks on the initial stage. However, both the stable COD concentrations due to the two mechanisms has the same value about 15 mg/L. The time-dependent variation curves indicate that the dynamic release by the resuspension/settling of the sediments is much more effective than the static one, especially during the initial release stage. The COD concentration in the overlying water column reaches equilibrium value more rapidly for the dynamic situation. Figure 1 also presents that even no resuspension, the hydrodynamic still affect the release rate by control the thickness and growth of diffusive boundary layer, which may make an extra increment in release rate compared with static water.
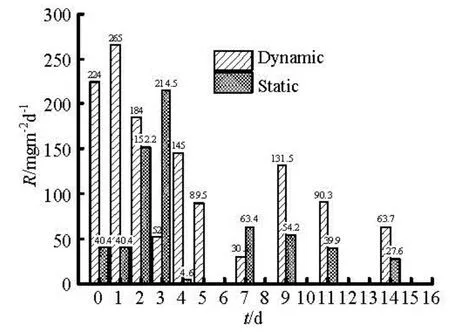
Fig.2 Comparison of release rate (R) of COD under dynamic and static state
Figure 2 gives the COD release rate in dynamicand static conditions. Both rates of dynamic release and static release have two peaks. Dynamic release reached the first peak on the second day about 265 mg/m2d. The release intensity decreased with time, and then reached the second peak in mediumterm with half the highest value. Interesting here, static release intensity is similar with dynamic one, reaching the first peak about 214.5 mg/m2d on the third day. The first peak may be caused by the huge concentration differences between the sediment-water interface and the overlying water body. The second peak may be due to the diffusion of pollutant from internal sediment to the sediment-water interface, which maintains the continuous release effect, but less as that of the initial release.
2.2Relationship between the COD concentration and turbidity
When flow rate reaches a critical level, sediment resuspension occurs and starts to affect water quality. Figure 3 shows the dynamic and static release rates of COD and turbidity in unit area and time.
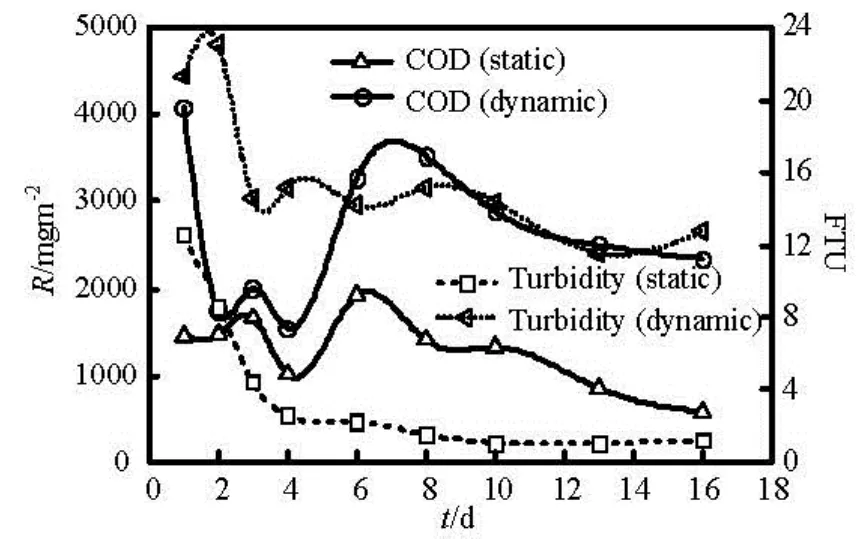
Fig.3 Changes of COD and turbidity with time under dynamic and static state
As can be seen from Fig.3, COD release rate and Suspended Solid Concentration (SSC) is basically a positive correlation[12]. The turbidity first decreases and then reaches a stable value. This is because the sediment is undisturbed, flocculation and sedimentation deduces the amount of suspended particles. Sediment pollutants release maintains a more stable increasing trend and reaches the maximum value on the sixth day. Release rate continues to decline, this may be caused by the pollutant slowly reducing concentration difference between the overlying water and near the sediment-water interface. Figure 3 shows the dynamic process is completely different from the static one. The former initial turbidity is about 2 times as static one, indicating that the reduction of sediment for there is no occurrence of resuspension. But the initial COD release rate firstly plummets, then slowly stabilizes. For the overlying water experiences a sudden movement, some unstable particles are instantly washed up, resulting in short-term increase in turbidity. These resuspended particles originally flocculate together in water column, making the COD release rate not increasing but reducing, which can be called the “initial block effect” of suspension dynamic release[13].
2.3Release characteristics on different hydrodynamic conditions
Figure 4 shows the relationship of the COD release change variation with time at water depth of 0.20 m, and flow velocity of 0.05 m/s, 0.10 m/s and 0.15 m/s. It presents the same trend on three flow conditions. They also experience two peaks. Overall, COD release increased with the flow rate. Similarly, it also exhibits the “initial block effect” of dynamic release due to flocculation and sedimentation. As time increases, the turbidity of the water slowly decreases and forms a new overlay at the sediment surface, which partially reduces the release rate. Molecular diffusion and initial resuspension release of contaminants occurs simultaneously, the former dominates the later release.
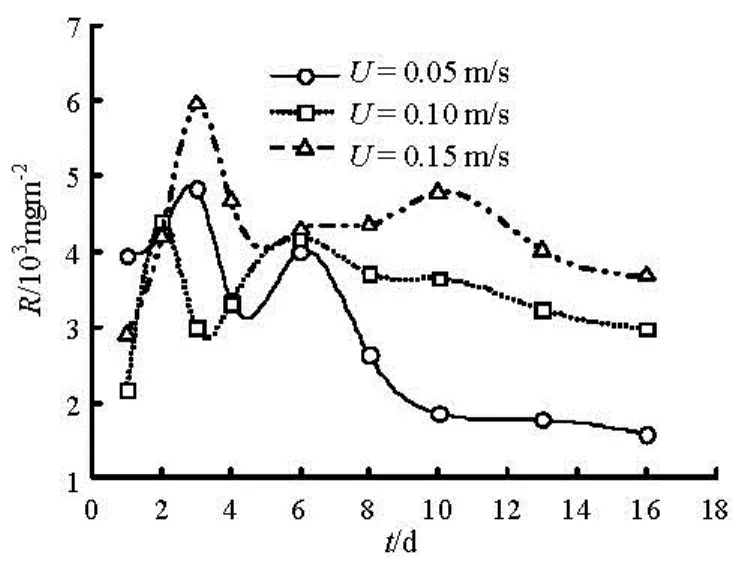
Fig.4 Changes of COD with time under different flow velocity
The increasing flow velocity will reduce the thickness of diffusion boundary layer. The proliferation of the relationship between the flux and flow rate can use the following formula[3,14],

whereJis the diffusion flux,CbandCwis the concentration on the upper and lower between the diffusion boundary layer,u*is the friction velocity,Sc=v/Dis the Schmidt number,vis the kinematic viscosity of water andDis the molecular diffusion coefficient. From the Eq.(1), we can see clearly that increasing flow velocity of the overlying water will produce a corresponding increase of the friction velocity, will naturally increasing the release flux across sediment-water interface.
The impact of water depth on the water quality is essentially changing the bottom shear stress, but lessobvious than flow velocity. What is more, wave is the main reason causing sediment resuspension in shallow water column[15]. The effects of water depth on COD release flow velocity of 0.05 m/s, and at water depth of 0.10 m, 0.15 m and 0.20 m are described in Fig.5. Under the same flow velocity, the deeper the water depth is, the smaller the bottom shear stress is. The change trend of COD release over time is basically the same at water depth of 0.15 m and 0.20 m as there is a slow decrease to maintain a stable process. The difference between the former and the water depth of 0.10 m lies in a rapid increase and then slows the release process. Long-term release rate is still maintained at a high level, the highest value was as 2.5 times as that of the early release. This sediment resuspension may be due to water surface waves which mean wave-induced sediment resuspension is much greater than the one flow-induced.
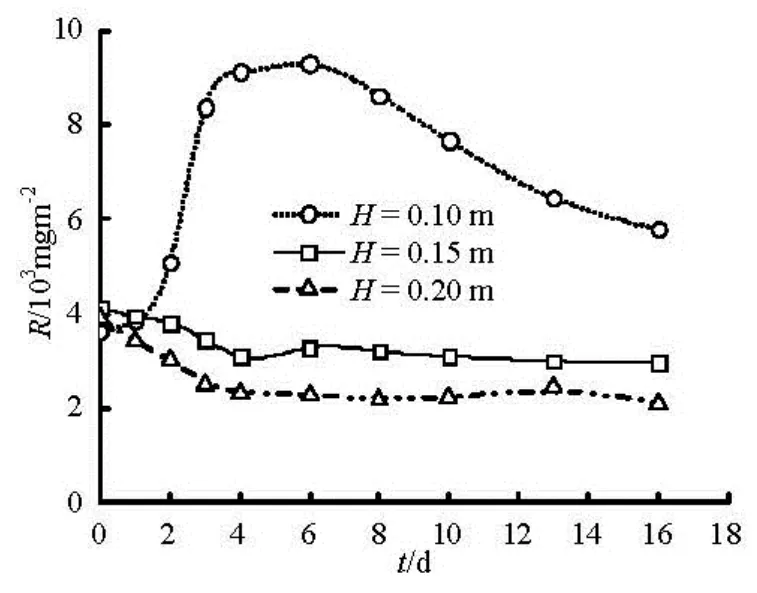
Fig.5 Changes of COD with time under different water depth
3. Discussion
3.1Molecular diffusion at the sediment-water interface
Another array experiment of water depth was conducted under static sediment. Figure 6 shows the sediment pollutants interface release due to molecular diffusion.
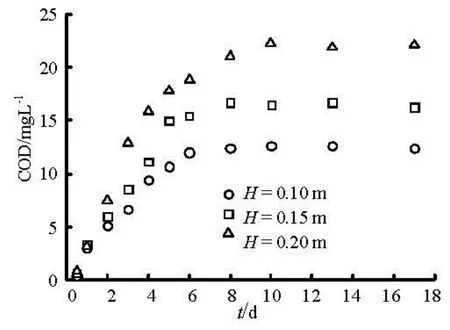
Fig.6 Changes of COD with time due to molecular diffusion under different water depth
These processes can be described by Fick’s first law

wherecδis thickness of diffusion boundary layer. According to the first-order reaction kinetics
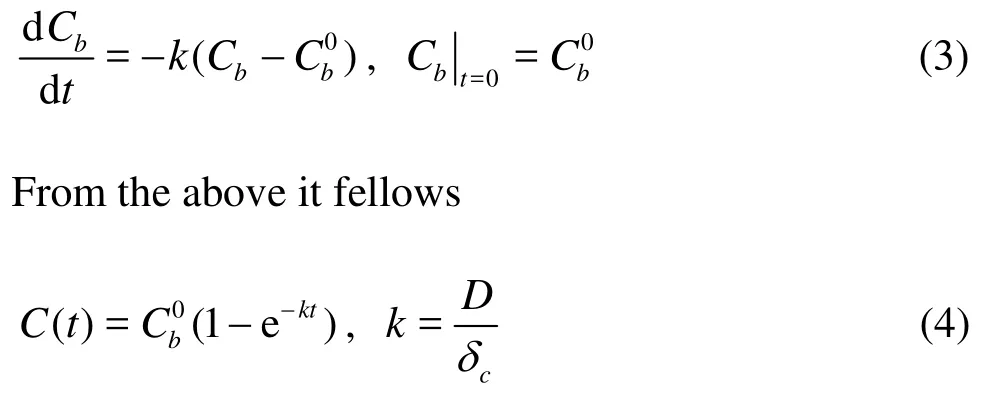
in whichkis the diffusion coefficient.
In the early release stage, concentration difference between upper and lower of the solid-liquid interface is relatively large. With time increasing, the concentration difference gradually decreases while the release intensity declines continually. Finally, the water phase concentration tends to reach a balance. Values ofkusing linear regression fitting with experimental data are respectively 5.07, 4.71 and 4.65 for water depth of 0.10 m, 0.15 m and 0.20 m. From the results we can see that diffusion coefficient decreases with water depth. The contaminant diffusion process to the overlying water is always presented.
3.2Contribution rate from molecular diffusion and sediment resuspension
From the results above, the release due to molecular diffusion and resuspension can be separated. For the case of relative small flow velocityu=0.05 m/s and static water, it can be observed that when the slight resuspension of the surface sediments occurs, the quantities of diffusion release and resuspension release are on the same order of magnitude. In this case, it can distinguish between the two different mechanisms conveniently.
The contribution ratio can be expressed as

whereQrepresents the total flux,Qiis flux due to molecular diffusion or resuspension. The results of sediment suspension release are shown in Fig.7. Sediment suspension release occurs in the early stage, while the diffusion process dominates the later release.
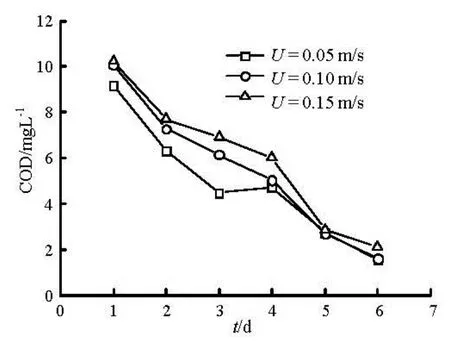
Fig.7 Suspension release with time under different flow velocity
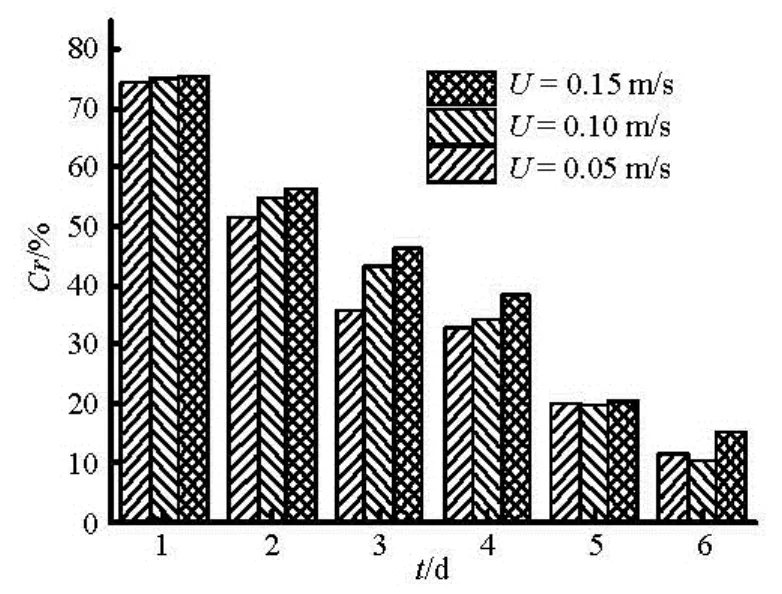
Fig.8 Contribution rates with time under different flow velocity
As can be seen from Fig.8, release accounting for sediment resuspension release takes up 50% of the total flux on the first two days, especially could reach up to 75% at the initial stage. With increasing time, the contribution rate due to sediment suspension gradually decreases. It indicates that sediment suspension exits in a short time as the main form of the initial sediment contaminants release.
3.3Comparisons of measured and self-purification consumption of COD
As the tap water was used in the experiments, sediment contaminants release per unit area is a cumulative value. It requires considering the self-purification of water bodies and sediments true release rate should be measured correctly. Figure 9 shows change of measured COD and self-purification consumption over time under hydrodynamic (flow velocity of 0.1 m/s, water depth of 0.10 m) and static conditions.
From Fig.9 we can see that the overall measured COD and self-purification consumption of COD both increase with time. Self-purification consumption is less than measured one at initial moment. As time increases, the COD amount of self-purification consumes accounting for a growing proportion of measure COD. There is still no decreasing trend of self-purification in late release. This shows that the self-purification Consumption of COD is main part of water contaminants. Sediment resuspension release is almost equal to self-purification consumption, indicating that DO in water is in relative shortage.
The flux across a sediment-water interface has traditionally been assumed to be dominated by molecular diffusion when the sediment is at steady state or flow. Fick’s second law of diffusion can be used to calculate the concentration distribution at the nearbed,
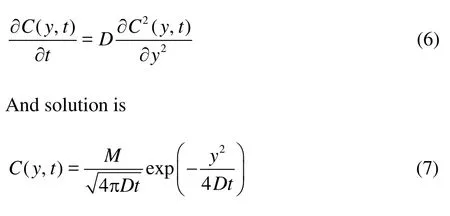
wherecis the time-depended concentration,Mis contaminant amount att=0,tis time.
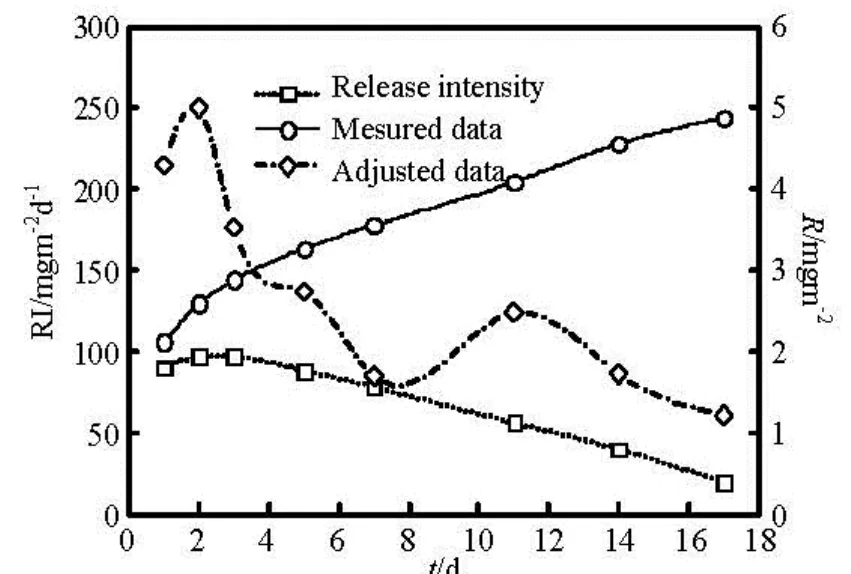
Fig.10 Variations of COD release intensity (RI) and release rate with time
Measured COD and adjusted COD from selfpurification consumption are shown in Fig.10. This describes that contaminants release has an early upward trend, and reach a peak on the second day, being caused by the instability of the hydrodynamic condi-tions due to disturbances. More and more particles entered in the water, resulting in sediment COD release intensity increasing. Start from the third day, with the stability of the flow conditions, the release to the overlying water is in the form of molecular diffusion. COD release intensity overall a downward trend is equivalent to a constant source. According to the results in Fig.10, the theoretical COD release intensity under dynamic flow conditions (water depth of 0.10 m, flow velocity of 0.10 m/s) can be expressed asC(t)=
4. Conclusions
Experimental results indicate that there are two major ways of release for the whole resuspension process, called static release due to molecular diffusion and dynamic release caused by particles resuspension. Both of them make effects at different stage on hydrodynamic and hydrostatic conditions. In the case of the static release, the measured COD concentration of the overlying water column tends to increase monotonously with time until reach a diffusive equilibrium value. Compared to the static release, the dynamic release by the sediment resuspension is shown to be of greater importance on the initial stage. If no resuspension occurs at sediment-water interface, the molecular diffusion plays a major role.
Flow rate is more important than the molecular diffusion by reducing the diffusion boundary layer thickness. The faster the flow velocity is, the thinner the concentration boundary layer. It will last until the sediment-water interface is destroyed where occurrence of resuspension release. At a certain flow rate, release rates and fluxes of pollutants will be reduced with the increasing depth of water. But when to the shallow water column, wave destroys the sedimentwater interface structure. As time increases, the intensity of sediment release of pollutants will gradually decrease. Sediments in experiments is not a constant source of contaminants, with the diffusion of the contaminated matter from deep sediment to the sedimentwater interface, sediment release intensity will rebound.
[1] HOUSER J. N., RICHARDSON W. B. Nitrogen and phosphorus in the Upper Mississippi River: Transport, processing, and effects on the river ecosystem[J]. Hydrobiologia, 2010, 640(1): 71-88.
[2] HOLLAND K. T., ELMORE P. A. A review of heterogeneous sediments in coastal environments[J]. Earth-Science Reviews, 2008, 89(3-4): 116-134.
[3] AREGA F., LEE J. H. W. Diffusional mass transfer at sediment-water interface of cylindrical sediment oxygen demand chamber[J]. Journal of Environmental Engineering, 2005, 131(5): 755-766.
[4] WEN S., SHAN B. and ZHANG H. Metals in sediment/ pore water in Chaohu Lake: Distribution, trends and flux[J]. Journal of Environmental Sciences, 2012, 24(12): 2041-2050.
[5] RUUS A.,ALLAN L. J. and OXNEVAD S. et al. In vivo bioaccumulation of contaminants from historically polluted sediments–relation to bioavailability estimates[J]. Science of the Total Environment, 2013, 442(1): 336-343.
[6] LI Bin, ZHANG Kun and ZHONG Bao-chang et al. An experimental study on release of pollutants from sediment under hydrodynamic conditions[J]. Chinese Journal of Hydrodynamics, 2008, 23(2): 126-133(in Chinese).
[7] ATKINSON C. A., JOLLEY D. F. and SIMPSON S. L. Effect of overlying water pH, dissolved oxygen, salinity and sediment disturbances on metal release and sequestration from metal contaminated marine sediments[J]. Chemosphere, 2007, 69(9): 1428-1437.
[8] BANKS J. L., ROSS J. R. and KEOUGH M. J. et al. Measuring hypoxia induced metal release from highly contaminated estuarine sediments during a 40 days laboratory incubation experiment[J]. Science of the Total Environment, 2012, 420(5): 229-237.
[9] ROSSI L., CHÈVER N. and FANKHAUSER R. et al. Sediment contamination assessment in urban areas based on total suspended solids[J]. Water Research, 2013, 47(1): 339-350.
[10] ZHANG Kun, LI Bin and WANG Dao-zeng. Contaminant (CODCr) release from river bottom sediments under flow conditions[J]. Acta Scientiae Circumstantiae, 2010, 30(5): 985-989(in Chinese).
[11] QIAN Jin, ZHENG Sha-sha and WANG Pei-fang et al. Experimental study on sediment resuspension in Taihu Lake under different hydrodynamic disturbances[J]. Journal of Hydrodynamics, 2011, 23(6): 826-833.
[12] WANG Z., LI S. and ZHU J. et al. Phosphorus partitioning between sediment and water in the riparian wetland in response to the hydrological regimes[J]. Chemosphere, 2013, 90(8): 2288-2296.
[13] FAN Jing-yu, WANG Dao-zeng and ZHANG Kun. Experimental study on a dynamic contaminant release into overlying water-body across sediment-water interface[J]. Journal of Hydrodynamics, 2010, 22(5 Suppl.): 343-346.
[14] HIGASHINO M., GANTZER C. J. and STEFAN H. G. Unsteady diffusional mass transfer at the sedimentwater interface: Theory and significance for SOD measurement[J]. Water Research, 2004, 38(1): 1-12.
[15] CHATELAIN M., GUIZIEN K. Modeling coupled turbulence–Dissolved oxygen dynamics near the sediment-water interface under wind waves and sea swell[J]. Water Research, 2010, 44(5): 1361-1372.
10.1016/S1001-6058(13)60419-9
* Project supported by the National Natural Science Foundation of China (Grant No. 10972134), the National Key Program of National Natural Science Foundation of China (Grant No. 11032007) and the Shanghai Program for Innovative Research Team in Universities.
Biography: ZHU Hong-wei (1984-), Male, Ph. D. Candidate
WANG Dao-zeng,
E-mail: dzwang@staff.shu.edu.cn
- 水动力学研究与进展 B辑的其它文章
- A one-dimensional polynomial chaos method in CFD–Based uncertainty quantification for ship hydrodynamic performance*
- Numerical analysis of cavitation within slanted axial-flow pump*
- Numerical simulation of hydro-elastic problems with smoothed particle hydrodynamics method*
- Analytic solutions of the interstitial fluid flow models*
- Experimental study of shell side flow-induced vibration of conical spiral tube bundle*
- A streamline approach for identification of the flowing and stagnant zones for five-spot well patterns in low permeability reservoirs*

