Theoretical analysis and experimental study of oxygen transfer under regular and non-breaking waves*
YIN Ze-gao (尹则高)
Shandong Province Key Laboratory of Ocean Engineering and Engineering College, Ocean University of China, Qingdao, China
Department of Civil and Environmental Engineering, University of Alberta, Edmonton, Canada,
E-mail: yinzegao@ouc.edu.cn
DAVID Z. Zhu
Department of Civil and Environmental Engineering, University of Alberta, Edmonton, Canada
LIANG Bing-chen (梁丙臣)
Shandong Province Key Laboratory of Ocean Engineering and Engineering College, Ocean University of China, Qingdao, China
WANG Le (王乐)
Engineering College, Ocean University of China, Qingdao, China
(Received September 18, 2012, Revised November 20, 2012)
The dissolved oxygen concentration is an important index of water quality, and the atmosphere is one of the important sources of the dissolved oxygen. In this paper, the mass conservation law and the dimensional analysis method are employed to study the oxygen transfer under regular and non-breaking waves, and a unified oxygen transfer coefficient equation is obtained with consideration of the effect of kinetic energy and wave period. An oxygen transfer experiment for the intermediate depth water wave is performed to measure the wave parameters and the dissolved oxygen concentration. The experimental data and the least squares method are used to determine the constant in the oxygen transfer coefficient equation. The experimental data and the previous reported data are also used to further validate the oxygen transfer coefficient, and the agreement is satisfactory. The unified equation shows that the oxygen transfer coefficient increases with the increase of a parameter coupled with the wave height and the wave length, but it decreases with the increase of the wave period, which has a much greater influence on the oxygen transfer coefficient than the coupled parameter.
dissolved oxygen, regular and non-breaking waves, oxygen transfer coefficient
Introduction
The dissolved oxygen concentration is an important index of the water quality. Generally, the dissolved oxygen in a water body originates from the atmosphere and the photosynthesis of the water-inhabiting plants, where the atmosphere is one of the important sources of the dissolved oxygen in water[1,2].
Classical film-based theories, such as two films, penetration, and surface renewal theories, were developed to explain the dependency of the oxygen transfer coefficient on the hydrodynamic and aerodynamic factors and the molecular transport properties of gases[3,4]. Although these film-based theories give simple physical pictures of the gas absorption processes, the transfer coefficient cannot be predicted by these theories alone because of existence of unknown parameters, including the film thicknesses and the surface renewal rates[5]. As far as the real ocean is concerned, the oxygen transfer coefficient is usually influenced by the wind speed. The wind tunnel experimentand the field work show that a strong correlation exists between the mass transfer coefficient and the wind speed. Under high wind conditions, this coefficient is found to be proportional to the wind speed at the standard height of 10 m above the wave surface[6-8].
These studies improved our understanding of the interfacial gas transfer processes, however, one does not have enough knowledge to predict the oxygen transfer coefficient for waves with a low wind speed (less than 3 m/s) and the zero wind speed as ship-generated waves[5]. Without the wind speed above the wave surface, the wave geometry parameters should be used rationally to express the oxygen transfer capacity. The wave slope, the drag force coefficient, the wave height and fetch were introduced to compute the mass transfer coefficient[9,10]. But they can be used only for a specific type of waves, e.g., the shallow water wave or the deep water wave, and their applications are somewhat limited.
Though there are several theoretical and field studies concerning the oxygen transfer coefficient for shallow water waves, intermediate depth water waves and deep water waves, a unified equation is not available for the mass transfer coefficient covering all above cases. Because of the limitations of the existing equations, one often has to choose a suitable equation among them to predict the transfer coefficient, depending on the wave pattern parameters. However, these equations do not predict similar transfer rates. Especially when under a condition near the transition condition between different wave types, a great discrepancy occurs between them[8]. Therefore, it is difficult to select an appropriate equation without detailed knowledge of how and under what conditions they were formulated and validated.
This paper proposes a unified oxygen transfer coefficient equation which can be used for all regular and non-breaking waves without the additional consideration of the water depth effect. Theoretical analysis and an experiment are carried out to study the oxygen transfer coefficient of regular and non-breaking waves, with considerations of the effect of the kinetic energy and the wave period. A unified equation for the oxygen transfer coefficient is proposed and validated by experimental data of intermediate depth water waves.
1. Theoretical analysis
1.1Oxygen transfer coefficient deduction for regular
and non-breaking waves

The oxygen transfer flux at wave surface can be written as follows whereFis the amount of the oxygen mass transferred over unit area and time,KLis the oxygen transfer coefficient,Csis the saturation dissolved oxygen concentration,Cis the Dissolved Oxygen Concentration (DOC),Dis the oxygen deficit andD=Cs-C.
The oxygen transfer into a stagnant water comes only through the molecular diffusion between the water and the atmosphere, but the oxygen transfer of a wave comes not only through the molecular diffusion, but also through the turbulent diffusion. Generally, the intensity of the molecular diffusion is much less than that of the turbulent diffusion, so the molecular diffusion here can be neglected to simplify the study.
According to the law of the mass conservation, the dissolved oxygen mass variation in the control volume per unit time is regarded as the net mass difference between those entering and leaving the control volume per unit time, which can be described as follows

whereAis the wave surface area of the control volume,

Lis the wave length,His the wave height,tis time,t0andt1are the initial time and the end time, respectively,Vis the volume of the control volume andC0andC1are the average DOC of the control volume at the initial time and the end time, respectively.
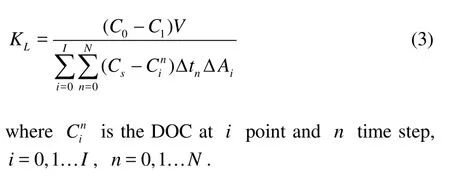
Substituting Eq.(1) into Eq.(2) and integrating over time and space, we obtain
1.2Oxygen transfer coefficient dimensional analysis of regular and non-breaking waves
With regards to the oxygen transfer coefficient of regular and non-breaking waves, the wave height, the wave length, the wave period and the water depth influence the process of the oxygen transfer.
The stronger the turbulence intensity, the larger the wave kinetic energy, and the oxygen transfer coe-fficient will be. The wave kinetic energy can be denoted by a parameter coupled with the wave height and the wave length of regular and non-breaking waves
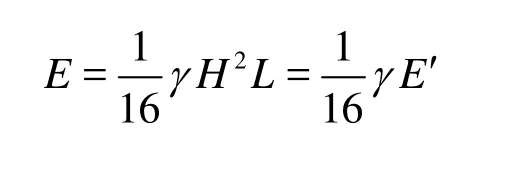
whereEis the wave kinetic energy per unit width,γis the water specific weight,E′ is a parameter coupled with the wave height and the wave length andE′=H2/L.
So the coupled parameter in the wave kinetic energy is taken as an independent variable in the dimensional analysis integrated with the water depth and the wave period. Here the coupled parameter expresses the horizontal space characteristics of the wave geometrical property, the water depth expresses the vertical space characteristics of the wave, and the wave period expresses the time characteristics.
KLcan be denoted as follows

wheredis the still water depth andTis the wave period.
In general, the oxygen transfer rate increases with the increase of the wave height, but decreases with the increase of the wave length, the wave period and the water depth. In fact, the oxygen transfer between the water and the atmosphere occurs only through the wave surface. The wave height, the wave length and the wave period influence directly the wave surface area and the occurrence frequency. For a shallow water wave, the water depth influences the oxygen transfer coefficient through the related wave geometry parameters (wave height, wave length and wave period). For a deep water wave, the wave parameters are not related with the water depth; the water depth does not influence the oxygen transfer coefficient, but influences the oxygen transfer mass and the DOC distribution. For an intermediate depth water wave, the water depth influences not only the oxygen transfer coefficient through the previously mentioned wave geometry parameters, but also the oxygen transfer mass amount and the DOC distribution. It is not suitable to express the oxygen transfer coefficient by the water depth especially in a deep water wave, and maybe one can use the related wave parameters, except for the water depth[11]. So the water depth is neglected here to deduce a unified equation for the oxygen transfer coefficient.
With the fundamental variables of length and time, we have

whereBis an undetermined constant.
After the dimensional analysis, we havex=1/3,y=-1. So

The next step is to determineKLwith Eq.(3) and experimental data. ThenBin Eq.(6) can be calculated.
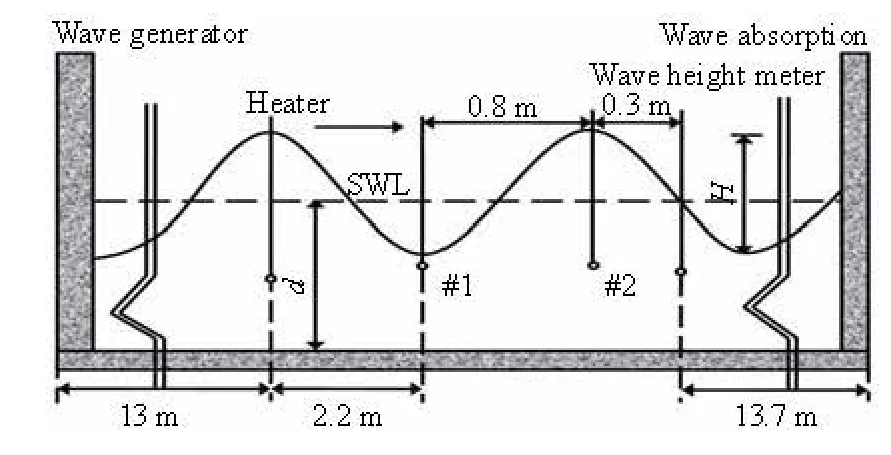
Fig.1 Schematic diagram of experiment (#1 and #2 indicate locations of 2 dissolved oxygen probes)
2. Experiments
2.1Experiment setup
An experiment was conducted in the wave channel in the hydraulic lab of Ocean University of China. The length, the width and the height of the wave channel are 30 m, 0.6 m and 1 m, respectively. The regular and non-breaking waves were generated by a piston type wave generator. The operating frequency and the stoke length of the wave generator were controlled to adjust the wave parameters as required. The tap water was used in the experiment. The water temperatureTwas controlled by a heater to make sure that it was close to 20oC. The measured water temperature varied from 19.9oC to 20.1oC, and was considered as 20oC without further corrections. The measured area lies in the middle of the wave channel. Two dissolved oxygen probes of JPBJ608 type were used to measure the DOC after the calibration with Winkler technique[12]. The distance between 2 dissolved oxygen probes is 0.8 m, and the #1 dissolved oxygen probe was put in the wave trough position to measure the DOC near the wave surface. The #2 dissolved oxygen probe was put at the position of half the still water depth to measure the DOC as the average value of the control volume. This assumption deserves a comment here. It is justified based on the references[13,14], where it was found that the DOC decreases from a higher value near the surface to a lower value near the bottom almost linearly. Thus a depth averaged dissolved oxygen can be found at the mid-depth. In addition, the gravity center of the regular wave is the same as the still water, so the assumption could be used withoutcausing major errors for the average DOC of the control volume. A wave height meter was put at the 0.3 m position after the #2 dissolved oxygen probe to measure the wave height, see Fig.1.
It was indicated that an oxygen scavenger method could be used to obtain the DOC, and the anhydrous sodium sulfite (Na2SO3) is capable of scavenging the oxygen effectively and has long been used in the presence of a catalyst (CoCl2) to scavenge the oxygen in water[15]. According to the reaction of Eq.(7), a suitable amount of Na2SO3was added into the whole channel to lower the DOC so as to reach the desired value without a complete removal of the dissolved oxygen in the experiment. CoCl2was also used to accelerate the reaction speed to ensure that the reaction is completed before the measurement. The amount of CoCl2was suggested to be about 0.1% of Na2SO3by weight[15].

With the water depth varying from 0.2 m to 0.33 m, the wave height from 0.04 m to 0.13 m, and the wave period from 0.8 s to 2 s (see Table 1), a total of 125 experimental conditions were obtained and investigated, the DOC, the wave heights, the water length and the wave period were measured, respectively.
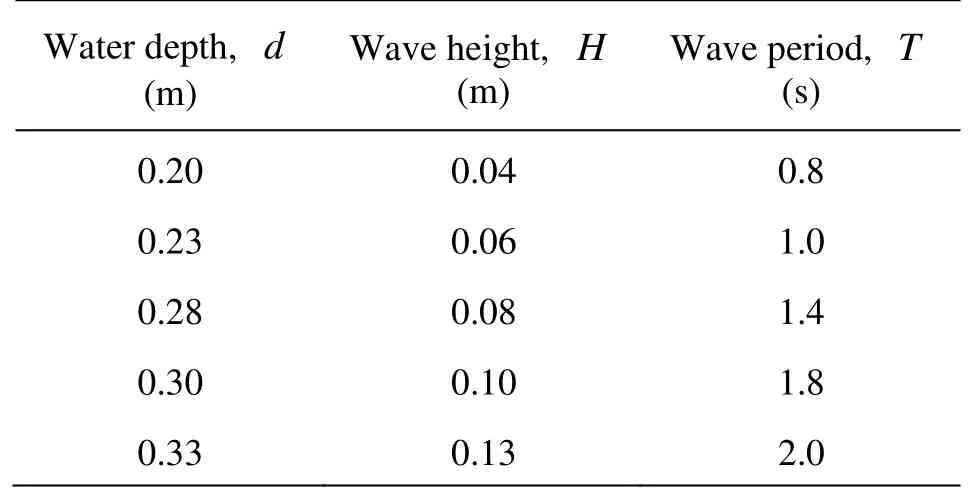
Table 1 Parameters of experiments
2.2Experiment results and analysis
Figure 2 shows the DOC of #1 and #2 dissolved oxygen probes against time for a water depth of 0.3 m. HereC1standC2ndrepresent the measured DOC of #1 and #2 dissolved oxygen probes, respectively.
Figure 2 shows that the DOC of #1 and #2 dissolved oxygen probes increase faster at the initial stage because of the great oxygen deficit in the control volume. With the increase of time, more and more oxygen is dissolved into the water, the oxygen deficit decreases to make the DOC increase more slowly and close to the saturation condition ultimately. When the DOC of the control volume reaches the saturation concentration, the mass of the oxygen entering per unit time is equal to that leaving per unit time through the wave surface, and the dynamic balance of the dissolved oxygen in the water body is reached. Figure 2 also shows that the DOC of the #1 dissolved oxygen probe increases faster than that of the #2 dissolved oxygen probe at the initial stage, and they approach each other in the end.
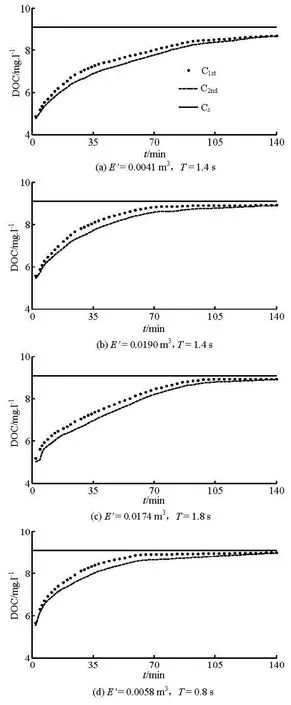
Fig.2 DOC time history of #1 and 2# dissolved oxygen probes
Figures 2 (a) and 2(b) show that the DOC increases fast with a largerE′ under the sameT. WithT= 1.4 s,E′ increases from 0.0041 m3to 0.0190 m3, the saturation time decreases from 140 min to 65 min. Figures 2(c) and 2(d) show that ifTdecreases to 44%(0.8/1.8≈0.44) andE′ decreases to 33% (0.0058 / 0.0174≈0.33), the oxygen transfer coefficient will increase to 158% according to Eq.(6). Assume thatE′andTare doubled, respectively, and the oxygen transfer coefficient will decrease to 63%, showing thatThas a much greater influence on the oxygen transfer coefficient thanE′ according to Eq.(6).
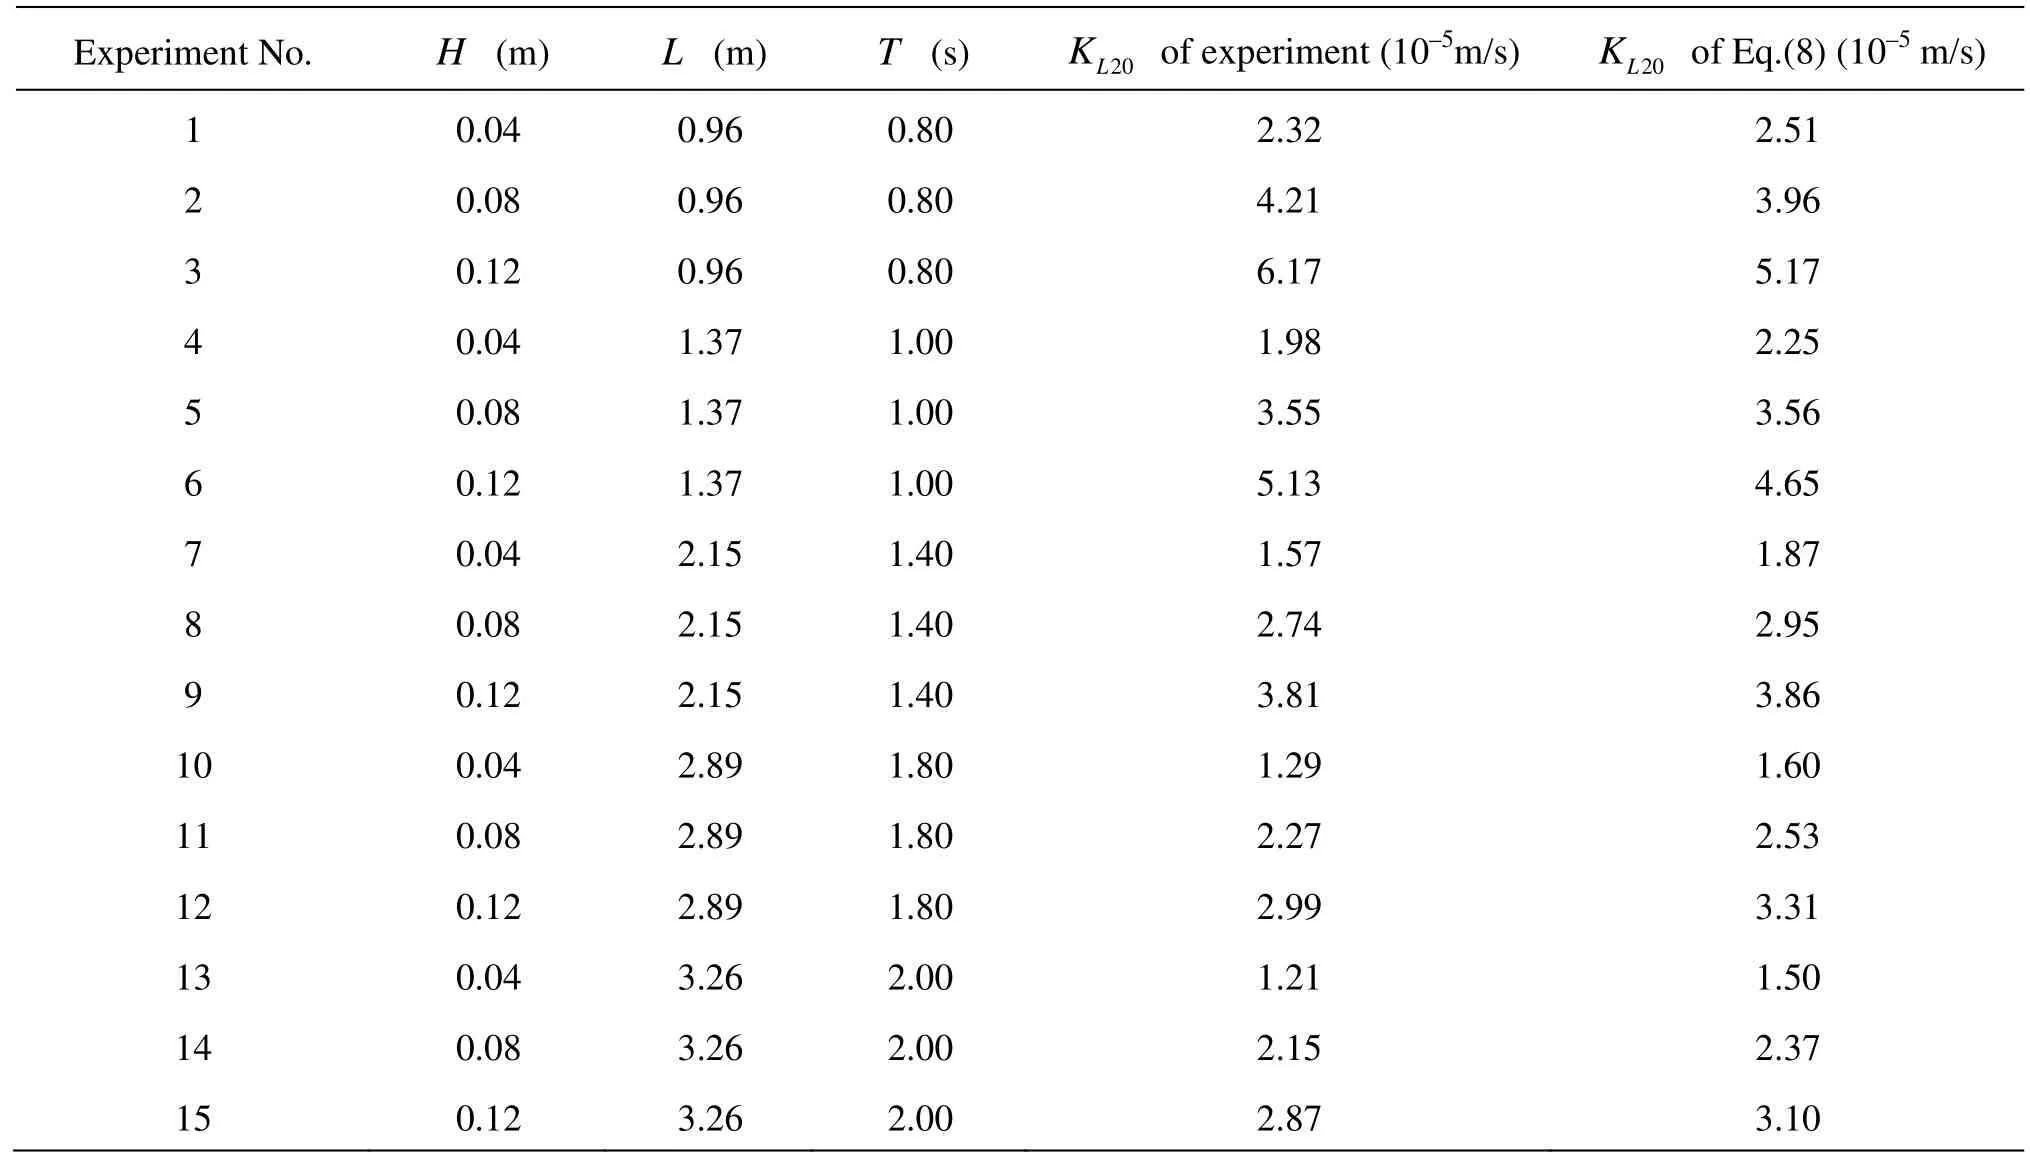
Table 2KL20comparison between Eq.(8) and experimental data
3. Determination and validation of oxygen transfer coefficient
3.1Determination of oxygen transfer coefficient
Here, the experimental results of previously mentioned 125 conditions are used with regression analysis to determine and validateBin Eq.(6), where 110 conditions are adopted randomly to determine it. The statistical software package SPSS v17.0 is employed to accelerate the analytical process with least squares method. Equation (8) is proposed to representKL20from Eq.(6).

whereKL20is the oxygen transfer coefficient when the water temperature is 20oC.
3.2Validation of oxygen transfer coefficient
Equation (8) is validated by the data from other 15 working conditions with water depth (d) of 0.3 m, see Table 2, here the wave type is all the intermediate depth water wave. Table 2 shows theKL20comparison between Eq.(8) and experimental data, and it is shown that the computed oxygen transfer coefficient based on Eq.(8) agrees with the experimental results approximately.
In order to further validate Eq.(8), the previous reported data[11]are also used, see Table 3, here the wave type again is all the intermediate depth water wave. The water temperatures in their experiments were not always kept at 20oC, andKL20was determined by the transformation as follows[16]

whereScis the Schmidt number,Sc=ν/Dm, withνbeing the kinematic viscosity of the water body,Dmbeing the molecular diffusivity,Sc20is the Schmidt number at 20oC,ν20is the kinematic viscosity of the water body at 20oC, andρ20is the water density at 20oC.
Table 3 shows that the results ofKL20based on Eq.(8) agree with the transformed experimental data of 5 conditions (No. 16, No. 17, No. 18, No. 20 and No. 21) approximately, but some greater discrepancy exists in No.19 condition. The reason is that an inconsistency maybe exists between No. 19 and No. 20, because they have the same wave length, water depthand wave period but different wave height and water temperature.KLof No. 19 should be larger than that of No. 20 theoretically, but their experimental data are just the opposite. So, it is unsuitable to use the data of No. 19 to validate Eq. (8). Tables 2-3 show that it is reliable and valid to compute the oxygen transfer coefficient with Eq.(8) at 20oC of the water temperature.

Table 3KL20comparison between Eq.(8) and previous reported data[11]
The limitations of these experiments should be pointed out. All the previously mentioned conditions are for the intermediate depth water wave due to the limitation of experimental facilities, and Eq.(8) is validated only for intermediate depth water waves. More field work and experiment data for shallow water wave and deep water wave are still expected to derive theBvalue of Eq.(6) and to compare with Eq.(8) in the future work.
3.3Discussions
Compared with the oxygen transfer coefficient in an open channel flow[17](for example,KL= 0.000045U0.5d-1.5, whereUis the average velocity), the result of Eq.(8) is much smaller in general. The reason is that the average velocity magnitude in an open channel flow is often larger than that of a regular wave, which dissolves much more oxygen into the water. And the vertical mixing capacity also increases with the increase of the average velocity, contributing to the increase of the oxygen transfer coefficient.
4. Conclusions
In this paper, the theoretical analysis and experiments are used to deduce the oxygen transfer coefficient equation for regular and non-breaking waves. The results show that the oxygen transfer coefficient increases with the increase of the parameter coupled with the wave height and the wave length, but it decreases with the increase of the wave period, which has a much greater influence than the coupled parameter.The limitation of research is that all the previously mentioned experiments are for the intermediate depth water wave, and more data for shallow water wave and deep water wave are still expected to validate the oxygen transfer coefficient equation.
Generally speaking, the natural waves behave in much more complex way than those in the lab. For example, if a breaking wave occurs, it will bring a lot of bubbles into the water. Due to the interaction between the water and the bubbles through the bubble’s surface, the DOC of the water body will change much more greatly than that on the wave surface, which is an interesting topic that requires further investigation. If wave groups occur, the wave geometry differs greatly from the regular wave, resulting in a more complicated oxygen transfer process. In future work, attention should be paid on the oxygen transfer of the breaking wave and the irregular wave to solve the practical environment problem.
[1] SCHMID B. H., KOSKIAHO J. Artificial neural network modeling of dissolved oxygen in a wetland pond: The case of Hovi, Finland[J]. Journal of Hydrologic Engineering, 2006, 11(2): 188-192.
[2] LIN J., XIE L. and PIETRAFESA L. J. et al. Dissolved oxygen stratification in two micro-tidal partially-mixed estuaries[J]. Estuarine, Coastal and Shelf Science, 2006, 70(3): 423-437.
[3] JIRKA G. H., HERLINA H. and NIEPELT A. Gas transfer at the air–water interface: experiments with different turbulence forcing mechanisms[J]. Experiments in Fluids, 2010, 49(1): 319-327.
[4] HANDLER R. A., SMITH G. B. Statistics of the temperature and its derivatives at the surface of a wind-driven air-water interface[J]. Journal of Geophysical Research, 2011, 116(C6): C06021.
[5] RO K. S., HUNT P. G. and POACH M. E. Wind-driven surficial oxygen transfer[J]. Critical Reviews in Environmental Science and Technology, 2007, 37(6): 539-563.
[6] TAYLOR P. K., YELLAND M. J. The dependence of sea surface roughness on the height and steepness of thewaves[J]. Journal of Physical Oceanography, 2001, 31(2): 572-590.
[7] FROST T., UPSTILL-GODDARD R. C. Meteorological controls of gas exchange at a small English Lake[J]. Limnology and Oceanography, 2002, 47(4): 1165-1174.
[8] RO K. S., HUNT P. G. A new unified equation for wind-driven surficial oxygen transfer into stationary water bodies[J]. Transactions of the American Society of Agricultural and Biological Engineers, 2006, 49(5): 1615-1622.
[9] BOETTCHER E. J., FINEBERG J. and LATHROP D. P. Turbulence and wave breaking effects on air-water gas exchange[J]. Physical Review Letters, 2000, 85(9): 2030-2033.
[10] DANIIL E. I., GULLIVER J. S. Influence of waves on air-water gas transfer[J]. Journal of Environmental Engineering, 1991, 117(5): 522-540.
[11] TSOUKALA V. K., MOUTZOURIS C. I. Scale effects in oxygenation in the breaker zone of coastal structures[C]. Proceedings of the 25th Coastal Engineering Conference. Orlando, Florida, USA, 1996, 1: 403-414.
[12] YAKUSHEV E. V., VINOGRADOVA E. L. and DUBININ A. V. et al. On determination of low oxygen concentrations with Winkler technique[J]. Oceanology, 2012, 52(1): 122-129.
[13] STEFANOVIC D. L. Measurement of temperature and dissolved oxygen in a lake under the ice cover[C]. Hydraulic measurements and experimental methods. Estes Park, Colorado, USA, 2002, 1-11.
[14] BORSUK M. E., STOW C. A. and LUETTICH R. A. et al. Modelling oxygen dynamics in an intermittently stratified estuary: Estimation of process rates using field data[J]. Estuarine, Coastal and Shelf Science, 2001, 52(1): 33-49.
[15] MANTHA R., TAYLOR K. and BISWAS N. et al. A continuous system for Fe0reduction of nitrobenzene in synthetic wastewater[J]. Environmental Science and Technology, 2001, 35(15): 3231-3236.
[16] DANIIL E. I., GULLIVER J. S. Temperature dependence of liquid film coefficient for gas transfer[J], Journal of Environmental Engineering, 1988, 114(5): 1224-1229.
[17] NETO E. L., ZHU D. Z. and RAJARATNAM N. Dissolved oxygen downstream of an effluent outfall in an icecovered river: natural and artificial aeration[J]. Journal of Environmental Engineering, 2007, 133(11): 1051-1060.
10.1016/S1001-6058(13)60417-5
* Project supported by the National Natural Science Foundation of China (Grant Nos. 51009123, 50809065), the Natural Science Foundation of Shandong Province (Grant No. ZR2009FQ003).
Biography: YIN Ze-gao (1977-), Male, Ph. D.,
Associate Professor
- 水动力学研究与进展 B辑的其它文章
- A one-dimensional polynomial chaos method in CFD–Based uncertainty quantification for ship hydrodynamic performance*
- Numerical analysis of cavitation within slanted axial-flow pump*
- Numerical simulation of hydro-elastic problems with smoothed particle hydrodynamics method*
- Analytic solutions of the interstitial fluid flow models*
- Experimental study of shell side flow-induced vibration of conical spiral tube bundle*
- A streamline approach for identification of the flowing and stagnant zones for five-spot well patterns in low permeability reservoirs*

