A laterally averaged two-dimensional simulation of unsteady supersaturated total dissolved gas in deep reservoir*
FENG Jing-jie (冯镜洁), LI Ran (李然), YANG Hui-xia (杨慧霞), LI Jia (李嘉)
State Key Laboratory of Hydraulics and Mountain River Engineering, Sichuan University, Chengdu 610065, China, E-mail: fengjingcg@126.com
(Received January 4, 2013, Revised February 27, 2013)
Elevated levels of the Total Dissolved Gas (TDG) may be reached downstream of dams, leading to increased incidences of gas bubble diseases in fish. The supersaturated TDG dissipates and transports more slowly in reservoirs than in natural rivers because of the greater depth and the lower turbulence, which endangers the fish more seriously. With consideration of the topographical characteristics of a deep reservoir, a laterally averaged two-dimensional unsteady TDG model for deep reservoir is proposed. The dissipation process of the TDG inside the waterbody and the mass transfer through the free surface are separately modeled with different functions in the model. Hydrodynamics equations are solved coupling with those of water temperature and density. The TDG concentration is calculated based on the density current field. A good agreement is found in the simulation of the Dachaoshan Reservoir between the simulation results and the field data of the hydrodynamics parameters and the TDG distribution in the vertical direction and their unsteady evolution with time. The hydrodynamics parameters, the temperature and the TDG concentration are analyzed based on the simulation results. This study demonstrates that the model can be used to predict the evolutions of hydrodynamics parameters, the temperature and the TDG distribution in a deep reservoir with unsteady inflow and outflow. The results can be used in the study of the mitigation measures of the supersaturated TDG.
total dissolved gas, supersaturation, unsteady flow, reservoir
Introduction
The Total Dissolved Gas (TDG) levels can reach a supersaturation downstream of high-dam spills, and the TDG supersaturation may persist for tens of kilometers downstream of the dam, which may cause bubble diseases in fish and increase the fish mortality[1,2]. When the TDG supersaturated flow goes into the deep reservoir of the downstream hydropower station, the dissipation rate of the supersaturated TDG becomes very slow due to the great water depth and the low turbulence, which might cause more damage to the fish. Mitigation measures are expected to be developed to accelerate the dissipation of the supersaturated TDG, and a feasible model and accurate predictions are needed.
Roesner and Nordon[3]first proposed a physical model of the TDG transportation in a stilling basin where the variation of the TDG level was controlled by the mass transfer coefficient and the residence time of the bubbles. Orlins and Gulliver[4]developed a twodimensional model for TDG prediction within 300 m downstream of a dam, in which both the convection and the turbulent diffusion through the bubbles and the free surface are incorporated into the TDG mass transport. Politano and Urban[5-8]simulated the TDG transport process within 1 000 m below a spillway by adopting a two-phase flow model. In Politano's model, the TDG concentration was calculated with a bubbleliquid mass transfer equation dependent on the gas volume fraction and the bubble size, and with the mass transfer across the air-water free surface being neglected. Fu[9,10]studied the Chinese Sturgeon downstream of Gezhouba dam and performed an unsteady simulation with a two-phase model for the simulation of the TDG transportation 3 000 m downstream of the Gezhouba Dam, where the source term in the TDG transport equation was expressed with the mass tran-sfer through both the bubble-liquid interface and the air-water free surface and where the mass transfer coefficient of the air-water free surface was determined by the bubble velocity and the turbulent kinetic energy. The studies described above all focused on the generation process of the TDG in the stilling basins, where the dissipation process is not prominent in the area less than three kilometers away from the dam. It has been shown that the mass transfer across the bubble-liquid interface is dominant in the stilling basin, whereas the mass transfer across the air-water free surface during the dissipation process is in the area far from the stilling basin. Until now, few studies have devoted on the prediction of the TDG dissipation process. Combining the field observation with a theoretical analysis, Picktt et al.[11]proposed a longitudinal model to predict the TDG dissipation process along the river far from the spillway. In the model, the TDG dissipation process was assumed to follow a firstorder kinetics equation and a formula taking account of the effects of velocity, water depth and molecular diffusion was used to estimate the key parameter, the dissipation coefficient, in the model. The model was validated by the field data of the Columbia River. Based on the field observation of several rivers. Feng et al.[12]modified the formula proposed by the Univer- sity of Washington by defining a comprehensive coe- fficient that incorporates the turbulent diffusion and the molecular diffusion, whereas only the molecular diffusion was taken into account in the formula propo- sed by the University of Washington. Perkins and Richmond[13]developed a depth-averaged two-dimen- sional model, MASS2, to simulate the TDG distribu- tion in shallow rivers and to further evaluate the in- fluence on fish. Johnson et al.[14]adopted the model MASS2 to calculate the TDG concentration in the rea- ches downstream of the Bonneville Dam and the Ice Harbor Dam.
Generally speaking, the existing prediction models for the TDG dissipation process are limited by one-dimensional longitudinal models or depth-averaged two-dimensional models. Such models are applicable for the prediction of the TDG dissipation processes in long and narrow or shallow water bodies but would fail for deep water bodies such as reservoirs. The existing multi-phase models are unable to accommodate the scope and the complexity of large-scale projects. Because the vertical characteristics of the TDG in a deep reservoir are important, it is necessary to develop a depth-averaged model for deep and largescaled reservoirs.
1. Model and methods
The hydrodynamics parameters and the temperature are solved in a coupled manner with the code CEQUAL-W2. The codes for the simulation of the TDG transportation and the dissipation are developed by the authors and incorporated into the CE-QUAL-W2 codes. The CE-QUAL-W2 is based on a two-dimensional laterally averaged hydrodynamic and water quality model that was developed by the U.S. Army Corps of Engineers. The equations of the CE-QUALW2 model and the TDG transportation are listed as follows:
(1) Governing equations
The continuity equation

The momentum equations
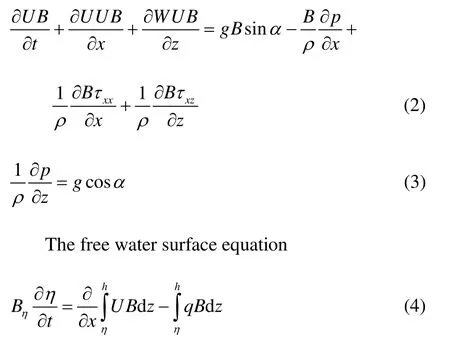
The density is the essential parameter for the solution of the momentum equations. The equation of state relates the density to the temperature and can be expressed as

In the above equations,U andWdenote the temporal mean velocity components in the horizontal and vertical directions,xandzrepresent the horizontal distance and the vertical elevation,Bis the width, q is the specific discharge,t denotes the time,gis the acceleration of gravity,prepresents the pressure andρdenotes the density,τxxand τxzare defined as the turbulent shear stress acting inxdirection on thex -face of the control volume,αis the angle of the river bed toxdirection,ηandhare the water surface and the water depth,Tw,ΦTDSand ΦISSrepresent the water temperature, the total dissolved solid and salinity and inorganic suspended solids, theΦTDSand ΦISSare not considered in this simulation.

Fig.1 Grids of the simulated area
(2) Transportation equation
The transportation equation for scalar variables, such as the temperature and the TDG, is

where Φdenotes a scalar variable.
The source term for the temperature concerns only the surface heat exchange

where Hnis the net rate of the heat exchange across the water surface,Hsdenotes the incident short wave solar radiation,Harepresents the incident long wave radiation,Hsrand Harare the reflected radiations of short waves and long waves, respectively,Hbris the back radiation from the water surface,Herepresents the evaporative heat loss; andHcdenotes the heat conduction.
The source term of the TDG is defined as

where Cdenotes the average TDG concentration expressed as the percent of the saturation concentration, Csis the saturation concentration at the local atmospheric pressure,Ceqis defined as the equilibrium saturation level of each cell relative to the local pressure and temperature,kTis the dissipation coefficient in the water body and is zero when Ceq-C>0, (KLa)sis the surface mass transfer coefficient across the air-water surface interface andadenotes the specific surface area.

The following expression is widely used in the evaluation of the surface mass transfer coefficient across the air-water surface interface KLwhereSc is the Schmidt number Sc=D/ν,Drepresents the molecular diffusion andνdenotes the eddy viscosity of water,εis the rate of the energy dissipation.
As the rate of the energy dissipationεand the turbulent energyκare not calculated in the model, another empirical formula to evaluate the surface mass transfer coefficient,(KLa)s, proposed by O’Connor[15], is employed in the model.

where vwrepresents the wind speed at the height of 10 m.
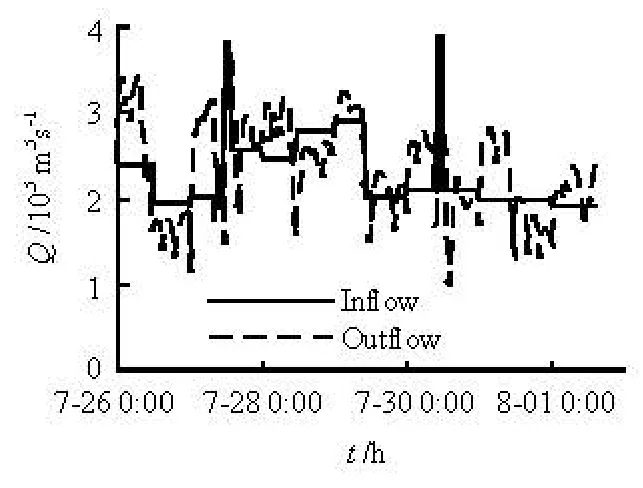
Fig.2 The flow rates of the inflow and the outflow (2008)
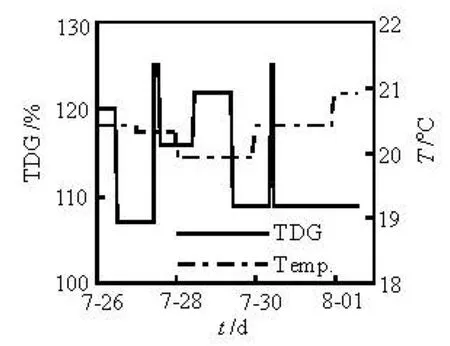
Fig.3 The temperature and the TDG saturation of the inflow (2008)
(3) Discrete methods
The finite difference method is employed in the discretization of the governing equations and the transportation equation.
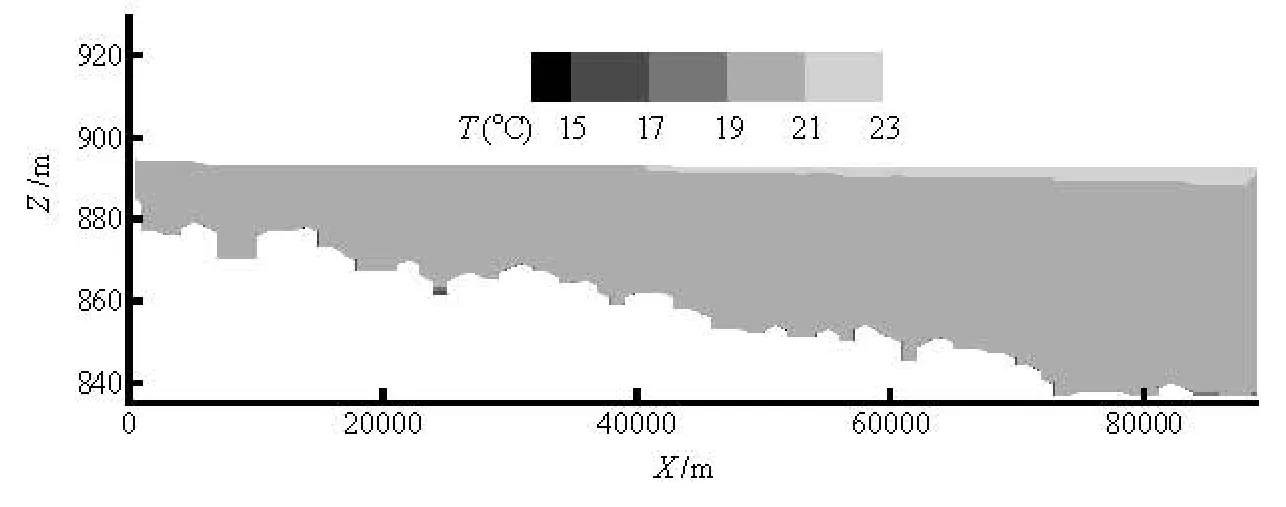
Fig.4 The initial temperature field of the Dachaoshan Reservoir (July 26, 2008 0:00)
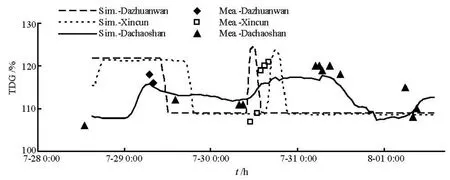
Fig.5 The comparison of the TDG between the numerical results and the field data at typical cross-sections (2008)
The discretization of the free water surface equation is based on an explicit scheme. The discretization of the momentum equation is carried out by a combined method, with the vertical diffusion terms being discretized in a fully implicit scheme and the advection terms by a time-weighted, central difference, implicit scheme. An unique feature of the vertical advection, in the explicit part of the time-weighted scheme, is QUICKEST, which enhances the overall accuracy and is developed by Leonard. The discretization of the transportation equation is carried out by a similar method as for the momentum equation.
2. Numerical simulations
2.1 The description of the case and the grid generation
The case is based on the operational conditions of the Dachaoshan Reservoir on the middle reach of the Langcangjiang River in southwest China. The simulated period is from July 26, 2008 to August 1, 2008. The simulated region includes 90 km of the river, which starts from the Manwan Dam and ends at the Dachaoshan Dam. The simulation area is meshed with a scale of 1 000 m in the longitudinal direction and 1 m in the vertical direction. The grids of the simulation area are shown in Fig.1.
2.2 Boundary and initial conditions
The topographic data of the Dachaoshan Reservoir are used to build the simulated zone. The flow rate of the inflow and the outflow during the simulated period are determined according to the operational conditions of the reservoirs. The TDG concentration and the temperature of the inflow are based on the field observation data. The boundary conditions with the time are shown in Fig.2 and Fig.3.
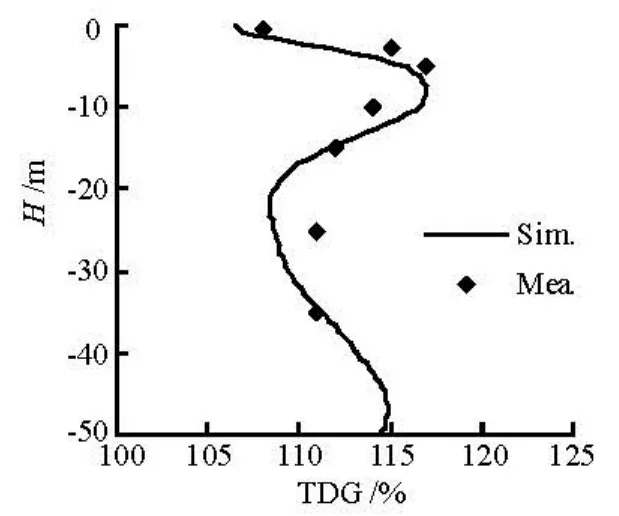
Fig.6 A comparison of the vertical distribution between the numerical results and the field data
The observed temperature in the reservoir is taken as the initial condition, as shown in Fig.4. The observed TDG saturation of the tail water of the Dachaoshan station on the first observed day is 106%.This value is taken as the initial TDG saturation level of the entire simulated area in the Dachaoshan Reservoir.
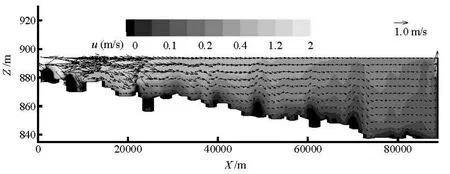
Fig.7 The flow field of the Dachaoshan Reservoir (July 31, 2008)
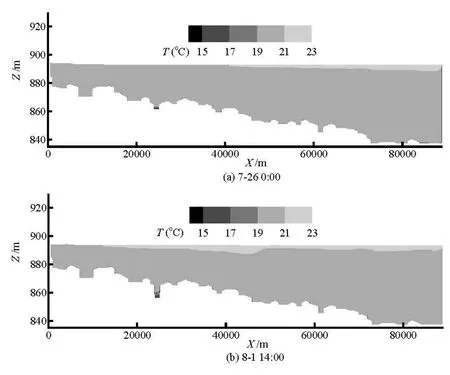
Fig.8 The temperature distribution in the Dachaoshan Reservoir (2008)
2.3 Parameter determination
The equilibrium saturation concentration Ceqis related with the pressure, the temperature and the turbulence. In this simulation,Ceqis considered to be influenced only by the static pressure of water, asCeq= 100+10h , wherehrepresents the local depth under the free surface. The saturation concentration at the local atmospheric pressureCsis 100% in the simulation. When Ceqis less than Cs, the dissipation coefficient,kT, is determined to be 0.003 h–1according to the field observation in the Dachaoshan Reservoir[16]. Otherwise,kTis assumed to be zero. The surface mass transfer coefficient across the air-water free surface (KLa)sis calculated by Eq.(10), where the wind speed is assumed to be 0.9 m/s according to the meteorological data from the Goutoupo Weather Station, 12 km away from the Dachaoshan Reservoir.
2.4 Verification of the model
Three cross-sections are chosen to analyze the variation of the supersaturated TDG in time and space. The three cross-sections are the Dazhuanwan Dock, the Xincun Dock and the Dachaoshan Dam, which are 16 km, 40 km and 90 km downstream of the Manwan Dam, respectively. The locations of the cross-sections are shown in Fig.1.
The TDG measurements at the Dazhuanwan Dock and the Xincun Dock are conducted at the water surface layer. For this reason, the simulated results on the surface layer are compared with the field data, as shown in Fig.5. The observed result agrees generally with the simulated result.
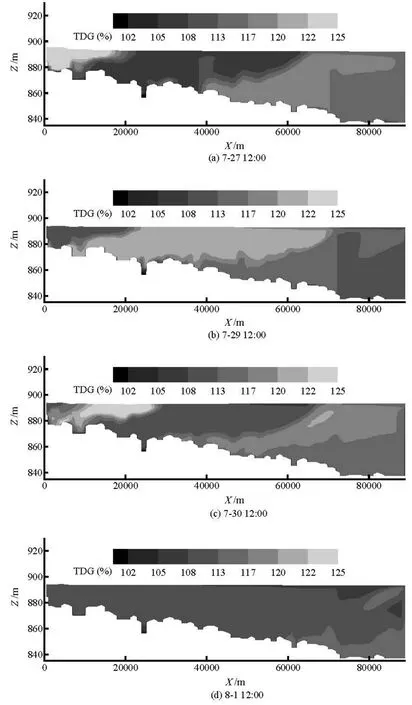
Fig.9 TDG distribution in the Dachaoshan Reservoir (2008)
The figure shows that the TDG supersaturation varies with time, and the tendencies of different crosssections are similar. The farther the section is from the Manwan Dam, the lower the crest value is and the smoother the curve is.
The vertical distribution of the TDG on the crosssection 500 m upstream of the Dachaoshan Dam was measured on August 1st. A comparison between the simulated results and the field measurements reveals that they are in a good agreement, as shown in Fig.6.
Figure 6 shows that the TDG saturation level increases with the water depth in the upper layers near the free surface. The maximum TDG saturation appears at a water depth of approximately 5 m to 10 m, below that depth, the TDG saturation decreases with the water depth and reaches the minimum value at the depth of approximately 20 m. The simulated results are in fairly good agreement with the measured data inthe region with water depth less than 20 m. In the region with water depth greater than 20 m, the curve ascends again with the water depth, whereas the measured data remain constant. The simulated results present a large error in such a deep area.
The above comparative analysis of the unsteady process and the vertical distribution of the supersaturated TDG indicates that the simulated results agree with the field data. The verification demonstrates that the laterally averaged TDG model developed in the paper is suitable for the prediction of the unsteady TDG transportation and the dissipation process in a deep reservoir.
2.5 Simulation results
(1) The flow field
The simulated flow field in the Dachaoshan Reservoir is shown in Fig.7. The velocity near the inflow area is high, with a maximum value of 3 m/s. The velocity decreases when the water depth increases and the direction is towards downstream. The velocity magnitude in the region near the Dachaoshan Dam is approximately 0.2 m/s.
(2) The temperature field
The temperature evolution of the inflow boundary condition from July 26 to August 1 is shown in Fig.3. The water temperature in the reservoir changes during the simulated period. The comparison between the initial temperature field and the field at the end of the simulation is shown in Fig.8.
(3) The TDG concentration field
The inlet boundary condition of the TDG saturation is shown in Fig.3. The evolution of the TDG saturation field in the reservoir on each simulation day is depicted in Fig.9.
Figure 9 shows that the supersaturated TDG is transported beneath the water surface like a cloud. Such a movement is due to the temperature difference between the inflow and the water in the reservoir. The TDG saturation increases when the cloud reaches the surface. As the TDG cloud moves underwater at a certain depth, the maximum TDG saturation appears at a depth of 5 m to 10 m, and the TDG saturation decreases with the water depth in the deep area. It is also shown that the TDG supersasturation level is high sometimes in the bottom area. Such phenomenon is also observed by the author in other reservoirs. It is closely related with the flow characteristics in the reservoir, and the altitude of the spillway and the power intake. The basic reason is that the inflow with higher supersaturated TDG in the last flood retained in the bottom of the reservoir.
Figure 9 also reveals that the inflow TDG saturation contributes to the distribution of the TDG in the reservoir. The supersaturation of the TDG dissipates very slowly as the flow moves downstream with diffusion and dissipation. The supersaturated TDG, driven by the density current, spreads gradually in the vertical direction.
The evolution of the flow demonstrates that it takes three days for the highly supersaturated TDG to flow from the Manwan Dam to the Dachaoshan Dam. The monthly replacement rate, which is defined as the ratio of the total flow rate of a month and the storage capacity, is calculated to be ten times a month under the current flow and storage capacity conditions. This value agrees with the transportation residence time from the simulation; thus, the simulation result of the TDG transportation in the Dachaoshan Reservoir is reasonable.
3. Conclusions
(1) A laterally averaged two-dimensional unsteady model is proposed to predict the TDG transportation and dissipation processes in a deep reservoir. Multiple parameters, such as the dissipation coefficient of the TDG and the mass transfer coefficient through the free surface, are included in the model. Hydrodynamics equations were solved coupling with those of water temperature and density. The TDG concentration is calculated based on the density current.
(2) The model is verified by the observed data in the Dachaoshan Reservoir. Good agreement between the numerical and observed results shows that the model is applicable for a deep reservoir.
(3) The TDG supersaturated flow is transported in the shape of a cloud beneath the water surface. The TDG saturation level decreases slowly due to dissipation and diffusion as the flow transports downstream. The supersaturated TDG, driven by the density current and diffusion, spreads in the vertical direction.
(4) A comparison of the TDG evolutions at three locations in Dachaoshan Reservoir indicates that the farther the flow is from the inlet, the less abrupt the change in the TDG is. The percent saturation increases with the water depth at the layers near the water surface. After reaching the maximum value at a depth of approximately 20 m, the TDG level decreases gradually.
(5) Further work should focus on accurately determining the dissipation coefficient and the mass transfer coefficient, which are usually calculated by empirical methods or by assuming them to be fixed values.
[2] TAN De-cai, NI Chao-hui and ZHENG Yong-hua et al. Dissolved gas supersaturation downstream of dam and its effects on fish[J]. Freshwater Fisheries, 2006, 36(3): 56-59(in Chinese).
[1] WEITKAMP D. E., SULLIVAN R. D. and SWANT T. et al. Gas bubble disease in resident fish of the lower Clark Fork River[J]. Transactions of the American Fisheries Society, 2003, 132(5): 865-876.
[3] ROESNER L. A., NORTON W. R. A Nitrogen gas (N2) model for the lower Columbia River, final report[R]. Portland, USA: Portland District, North Pacific Divi- sion, U. S. Army Corps of Engineers, 1971, 1-350.
[4] ORLINS J. J., GULLIVER J. S. Dissolved gas supersaturation downstream of spillway ΙΙ: Computational model[J]. Journal of Hydraulic Research, 2000, 38(2): 151-159.
[5] POLITANO M., CARRICA P. and CONVERTI J. A model for turbulent polydisperse two-phase flow in vertical channels[J]. International Journal of multiphase Flow, 2003, 29(7): 1153-1182.
[6] POLITANO M. S., CARRICA P. M. and TUAN C. et al. A multidimensional two-phase flow model for the total dissolved gas downstream a spillway[J]. Journal of Hydraulic Research, 2007, 45(2): 165-177.
[7] POLITANO M. S., CARRICA P. and WEBER L. A multiphase model for the hydrodynamics and total dissolved gas in tailraces[J]. International Journal of Multiphase Flow, 2009, 35(11): 1036-1050.
[8] URBAN A. L., GULLIVER J. S. and JOHNSON D. W. Modeling total dissolved gas concentration downstream of spillway[J]. Journal of Hydraulic Engineering, 2008, 134(5): 550-561.
[9] FU Xiao-li, LI Da-mei and JIN Guo-yu. Calculation of flow field and analysis of spawning sites for Chinese Sturgeon in the downstream of Gezhouba dam[J]. Jour- nal of Hydrodynamics, Ser. B, 2007, 19(1): 79-83.
[10] FU Xiao-li, LI Da-mei and ZHANG Xiao-feng. Simulations of the three-dimensional total dissolved gas saturation downstream of spillways under unsteady conditions[J]. Journal of Hydrodynamics, 2010, 22(4): 598-604.
[11] PICKTT P. J., RUEDA H. and HEROLD M. Total maximum daily load for total dissolved gas in the Mid-Columbia River and Lake Roosevelt, Appendix C, technical analysisi of TDG processes[R]. Washington DC, USA: Washington State department of ecology publica- tion, 2004, 04-03-002.
[12] FENG Jing-jie, LI Ran and LI Ke-feng et al. Study on release process of supersaturated total dissolved gas downstream of high dam[J]. Journal of Hydroelectric Engineering, 2010, 29(1): 7-12(in Chinese).
[13] PERKINS W. A., RICHMOND M. C. MASS2, modular aquatic simulation system in two dimensions: Theory and numerical methods[R]. Paci fi c Northwest National Laboratory Report. Richland, Washington, USA: Pacifi c Northwest National Laboratory, 2004, PNNL-14820- 1.
[14] JOHNSON E. L., CLABOUGH T. S. and PEERY C. A. et al. Estimating adult Chinook salmon exposure to dissolved gas supersaturation downstream of hydroelectric dams using telemetry and hydrodynamic modeks[J]. River Research and Applications, 2007, 23(9): 963- 978.
[15] O’CONNOR D. Wind effects on gas-liquid transfer coefficients[J]. Journal of Environmental Enginee- ring,1983, 109(3): 731-752.
[16] LI R., HODGES H. D. and FENG J. et al. A comparison of supersaturated total dissolved gas dissipation with dissolved oxygen dissipation and reaeration[J]. Journal of Environmental Engineering, 2013, 139(3): 385-390.
10.1016/S1001-6058(11)60378-9
* Project supported by the National Natural Science Foundation of China (Grant Nos. 51179111, 51279115).
Biography: FENG Jing-jie (1986-), Female, Ph. D. Candidate
LI Ran, E-mail: liran@scu.edu.cn
- 水动力学研究与进展 B辑的其它文章
- Experimental hydrodynamic study of the Qiantang River tidal bore*
- Numerical simulation of scouring funnel in front of bottom orifice*
- Evaluation of suspended load transport rate using transport formulas and artificial neural network models (Case study: Chelchay Catchment)*
- Simulation of water entry of an elastic wedge using the FDS scheme and HCIB method*
- Application of signal processing techniques to the detection of tip vortex cavitation noise in marine propeller*
- Analysis and numerical study of a hybrid BGM-3DVAR data assimilation scheme using satellite radiance data for heavy rain forecasts*

