Numerical simulation of scouring funnel in front of bottom orifice*
XUE Wan-yun (薛万云), HUAI Wen-xin (槐文信), Li Zhi-wei (李志伟),
Zeng Yu-hong (曾玉红), QIAN Zhong-dong (钱忠东), Yang Zhong-hua (杨中华)
State Key Laboratory of Water Resources and Hydropower Engineering Science, Wuhan University, Wuhan 430072, China, E-mail: xuewanyun@126.com
(Received March 19, 2013, Revised April 22, 2013)
The scouring funnel in front of a bottom orifice under the condition of fixed water levels is simulated by using an Eulerian two-phase model, with onsideration of the flow-particle and particle-particle interactions. The predictions of the scouring funnel shape agree well with laboratory measurements. The flow-field characteristics of the two phases and the influences of the hydraulic and geometric parameters on the shape of the scouring funnel are analyzed on the basis of the computation results. It is revealed that the non-dimensional maximum scour hole parameters, the depth dm/do, the length lm/do, and the half-width wm/do, are linear with the densimetric Froude numberFro, the main parameter describing the scour hole, the centerline scour depth Dcand the half-scour widthWrvary according to a power law, and the transverse scour profiles exhibit strong similarities, the velocity distribution of the water is confined within the sink-like area near the orifice, and the mutual impact of the flows at the azimuthal sections and the resistances of the walls and the sand layer produce a vortex in the scour hole, that makes the sand particles to be suspended in the water, the exchanging water in the pore water is the main contributor in forcing the sand to move, and transporting the sand in the same direction as the pore water along azimuthal sections.
scouring funnel, Eulerian model, numerical simulation, Densimetric Froude number
Introduction
The flows in natural rivers always carry a certain amount of sediment. To release the build-up of sediment near the base of dams or water-intake structures, suitable outlets (such as tunnels, bottom sluice gates or orifices) are used, that would reduce the siltation and prolong the life of the structures. However, during the drawdown flushing, the scouring funnels will be formed through the erosive action of the flows on the sediment beds in front of the outlets. The flow pattern and the level of sediment transport along the sloping bottom with a submerged outlet have a critical bearing on the design and the operation of the outlet structures for the flow and sediment controls.
A number of numerical and experimental studies were conducted on this subject. Guo et al.[1]conducted a series of experiments to study the funnel configuration under specific geomorphy conditions and it is found that the scour funnel has the two-dimensional feature under the specific condition and the deposit materials transport to the dam simultaneoursly. Bryant et al.[2]conducted experiments to study the flow upstream of a small orifice, a large orifice, an orifice near the free surface, and multiple orifices and they modified the Shammaa et al.’s[3]potential flow solution to improve the prediction of the velocity profiles near the orifice. Based on experimental data, Wang[4]divided the scour funnels in front of dams into big and small funnels and obtained by using the regression analysis an empirical formula for the slope of the smaller funnel.
In view of the complicated temporal and spatial variations of the physical conditions and the domain constraints, the numerical modeling is considered tobe one of the effective and reliable means to solve various problems related to the fluid flows and the transport phenomenon. Lai and Shen[5]reported a 1-D model to predict the sediment discharge over time during the flushing events. Shen[6]discussed modifications to Lai and Shen’s[5]model and elaborated on the risk associated with planned flushing operations for flood control structures. Cao[7]solved a set of 2-D Reynolds-averaged equations using the Boussinesq assumption to study the flow and the sediment transport with a submerged orifice outlet. A two-dimensional numerical model of the vertical jet scour was developed by Huai et al.[8]based on the turbulent flow theory and the jet scour mechanism, and their model can simulate the process of the jet scour of a sandy bed very well. Lu et al.[9]conducted a 3-D water and sediment mathematical model to simulate a scouring funnel in front of a sand-flash channel of a reservoir by using a random walk statistical method, and the flow fields and the bed geographies in front of bottom orifices were accurately simulated. Feng et al.[10]established a 3-D mathematical model for the scouring funnel shape in front of a dam based on the vertical coordinate transformation and the “movable rigid-lid”under the surface boundary condition, and their simulation results agree well with experimental data with respect to the 3-D flow characteristics near the orifice. Hu and Wang[11]used a hybrid finite-analytic based model for simulating flows and suspended sediment concentrations along a sloping channel with submerged 2-D and 3-D outlets, and the results were shown to compare well with the analytical solutions and the experimental measurements.
Among many previous numerical studies of the scouring funnel, only a few of them devoted to the determination of the scouring funnel shape by using a two-phase flow model. In this study, an Eulerian twophase model[12,13]is used to simulate the scouring funnel under the condition of a constant water level. The flow field of the two phases, the scouring funnel shape, and the vortex structure are simulated. The influencing factors of the scouring funnel formation and the dynamics of the water and the particle are studied.
1. Mathematical model
In the Eulerian two-phase model, it is assumed that the sediment-laden flow consists of the phases of the sediments and the fluid f, which are separate yet form an interpenetrating continua. The momentum and continuity equations are solved for each phase individually. Coupling is achieved in the model through the pressure and the interphasial exchange coefficients. A symmetric drag model is used to describe the interaction between phases. The model details were described by Enwald et al.[12].
1.1 Governing equations The continuity equations for both the fluid and the sediment phases take the form

where t=f, s , the pairs αf,αsand ρf,ρsare the respective volumetric fractions and mass densities of the fluid and the sediment.
The momentum equations for the fluid and sediment phases can be expressed, respectively, as
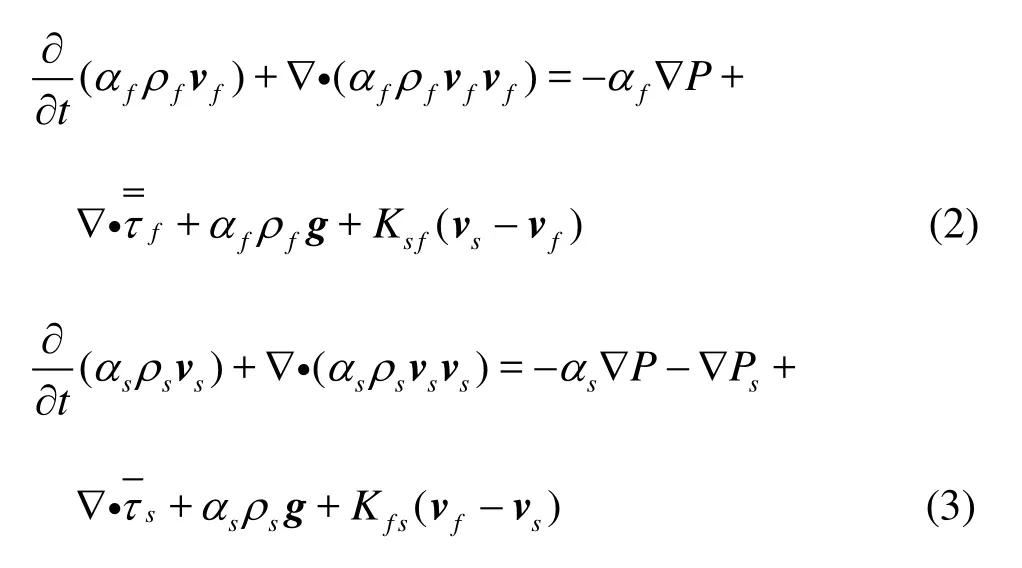

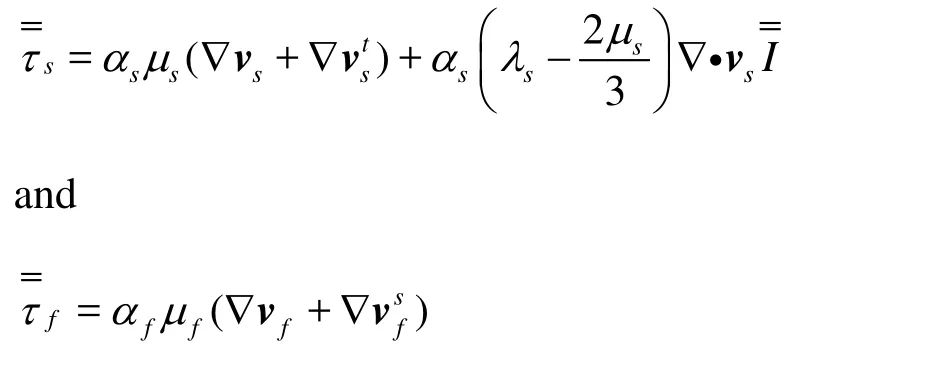
Here λsis the bulk viscosity of the sediment,gthe gravitational acceleration, andµfthe shear viscosity of the fluid. The shear viscosity of the sedimentµs= µs,col+µs,kin+µs,fr, where µs,kinis the kinetic viscosity,µs,frthe frictional viscosity, and µs,colthe collisional viscosity. The interphasial momentum exchange coefficient is denoted asKfs=Ksf.
1.2 Fluid-phase turbulence equation
A standard k-εmodel, supplemented with additional terms for the interfacial turbulent momentum transfer, is used to predict the turbulent quantities of the fluid phase. The turbulent kinetic energykfand its rate of dissipation εfare governed by the following transport equations:
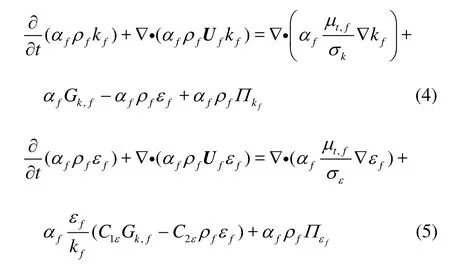
where Ufis the phase-weighted velocity,µt,fthe turbulent viscosity, andΠkfand Πεfare the influences of the sediment phase on the fluid phase.
1.3 Solid-phase turbulent equation
To predict the turbulence in the solid phase, the Tchen’s theory[14]on the dispersion of discrete particles in homogeneous and steady turbulent flows is employed. The dispersion coefficients, the correlation functions, and the turbulent kinetic energy of the solid phase are represented in terms of the characteristics of the continuous turbulent motion in the fluid phase based on two time scales. The first time scale is relevant to the inertial effects acting on the particle, and is expressed as

where CV=0.5is the added-mass coefficient. The second time scale is the characteristic time for the correlated turbulent motion or the eddy-particle interaction time, which is written as

The ratio between these two time scales is

Thus, defining b=(1+ CV)(ρs/ρf+ CV)-1, the turbulent kinetic energy for the solid phase is

the covariance of the velocities of the fluid phase is

and the eddy viscosity for the solid phase is

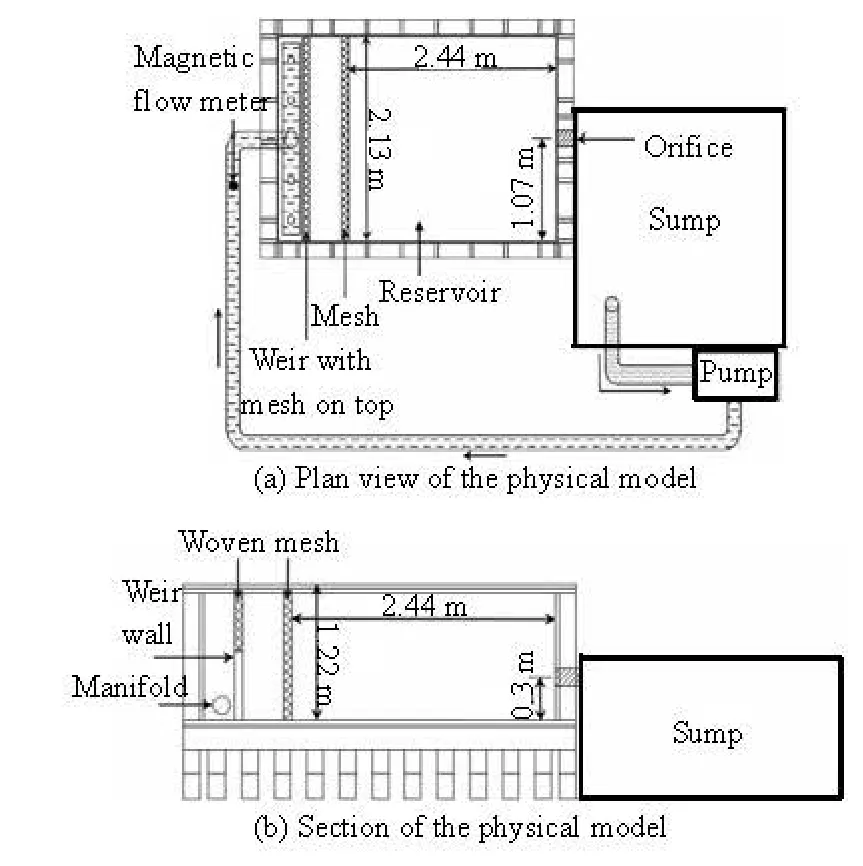
Fig.1 Schematic diagram of the experimental configuration[15]
2. Physics model and computational conditions
2.1 Details of the physics model

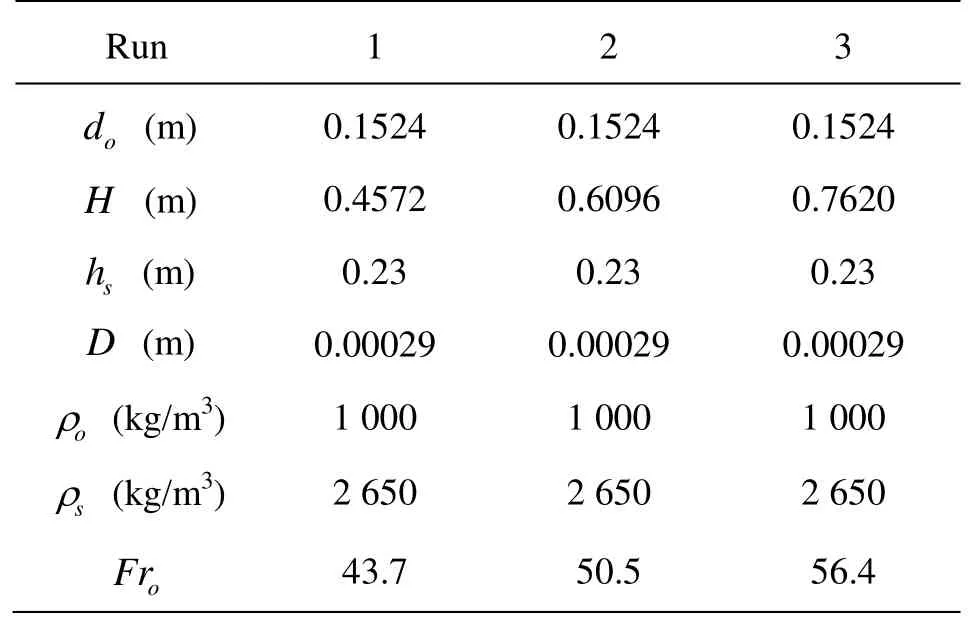
Table 1 Detail of experiments
2.2 Boundary conditions and the numerical method
Figure 2 shows a diagram of the initial conditions and the boundary condition. A velocity inlet boundary condition defining the velocity and the scalar properties of the flow is used at the flow inlet (Fig.2(b)), and the turbulence intensity level is assigned to 0.1% based on the mean velocity of the water. The pressure outlet boundary condition, which requires the specification of the gauge pressure at the outlet boundary, is imposed at the orifice. The water surface is defined as a symmetry boundary where zero normal velocity and zero normal gradients for all variables are assighned. The wall boundary conditions are applied on other sides of the reservoir, and the no-slip condition is applied at the walls. A 3-D non-uniform unstructured grid system with 4.8×10⁶elements is generated in these simulations.
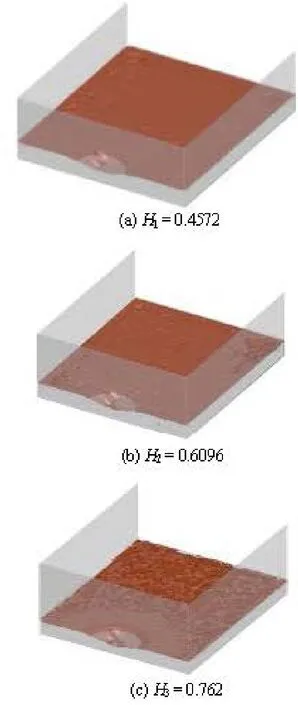
Fig.3 Scoured hole under constant head H

Fig.4 Scour hole parameters

Table 2 Comparison of non-dimensional scour parameters
In the simulations, the governing equations and the turbulent equations for the water and the sediment are solved in a Cartesian coordinate system using a finite-volume method. The Phase-Coupled SIMPLE algorithm is adopted to resolve the coupling between the velocity and the pressure. The second-order upwind scheme is selected to discretize the diffusion and convection terms in the governing equations. The first-order upwind scheme is applied to the volume fraction equation.
3. Results and discussions
3.1 Scouring funnel shape
Three computational shapes of the scouring funnel, each with different heads Hin the equilibrium, are shown in Fig.3, the red surfaces mark the water-sand interface. The scour holes are formed in front of the orifice due to the scouring action of the water, with the holes varying in size depending on the head (Figs.3(a)-3(c)). The extent of the scour hole increases with the increase of the head, and the extent of the scour hole reaches a maximum when the head H=H3(Fig.3(c)).
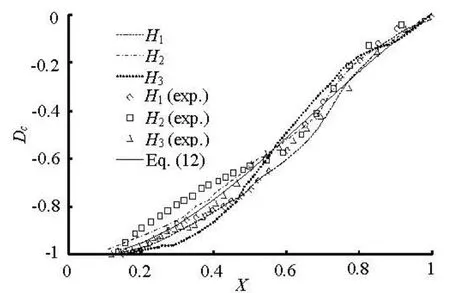
Fig.5 Non-dimensional centerline scour depth profiles
With a Cartesian coordinate system with the origin at the orifice invert, a sketch outlining the scour profile is shown in Fig.4, whered is the scour depth (the maximum scour depth is denoted as dm),wthe scour half-width (the maximum scour half-width wm), andl the axial scour length (the maximum axial scour length lm). After the bed reaches an equilibrium, it is indicated in Table 2 that the computational and experimental non-dimensional parameters of the scour profiles, including the headH, the maximum scour depth, the maximum scour half-width, and the maximum axial scour length scale in three cases are in a good agreement. Figure 5 shows the non-dimensional centerline scour depth profiles,Dc=dc/dmversus X= x/ lm, where dcis the orifice centerline scour depth and is assumed to be positive. As seen from Fig.5, the numerical results agree well with the experimental data, and the centerline scour profiles are selfsimilar. However, there are some differences between the computational and experimental profiles around the base of the slope. The computational profiles are in dynamic states whereas the experimental profiles are static, because the experimental profiles were measured after the suspended particles had settled down on the slope. Thus, the dynamic profiles would be slightly different from the static profiles. The trend for the non-dimensional centerline scour depth profiles can be described by


Fig.6 Variation of the half-scour width with distance upstream of the orifice (H= H3)
The variation of the non-dimensional half-scour width Wr=w/ wmwith the distance upstream of theorifice at the highest head H=H3obtained from the numerical results and the experimental results is shown in Fig.6. The comparison between them is favorable. The experimental data forX>0.85was not obtained because of limitations of the measuring equipment, but the simulation can accurately give results whenX>0.85. The data could be approximated with the following analytic expression

Figure 7 presents the non-dimensional transverse scour profiles again at the highest head H=H3for various locations Xoupstream of the orifice, where Xo=x/do=0.25, 0.5, 1.0. The scour hole depth and the distance along the y-axis are non-dimensionalized by the centerline scour depth for each profile(D=d/ dc)and the half-width of the scour profile(Y=y/ w), respectively. The numerical results agree well with the experimental data, and the non-dimensional transverse scour profiles are similar, for which the mean trend is expressed by

However, there are certain differences between these computational and experimental profiles at the scour hole bottom due to the relatively strong turbulence and the secondary flow phenomenon that cause uneven distributions of particles there.
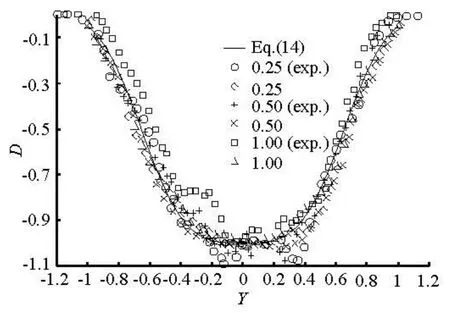
Fig.7 Non-dimensional transverse scour depth profiles (H= H3)
3.2 Quantitativeanalysis
In th e e xpe ri me n ts by Powell and Khan[15], the headH , the orifice diameter do, the water density ρf, the sediment density ρs, the medium diameter of the sandD, and the kinematic viscosity of the fluid ν are considered as the influencing factors determining the scour hole dynamics. To derive equations for the maximum scour depth, the maximum scour half-width, and the maximum axial scour length, as influenced by the aforementioned parameters, the scour characteristic lengthφcan be written as

using the Pi-theorem, it can be further reduced to


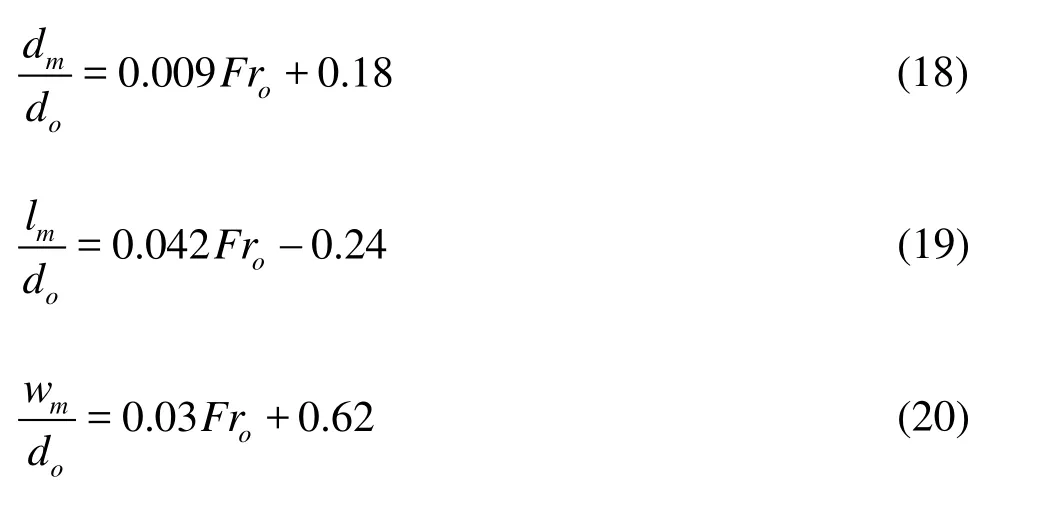
Variations of the various non-dimensional maximum length scales of the scour hole are shown in Fig.8, wherein the corresponding scour depth dm/do, the axial scour lengthlm/do, and the scour half-width wm/doare plotted against the densimetric Froude numberFro. A comparison of these computational results with the experimental data shows good agreement, indicating that the three characteristic lengths vary linearly with the densimetric Froude number load Fro. A linear fit to the data yields
indicating that the densimetric Froude number Frois the dominant factor characterizing the scour hole dynamics.
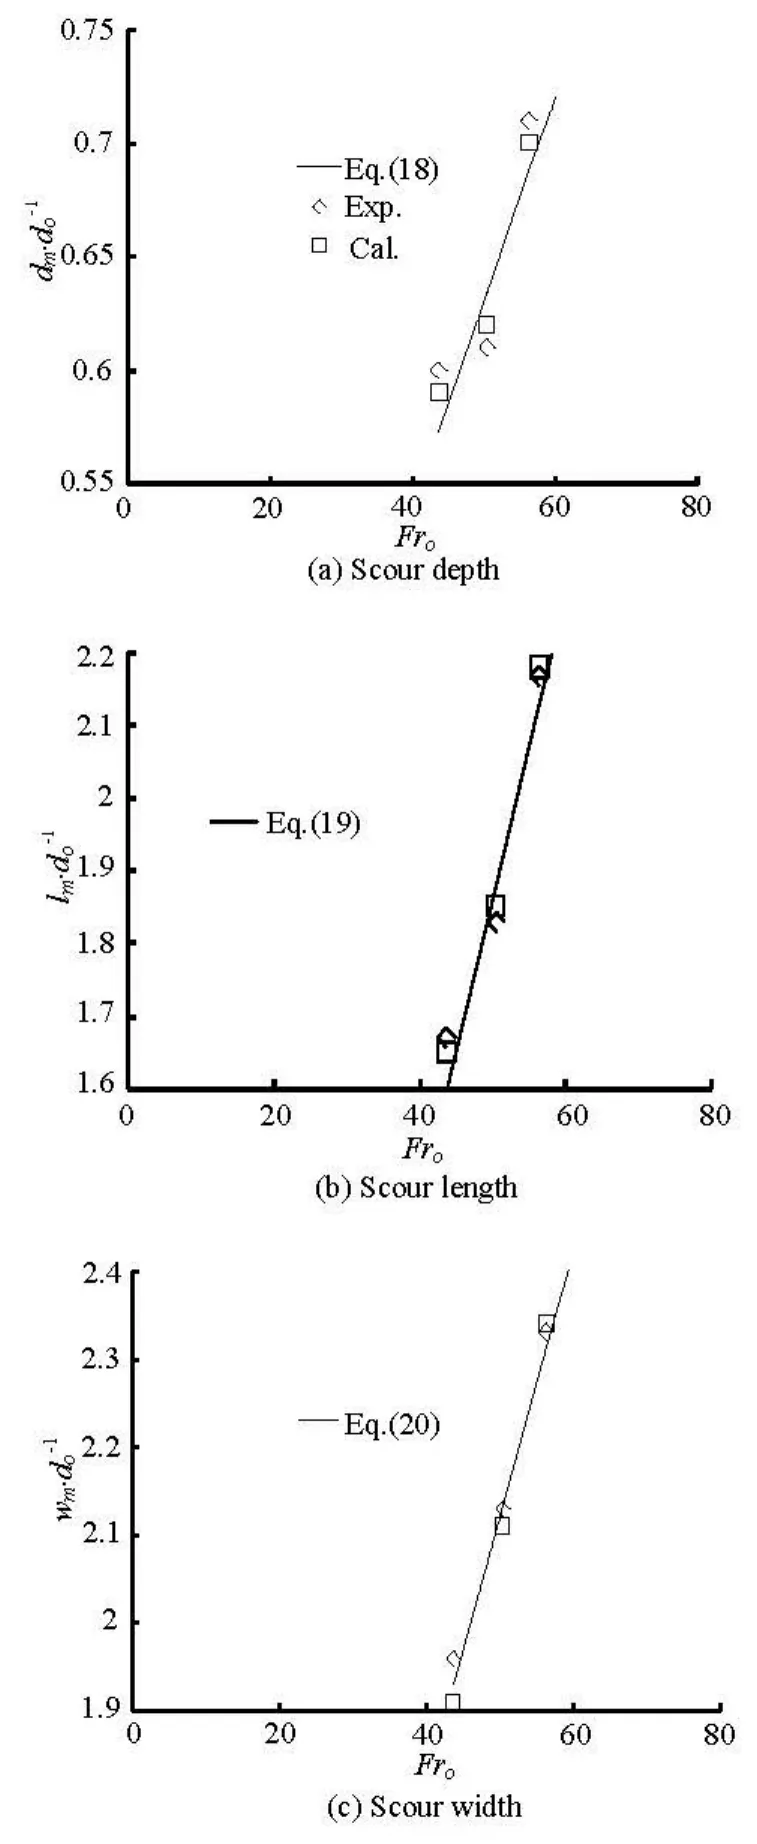
Fig.8 Variation of non-dimensional maximal length scales of a scour hole
3.3 Analysis of flow field

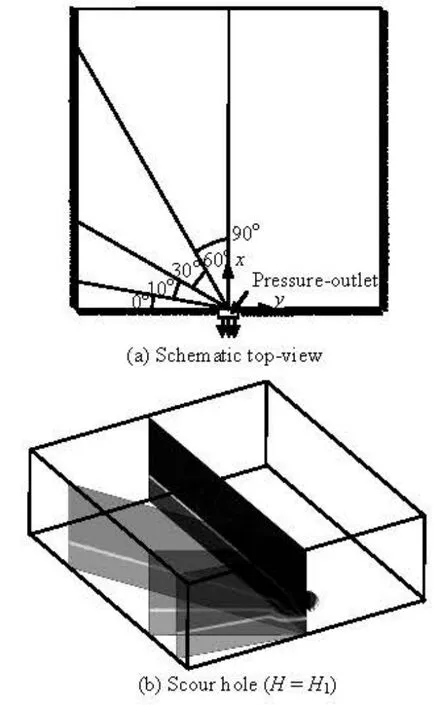
Fig.9 Location of the various azimuthal sections
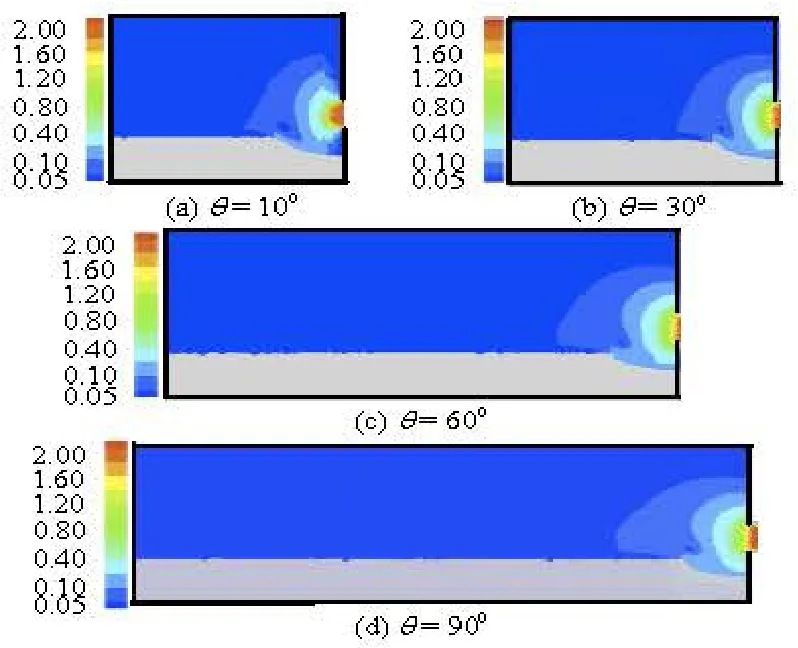
Fig.10 Velocity contour maps of water (H=H1,Fro=43.7)
The velocity contour maps and the velocity field of the water at various azimuthal sections above the water-sediment interface in the equilibrium state for the headH1are shown in Figs.10 and 11. In the azimuthal sections of Fig.10, the water velocities away from the orifice are small and uniformly distributed, those near the orifice increase rapidly and converge on the orifice, yielding a distribution of the water velocity confined to a sink-like area. Near the orifice, the mutual impact of the flows from the azimuthal sections and the resistances of the wall and the sand produce a vortex in the scour hole (Fig.11), which causes particles to be suspended in the water to be carried away with the flow of the water. The extent of the scour hole gradually increases until the scouring and the particle deposition reach an equilibrium. From Figs.10(a)-10(d), the area bounded by the velocity contour 0.05 m/s at azimuthal sections is shown to increase with the azimuthal angleθ , due to the impacting of the water flow against the wall on which the orifice is located. If the azimuthal angle θis small (Fig.11(a)), the vortex in the scour hole is relatively small and weak, in contrast, at larger angles, the vortex in the scour hole is relatively larger and stro-nger (Fig.11(b)-11(d)).
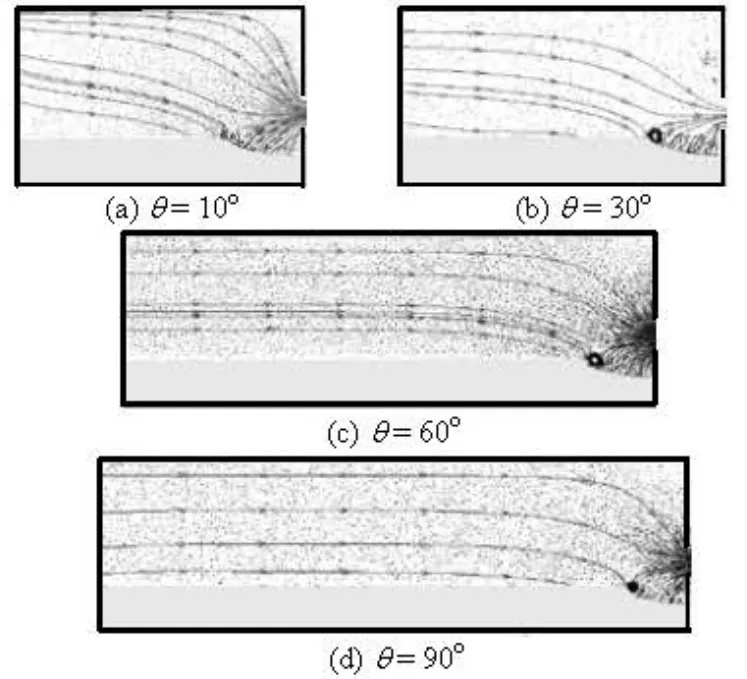
Fig.11 Velocity field of water (H=H1,Fro=43.7)
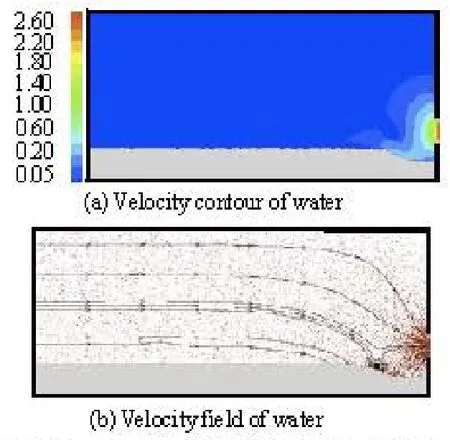
Fig.12 Velocity contour and field of water (H=H3,Fro= 56.4)
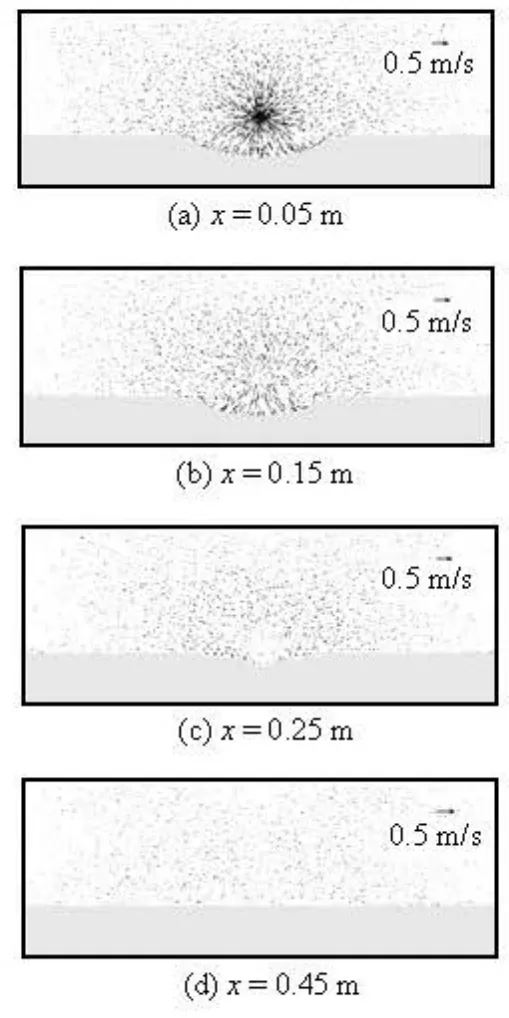
Fig.13 Velocity vectors projected onto the y- z plane
Figure 12 shows the velocity contour and the velocity field of the water withinothe area bounded by the azimuthal section of θ=90 and the water-sediment interface in the equilibrium for high headH= H3. As can be seen, the velocity distribution under a low head H1in Fig.10(d) is similar to that under a high headH3in Fig.12(a), but the area bounded by the velocity contour 0.05 m/s under the high head H3is smaller than that under the low head H1. The vortex present atH3is larger and stronger than that at H1(Fig.11(d), Fig.12(b)), which explains why the scour hole for H3is larger than that for H1.
These 3-D flow features are further evidenced by the velocity field at y-zcross-sections (Fig.13) for four different cross-sections (x=0.05 m, 0.15 m, 0.25 m, 0.45 m). These cross-sections are located in different flow regions. As shown in Figs.13(a), 13(b), the traverse velocities are large and the secondary flows are complicated near the orifice. However, as illustrated in Figs.13(c), 13(d), the traverse velocities are small and no obvious secondary flow can be observed for cross-sections away from the orifice.
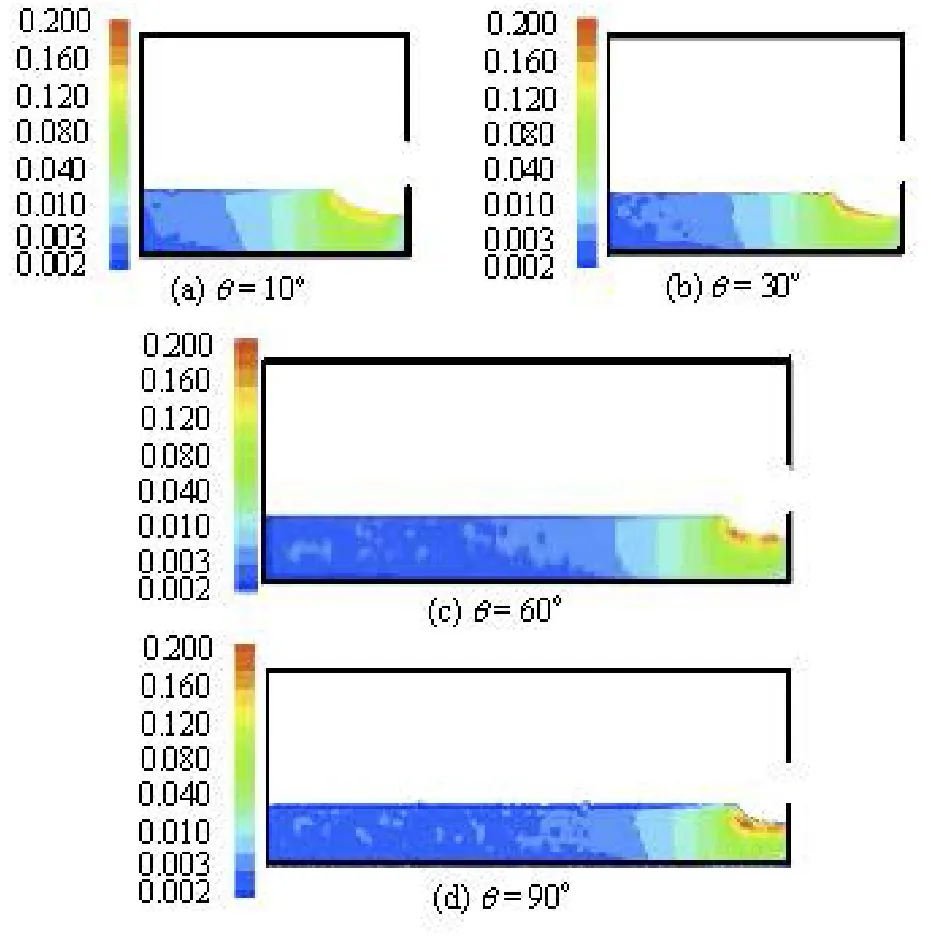
Fig.14 Velocity contours for sand (H=H1,Fro=43.7)
3.4 Analysis of sediment movement
The area immediately below the water-sediment interface is composed of the sand and the pore water. The latter is defined as the water in the spaces between sediment particles. However, the sand located at the interface is driven by both the flowing water and the pore water. Here, the forces associated with the flowing water and the pore water are referred to as the driving force of the water to simplify the statements in the following discussions. The movement of thesand is determined by the driving force, the gravity, and the frictional force.
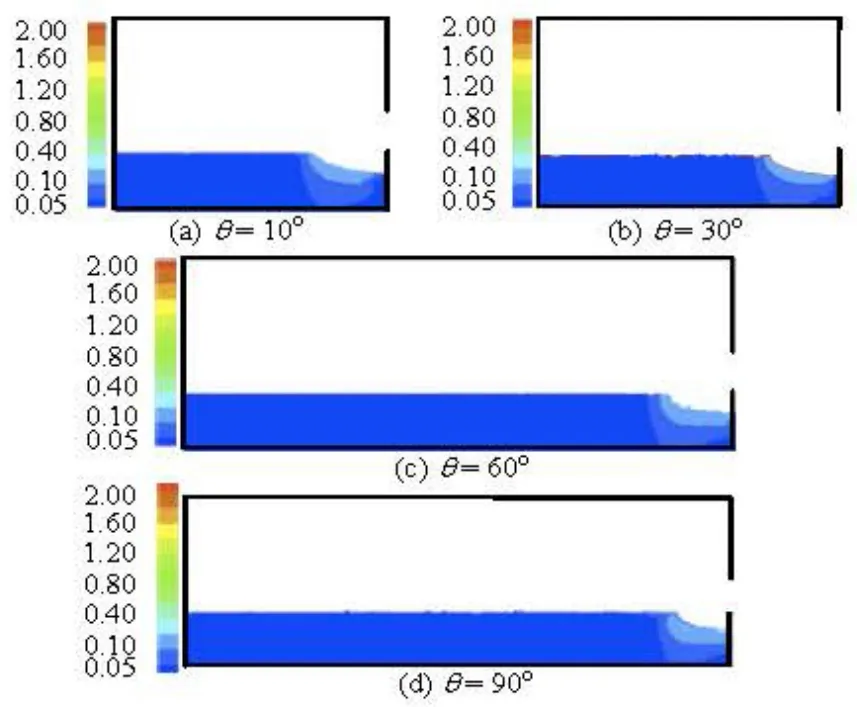
Fig.15 Velocity contours for pore water (H=H1,Fro= 43.7)
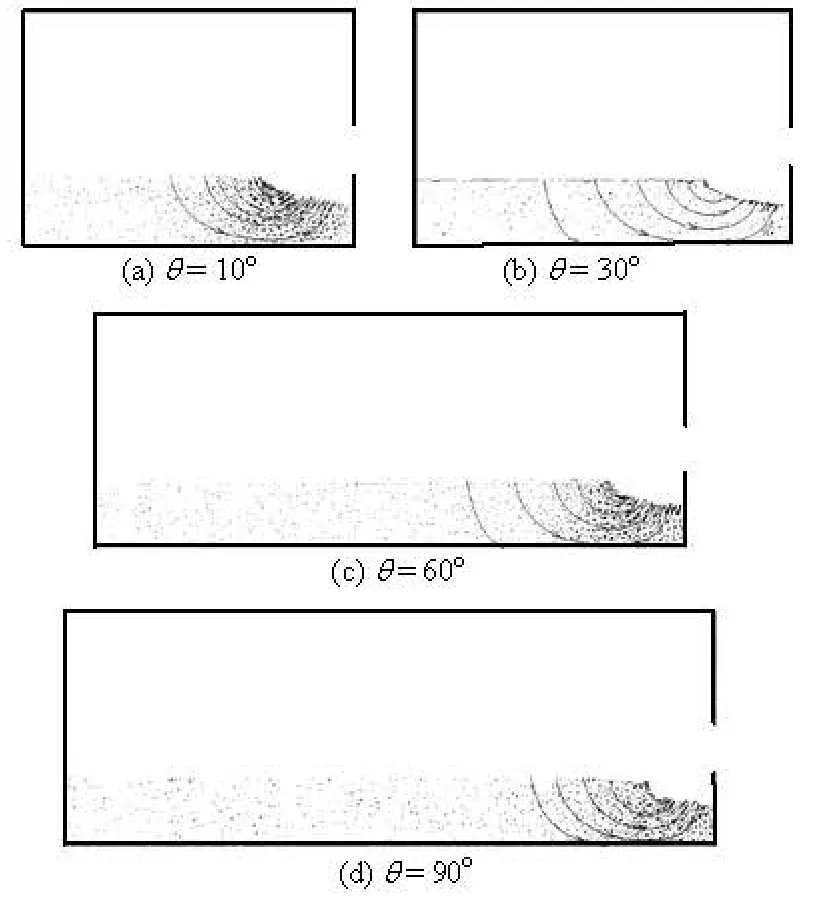
Fig.16 Velocity fields for sand (H=H1,Fro=43.7)
The velocity contour and the velocity field of the sand and the pore water at azimuthal sections with head H=H1are shown in Figs.14-17. From Figs.14 and 15, the velocity of the pore water is larger than the velocity of the sand, although both velocities have similar flow trends, both velocities are slow and uniform far away from the scour hole and they reach the maximum values near the scour hole. The pore water comprises the natural water within the sand layer and the exchanging water from the reservoir, the latter penetrates into the sand layer and moves along an approximately circular arc (Fig.17). As seen in Fig.16, if the driving force and the frictional force are not sufficient to balance the gravitational force on the sand, the sand is forced to move with the pore water in which the exchanging water is the main contributor. The sand moves in the same direction as the pore water along the azimuthal sections (Fig.14(a)-14(d)), the velocities of the sand and the pore water at the azimuthal section of θ=90oare slightly larger than those at other azimuthal sections.
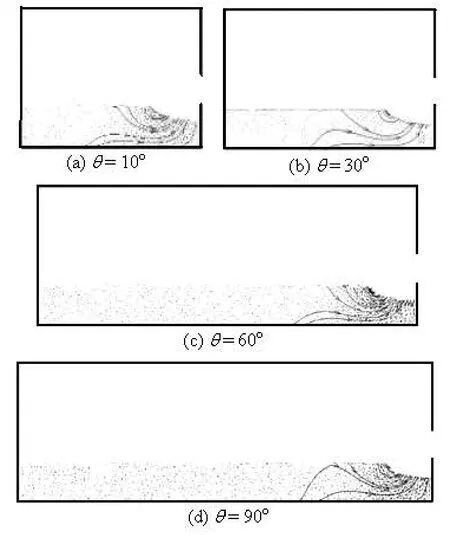
Fig.17 Velocity fields for pore water (H=H1,Fro=43.7)
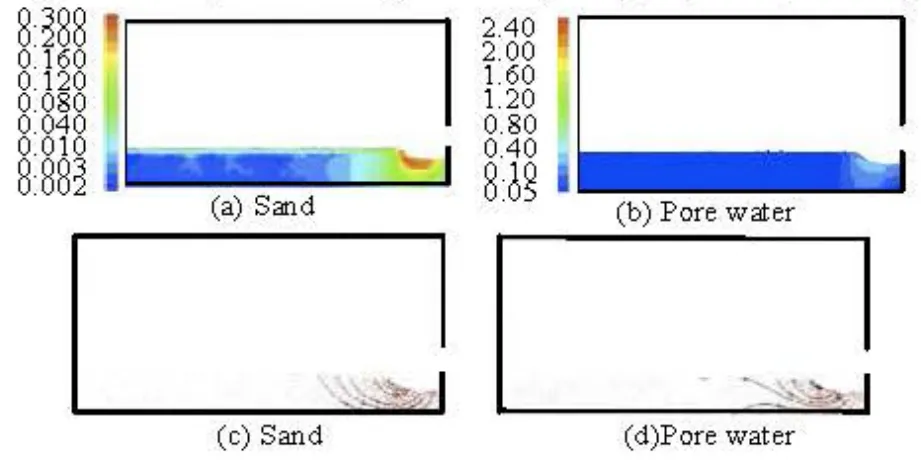
Fig.18 Velocity contours (θ=90o,H=H3,Fro=56.4)
Similar to the case of H=H1, the velocity contour and the velocity field of the sand anod the pore water at the azimuthal section ofθ=90 for head H=H3are shown in Fig.18. From Figs.14(d), 15(d), 16(d), 17(d), and 18(a)-18(d), for different headsH , the sand moves in the same direction as the pore water and the velocity of the sand is slightly smaller than the pore water velocity, which reaches the maximum at the bottom of the scour hole. The velocities of the sand and the pore water at a high head are slightly larger than the velocities of the sand and the pore water at a low head.
4. Conclusions
(1) An Eulerian two-phase model, in which the sand and the water are treated as interpenetrating continua, and with considerations of both the flow-particle and particle-particle interactions, is used to simulate the scouring, the computational results agree well with the experimental results.
(2) The variations in the non-dimensional centerline scour depth Dcand the non-dimensional halfscour width Wrcan be described by Eqs.(12) and (13), respectively, and if X≤0.1,Dckeeps almost unchanged(Dc=-1), the non-dimensional transverse scour profiles are similar, for which the mean trend can be expressed by Eq.(14).
(3) Using the Pi-theorem, the densimetric Froude number Frois shown to be the main parameter characterizing the scour hole dynamics; the non-dimensional maximum length scalars associated with the scour depthdm/do, the axial scour length lm/do, and the scour half-widthwm/doare linear with Fro.
(4) The fully 3-D flow pattern within the scouring funnel in front of a submerged circular orifice is successfully simulated. Near the orifice, the velocity distribution of the water sees a converged trend to the sink, moreover, the mutual impact of the flows at azimuthal sections, as well as the resistances of the wall and the sand, produce a vortex in the scour hole that makes the sand particles to be suspended in the water and to be carried away by the flowing water.
(5) The movement of the sand is controlled by the driving force of the water, the gravity, and the frictional force. When these forces are not in equilibrium, the sand is forced to move with the pore water formed mainly from the exchanging water, the sand moves in the same direction as the pore water along the azimuthal sections with the velocity of the sand being slightly smaller than the pore water velocity, which reaches the maximum at the bottom of the scour hole.
[1] GUO Zhi-xue, LIU Xing-nian and CAO Shu-you. Experimental study on reservoir scour funnel of Baoshi Water Power Station[J]. Journal of Sichuan University (Engineering Science Edition), 2004, 36(5): 1-5(in Chinese).
[2] BRYANT D. B., KHAN A. A. and NADIM N. M. Flow field upstream of an orifice[J]. Journal of Hydraulic Engineering, ASCE, 2008, 134(1): 98-104.
[3] SHAMMAA Y., ZHU D. Z. and RAJARATNAM N. Flow upstream of orifices and sluice gates[J]. Journal of Hydraulic Engineering, ASCE, 2005, 131(2): 127- 133.
[4] WANG Guang-yue. The character of the scour funnel in front of the dam[J]. Journal of Shandong University of Technology, 1996, 26(2): 131-134(in Chinese).
[5] LAI Jihn-Sung, SHEN Hsieh-Wen. Flushing sediment through reservoirs[J]. Journal of Hydraulic Research, 1996, 34(2): 237-255.
[6] SHEN Hsieh-Wen. Flushing sediment through reservoirs[J]. Journal of Hydraulic Research, 1999, 37(6): 743-757.
[7] CAO Zhi-xian. Turbulent bursting-based sediment entrainment function[J]. Journal of Hydraulic Enginee- ring, ASCE, 1997, 123(3): 233-236.
[8] HUAI Wen-xin, WANG Zeng-wu and QIAN Zhongdong et al. Numerical simulation of sandy bed erosion by 2D vertical jet[J]. Science China Technological Sciences, 2011, 54(12): 3265-3274.
[9] LU Qi-ling, ZHENg Bang-min and ZHAO Ming-deng et al. Three-dimensional numerical simulation on the scouring funnel in front of the sand-flash channel for Reservoir[J]. Journal of Hydrodynamics, Ser. A, 2007, 22(2): 254-259(in Chinese).
[10] FENG Xiao-xiang, ZHANG Xiao-feng and LI Jian-bing et al. Research on three dimensions mathematical model for scouring funnel shape in front of dam[J]. Journal of Hydrodynamics, Ser. A, 2008, 23(1): 15-23(in Chinese).
[11] HU H., WANG K.-H. Modeling flows and sediment concentrations in a sloping channel with a submerged outlet using a hybrid finite-analytic approach[J]. Com- puters and Fluids, 2011, 44(1): 9-22.
[12] ENWALD H., PEIRANO E. and ALMSTEDT A.-E. Eulerian two-phase flow theory applied to fluidization[J]. International Journal of Multiphase Flow, 1996, 22(Suppl.): 21-66.
[13] WANKER R., GOEKLER G. and KNOBLAUCH H. Numerical modeling of sedimentation utilizing a Euler/ Euler approach[C]. First International Conference on Computational Methods in Multiphase Flow. Orlando, Florida, USA, 2001, 327-336.
[14] HUAI W., XUE W. and QIAN Z. Numerical simulation of sediment-laden jets in static uniform environment using Eulerian model[J]. Engineering Applications of Computational Fluid Mechanics, 2012, 4(4): 504-513.
[15] POWELL D. N., KHAN A. A. Scour upstream of a circular orifice under constant head[J]. Journal of Hydraulic Research, 2012, 50(1): 28-34.
[16] RAJARATNAM N., BERRY B. Erosion by circular turbulent wall jets[J]. Journal of Hydraulic Research, 1977, 15(3): 277-289.
10.1016/S1001-6058(11)60386-8
* Project supported by the the National Natural Science Foundation of China (Grant No. 11172218), the Fundamental Research Funds for the Central Universities (Grant No. 2012206020209).
Biography: XUE Wan-yun (1986- ), Male, Ph. D. Candidate
HUAI Wen-xin, E-mail: wxhuai@whu.edu.cn
- 水动力学研究与进展 B辑的其它文章
- Experimental hydrodynamic study of the Qiantang River tidal bore*
- Evaluation of suspended load transport rate using transport formulas and artificial neural network models (Case study: Chelchay Catchment)*
- Simulation of water entry of an elastic wedge using the FDS scheme and HCIB method*
- Application of signal processing techniques to the detection of tip vortex cavitation noise in marine propeller*
- Analysis and numerical study of a hybrid BGM-3DVAR data assimilation scheme using satellite radiance data for heavy rain forecasts*
- The characteristics of secondary flows in compound channels with vegetated floodplains*

