China Is Winning the New Global Industrial Contest
By JOHN ROSS

THE international financial crisis brought about a radical change in the structure of international industrial competition. That China is winning the new industrial race is the only conclusion that can be drawn from the pattern of industrial expansion and contraction in the major industrial centers over the five years since the beginning of the 2008 international financial crisis.
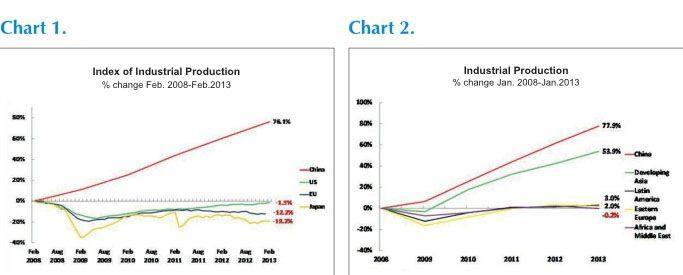
Chinas position among industrial centers isnt inherently obvious from a glance at yearly data. To fully gauge changes in the industrial competition landscape, its best to look longerterm. Below, the first chart shows changes in industrial output over the most recent five-year period in the worlds four major industrial centers – China, the U.S., the European Union (EU) and Japan. The pattern is clear and striking.
U.S. industrial production based on the latest data (February 2013) remained 1.3 percent below the level five years previously. Production has been stagnant if the five-year period is taken as a whole.
Industrial output in the EU remains at 12.2 percent, significantly below the level five years ago. EU industrial production has fallen since February 2011.
Japans industrial production remains at 19.2 percent, substantially below the level in 2008. Production has fallen consistently since February 2011. (See Chart 1)
Chinas industrial output is 76.1 percent above the level five years previously.
Chinas industrial production increased by over three quarters during a period when the U.S. industrial production stagnated and the EU and Japanese industrial production figures declined significantly. Industrial production is a competitive struggle; China has well and truly thrown down the gauntlet in recent times.
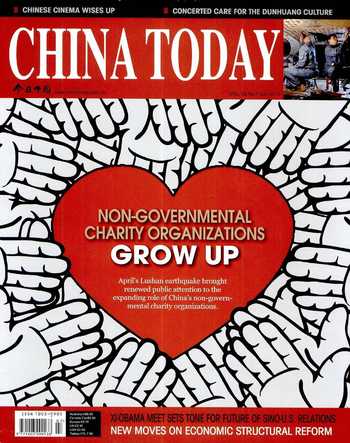
Following on with the comparison to examine other developing economies, the chart looks slightly different. No individual industrial center matches the four major global ones. Its more useful to consider aggregated data from regions, rather than from countries, for the sake of analysis.
As statistics for all developing economies are not available for February 2013, the period January 2008 to January 2013 is considered. Data for China is also shown. As no separate China data was published for January due to the Spring Festival holiday, Chinas January data is taken as the mid-point between December and the combined January-February statistics.
Again the pattern is clear over the five-year period.
Chinas industrial production grew by 77.9 percent.
Total developing Asian industrial production expanded by 53.9 percent – China accounting for the largest part of this.
Latin American industrial production increased by 3.0 percent.
Eastern Europe and the former USSRs industrial production increased by 2.0 percent.
Industrial output in Africa and the Middle East fell by 0.2 percent. (See Chart 2)
China comes out on top in both charts – the country bested both its developed country and developing economy rivals in the industrial production competition.
Five years ago, China was already one of the worlds main industrial centers. A 75-percent rise in production since then represents a major shift in the balance of world industrial production in Chinas favor.
What conclusions follow from these developments?
First, the claims made by some Chinese com- mentators that U.S. industry is undergoing a great revival and that China is lagging behind are nonsense. Not only has Chinas industrial growth far outperformed that of the U.S., but U.S. industrial production has yet to even recover to pre-financial crisis levels. Commentators justify their claims by citing individual examples, such as Apples manufacturing a few more of its devices in the U.S. Such examples are misleading; anecdotes are not overall statistical trends.
Second, these differences in development have long-term consequences beyond industrial production. Productivity improvements in the industrial sector turbocharge productivity in non-industrial sectors – a kind of productivity multiplier effect. Chinas success in industrial competition raises its overall rate of productivity growth relative to less successful competitors.
These factual trends do not mean China will not face major future challenges in the industrial sector. The country has already successfully shifted the center of gravity of its industrial production from low technology (textiles, toys, etc.) to medium technology (construction equipment, smartphones, personal computers and ships, etc.) products. But Chinas transition to very high technology industrial production still lies ahead. “Very high tech” is generally produced for non-market sectors, with examples being military hardware and rocketry.
That Chinas industrial base is currently geared toward medium and not high-tech production is nothing to worry about.
Chinas current GDP per capita roughly equates to Japans in 1966, or South Koreas in 1988. At those times Japan and South Korea had made the transition from agricultural and low value-added industrial economies to success in medium technology sectors – shipbuilding, steel, etc. Today China dominates the same industries on a global scale. For Japan in the 60s and South Korea in the late 80s, the transition to strength in high technology product innovation – think Walkmans, mobile phones and high-end televisions – lay 10-15 years away.
As Lin Yifu (Justin Yifu Lin), former chief economist and senior vice president of the World Bank, rightly stresses, it is impossible for an economy to develop market sectors greatly out of line with its overall level of development. The full transition of Chinas industry to strength in high technology production lies a decade away. The key fact at present is shown in the tables above: comparisons of major industrial centers and regions show that China has gained a leg up on the competition since the global financial crisis.

