Superplasticity of fine-grained Mg-10Li alloy prepared by severe plastic deformation and understanding its deformation mechanisms
H.T.Jeong,S.W.Lee,W.J.Kim
Department of Materials Science and Engineering, Hongik University, Mapo-gu, Sangsu-dong 72-1, Seoul 121-791, Republic of Korea
Abstract The superplastic behavior and associated deformation mechanisms of a fine-grained Mg-10.1 Li-0.8Al-0.6Zn alloy (LAZ1011) with a grain size of 3.2 μm,primarily composed of the BCC β phase and a small amount of the HCP α phase,were examined in a temperature range of 473 K to 623 K.The microstructural refinement of this alloy was achieved by employing high-ratio differential speed rolling.The best superplasticity was achieved at 523 K and at strain rates of 10-4 -5×10⁻⁴ s-1,where tensile elongations of 550–600%were obtained.During the heating and holding stage of the tensile samples prior to tensile loading,a significant increase in grain size was observed at temperatures above 573 K.Therefore,it was important to consider this effect when analyzing and understanding the superplastic deformation behavior and mechanisms.In the investigated strain rate range,the superplastic flow at low strain rates was governed by lattice diffusion-controlled grain boundary sliding,while at high strain rates,lattice diffusion-controlled dislocation climb creep was the rate-controlling deformation mechanism.It was concluded that solute drag creep is unlikely to occur.During the late stages of deformation at 523 K,it was observed that grain boundary sliding led to the agglomeration of the α phase,resulting in significant strain hardening.Deformation mechanism maps were constructed for β-Mg-Li alloys in the form of 2D and 3D formats as a function of strain rate,stress,temperature,and grain size,using the constitutive equations for various deformation mechanisms derived based on the data of the current tests.
Keywords: Magnesium-lithium alloy;Superplasticity;Severe plastic deformation;Grain size;Grain growth.
1.Introduction
Mg-Li alloys have gained considerable attention across various industries due to their extraordinary properties including high stiffness-to-weight ratio,low density,excellent formability,and biodegradability [1,2].These characteristics make them highly desirable for applications in the aerospace and medical sectors [1,2].One advantage of incorporating Li into Mg is the transformation of the hexagonal-close-packed(HCP)structure of pure Mg into a body-centered cubic(BCC)structure.According to the Mg-Li phase diagram[3],if the Li content exceeds 10.3 wt.%,the alloy has theβ-phase,which represents a solid solution of Mg in Li with a BCC structure.If the Li concentration ranges between 5.7 and 10.3 wt.%,the alloy has a duplex structure consisting of bothα-phase andβ-phase.As theβphase has a greater number of available slip planes compared to theαphase,theβphase exhibits higher ductility and formability than theαphase at room temperature [4].Conventional Mg-Li alloys often include a third element to enhance the machining characteristics,strength,corrosion resistance,and thermal stability of Mg-Li alloys[1,2,5,6].Zinc (Zn) and aluminum (Al) are often added to Mg-Li alloys to improve the strength and corrosion resistance of Mg-Li alloys [5,6].
Table 1 provides a list of Mg-Li alloys that have been investigated for the superplastic behavior of the Mg-Li alloys containing 7.83 to 10.7 wt.%.of Li [7–33].Superplastic behavior of the Mg-Li alloys has been observed in the temperature range of 298 to 673 K,and the strain rate range of 1×10⁻⁵to 9×10⁻¹s-1.Most extensive research has been conducted on Mg-Li alloys with a Li concentration of ∼8%.At an 8 wt.% Li concentration,the alloy comprises a roughly equal distribution of 50%α-phase and 50%β-phase [3].This duplex structure is advantageous in effectively refining grains during thermomechanical working and preventing rapid grain growth during sample heating and superplastic deformation.Researchers have used various conventional methods,such as rolling [7,24],extrusion[12,16,18],extrusion+rolling [13,14],as well as advanced techniques including severe plastic deformation(SPD)such as equal channel pressing (ECAP) [8,11,17,19,22,25,28,29,32],high pressure torsion (HPT) [9,10,30],friction stirring process (FSP) [15,21,26],high-ratio differential speed rolling(HRDSR) [23]and multidirectional forging (MDF) [27,33],to refine the microstructure of Mg-Li alloys.HPT,FSP,and HRDSR techniques resulted in ultrafine grain sizes of ∼1 μm,whereas the conventional methods yielded grain sizes less than 10 μm.

Table 1 A list of Mg-Li alloys that have been investigated for the superplastic behavior of the Mg-Li alloys containing 8 to 10.7 wt.%.of lithium.The meaning of the abbreviation is as follows: ECAP is for equal channel angular pressing,HPT is for high-pressure torsion,FSP is for friction stir processing,RDECAP is for rotary die equal channel angular pressing,HRDSR is for high-ratio speed differential rolling,MDF is for multi-directional forging,and εf,max is for maximum elongation to failure.N/A means not applicable in reference paper.
While the deformation mechanisms responsible for the superplastic flow of Mg-Li alloys withβas a major constituent phase have been studied by many investigators,there is still a lack of understanding regarding which specific deformation mechanisms operate under different grain sizes,temperatures,strain rates,and stress conditions.Grain coarsening easily occurs inβ-Mg-Li alloys.For example,Metenier et al.[20]demonstrated that the initial grain size of 5.9 μm increased to 14.2 μm in Mg-9Li alloy during prestraining at 523 K.Hence,caution should be exercised when studying the effect of grain size on the superplatic deformation behavior of Mg-Li alloys.In this study,we examined the superplastic behavior of a fine-grained Mg-10.1 Li alloy prepared by using high-ratio differential speed rolling (HRDSR [23,34-36]).By analyzing the deformation behavior of the alloy at various temperatures and strain rates,and examining the microstructural changes during the sample heating and tensile deformation,we could identify the rate-controlling deformation mechanisms under different conditions.Additionally,by utilizing the analyzed strain rate-stress relations,which could be expressed as functions of temperature and grain size,we created 2D and 3D deformation mechanism maps forβ-Mg-Li alloys.These maps delineate the domains where a specific deformation mechanism governs plastic flow over the others.
2.Experimental procedure
The Mg-Li-Al-Zn alloy was supplied in the form of sheets with a thickness of 2 mm (AmLi Materials Technology Co.,LTD.,Taiwan).The chemical composition of the alloy,determined using inductively coupled plasma atomic emission spectroscopy (ICP-AES),reveals that it is an Mg-10.12Li-0.81Al-0.62Zn (by wt.%) alloy (LAZ1011).Prior to rolling,the sheet underwent a solid solution heat treatment by being heat treated at 623 K for 2 h and then subjected to water quenching.The sheet was rolled by HRDSR to the final thickness of 0.55 mm (i.e.total reduction of 86%) by eight passes at room temperature.The speed ratio between the upper and the lower rolls was set at 2.Rolling was conducted in air under non-lubricated conditions.HRDSR is a rolling-based severe plastic deformation technique,where a large shear strain is imposed during asymmetric rolling with high roll-speed ratios between the upper and lower rolls (≥2) [34].It has been demonstrated that this technique is highly effective in grain refinement in many metals [34–36].
Plate-type dog-bone specimens were prepared using electric discharge machining,with dimensions of 5 mm gauge length and 2 mm gauge width.The gauge of the tensile specimens were oriented with the tension direction parallel to the rolling direction.The tensile specimens were subjected to tensile testing (RB301 UNITECH-T,R&B) at various temperatures ranging from 473 to 623 K,with initial strain rates of 10-4–10-2s-1.Two types of tensile tests were conducted.The first type of the test was the elongation-to-failure test,where the tensile samples were elongated until fracture occurred.The second type of test was the strain rate changes(SRC) test,in which the strain rate was continuously varied through jump of cross-head speed during tensile testing at a given temperature.During the SRC testing,the strain rate was varied from 1.67×10⁻⁴to 10-1s-1,and this sequence of strain-rate changes was repeated.A prestrain of∼0.15 was applied at 1×10⁻³s-1before the SRC test at each temperature to stabilize the microstructure.An amount of plastic strain of ∼0.05 was imposed between the strain rates after prestraining.Up to the second SRC cycle,the accumulated strain reached ∼0.9.The purpose of the SRC test was to identify the specific deformation mechanisms by investigating the effect of strain rate on flow stress at a given temperature.
The microstructures and phase compositions of the samples were examined by optical microscopy (OM,BX61M,Olympus),scanning electron microscopy (SEM,SU5000,Hitachi) with energy dispersive X-ray spectroscopy (EDS,Octane Elect EDS Super),and electron backscattered diffraction(EBSD,Velocity Super)methods.Specimens for OM and SEM were first ground using silicon carbide paper and then polished by a 3 μm diamond suspension.Finer polishing was carried out using a 50 nm colloidal silica.The polished specimens were etched for 1–5 s by the chemical etchant prepared by mixing 5 g picric acid,10 ml acetic acid,and 95 ml ethyl alcohol.The EBSD samples were prepared by mechanical grinding,followed by polishing steps using a 1 μm diamond suspension,a 50 nm colloidal silica,and an oxide polishing suspension (OPS) in sequence.EBSD maps were acquired with a step size of 0.5 μm.All EBSD data,including the size and area fraction of theαphase,the fraction of highangle grain boundaries,and the average grain size of theβphase,were analyzed using TSL OIM software (version 7.0).
The constituent phases in the LAZ1011 alloy were identified using X-ray diffraction (XRD,SmartLab,Rigaku) analysis.The XRD analysis was performed using Cu Kαradiation with a scan rate of 0.24 degrees per minute.To determine the melting temperature of the alloy,a differential scanning calorimeter (STA449 F3,NETZSCH) was used.The scanning rate was 10 K/min and the scanning temperature range was between 301 and 973 K.
3.Results
3.1. Microstructures before tensile deformation
Fig.1(a) and (b) show the optical micrograph and the X-ray diffraction (XRD) curve for the heat-treated (holding at 623 K for 2 h and then subjected to water quenching)LAZ1011 sample prior to HRDSR,respectively.Both figures provide evidence that theβphase is the dominant constituent in the alloy,whereas theαphase is present as a minor phase.The grain size of theβphase is measured to be 196 μm.Theα-Mg phase is found either along the grain boundaries ofβ-phase grains or in the form of a needle-like structure within theβphase grains.Theαphase has a higher content of Al and a lower content of Zn compared to theβphase,which is consistent with the findings reported by other researchers [37].Beside theα-Mg phase,there were small particles enriched in Al,which are undetectable by XRD due to their limited quantities,are likely to be Mg17Al12,Mg3Al1,or Mg1Li2Al1,according to the findings from other researchers’studies on Mg-Li-Al-Zn alloys [38–40].The DSC analysis result indicates that the incipient melting temperature (Tm) of the current alloy is 842 K (Fig.1(c)).
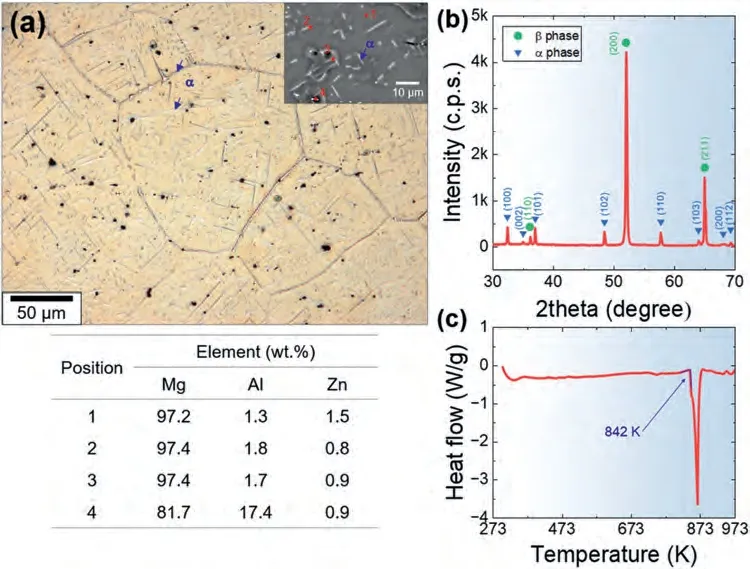
Fig.1.(a) The optical micrograph and (b) the X-ray diffraction (XRD) curve for the heat-treated (at 623 K for 2 h) LAZ1010 sample prior to rolling.The inset in (a) shows the SEM micrograph of the sample prior to rolling.The results of the EDS analysis at the selected locations are presented in the table.Note that as lithium (Li) has an extremely small atomic mass,its presence is difficult to detect using EDS.(c) The DSC curve for the sample prior to rolling,showing that its incipient melting temperature is 842 K.
Fig.2(a)-(c) show the optical photograph,SEM micrograph,and EBSD inverse pole figure(IPF)and grain boundary(GB) maps of the as-HRDSR processed microstructure.Grain refinement occurred uniformly along the thickness direction due to the occurrence of large shear straining during HRDSR[34],resulting in a highly refined,band-like microstructure oriented in the rolling direction.The measured grain size by EBSD is 3.2 μm,and the fraction of high-angle-grain boundaries (HAGBs) is 42.1%,indicating that the HRDSR process was effective in refining the grain size.The coexistence of a high fraction of HAGBs with a high fraction of low-angle grain boundaries is a characteristic feature of continuous dynamic recrystallization (CDRX),which involves the progressive rotation of subgrains with straining [41].Studies have reported that in some metals with high stacking fault energies,the formation of new grains with HAGBs has been observed during severe plastic deformation at room temperature via CDRX mechanism.The inset in (a) reveals that,during rolling,theαphase was elongated and aligned in the direction of rolling.

Fig.2.(a) The optical micrograph,(b) the inverse pole figure (IPF) and (c) grain boundary (GB) maps of the as-HRDSR processed microstructure of the LAZ1011 alloy.In the GB maps,low-angle grain boundaries (2–5°) are in blue,intermediate-angle grain boundaries (5–15°) are in yellow,and high-angle grain boundaries (≥15°) are in red.The inset in (a) shows a SEM micrograph of the as-HRDSRed sample.
Fig.3(a)-(e) show the optical photographs of the microstructures of the rolled samples after annealing at various temperatures ranging from 423 K to 623 K for 1 h and subsequent water quenching.The aim of this study is to examine the thermal stability of the SPD-processed microstructure of the LAZ1011 alloy.After annealing at 423 K,there is minimal difference observed in the microstructure.Upon annealing at 473 K,bands comprised of coarsened grains are formed in the fine-grained matrix.As the temperature increases further to 523 K,both the area fraction of corase-grained bands and the grain size within them increase.Once the annealing temperature increases above 573 K,the whole microstructure underwent significant coarsening.The fraction ofαphase approaches nearly zero,after annealing at 623 K.This observation agrees with the Mg-Li phase diagram[3],which indicates that the fraction of theαphase disappears above ∼733 K for a Li concentration of 10.1 wt.%.
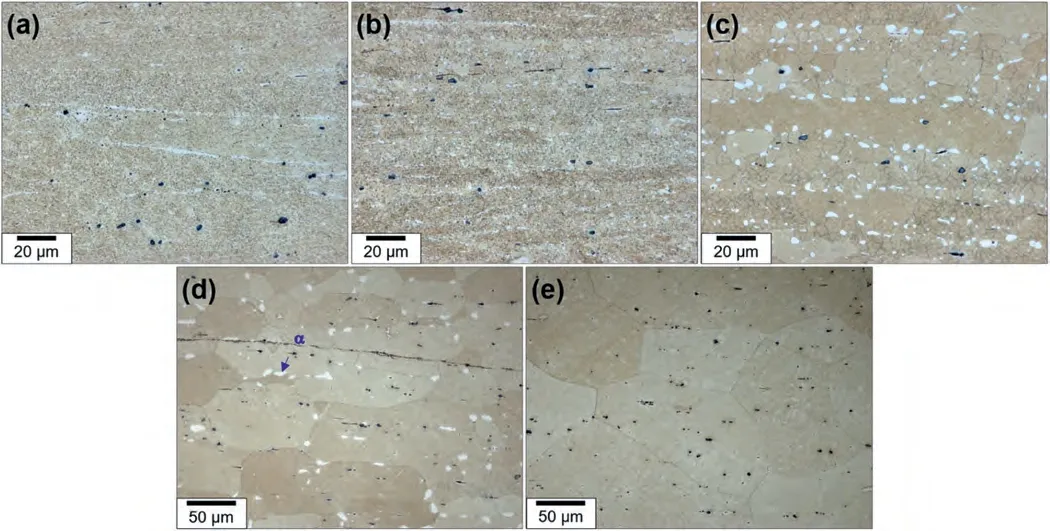
Fig.3.The optical photographs showing the microstructures of the rolled samples after annealing at (a) 423 K,(b) 473 K,(c) 523 K,(d) 573 K and (e) 623 K for 1 h and subsequent water quenching.
Since the microstructure of the alloy is sensitive to annealing temperature (as shown in Fig.3),the grain sizes of the samples just before tensile loading may differ significantly from the initial microstructure,depending on the testing temperature.To determine the grain size just before the application of tensile loading at a given testing temperature,a sample was taken out of the furnace chamber attached to the tensile testing equipment after a 20-min heating and holding period,which is the typical time period required for a tensile sample to reach the target temperature and equilibrate starting from room temperature,and then quickly quenched in water.Fig.4(a)-(d) show the IPF maps and GB maps for the microstructures of the HRDSR-processed samples after the sample heating and holding for 20 min at different testing temperatures.The grain sizes and fractions of HAGBs,as well as the sizes and fractions of theαphase in the samples,are presented in Fig.5(a) and (b),respectively,determined based on the analysis of the EBSD data.After annealing at 473 K,the grain size increased to 8.3 μm,but the fraction of HAGBs stayed similar at 46%.After annealing at 523 K,a bimodal grain size distribution developed.The average grain size increased to 9.14 μm,and the fraction of HAGBs increased to 83.3%.At higher temperatures of 573 K and 623 K,significant grain growth occurred,resulting in the grain sizes of 32 μm and 82 μm,respectively.The phase fraction of theαphase exhibits a decreasing trend as the testing temperature increases.As the fraction of theαphase,which can play a role in inhibiting coarsening of theβphase,decreases,the growth ofβphase grains is expected to accelerate.
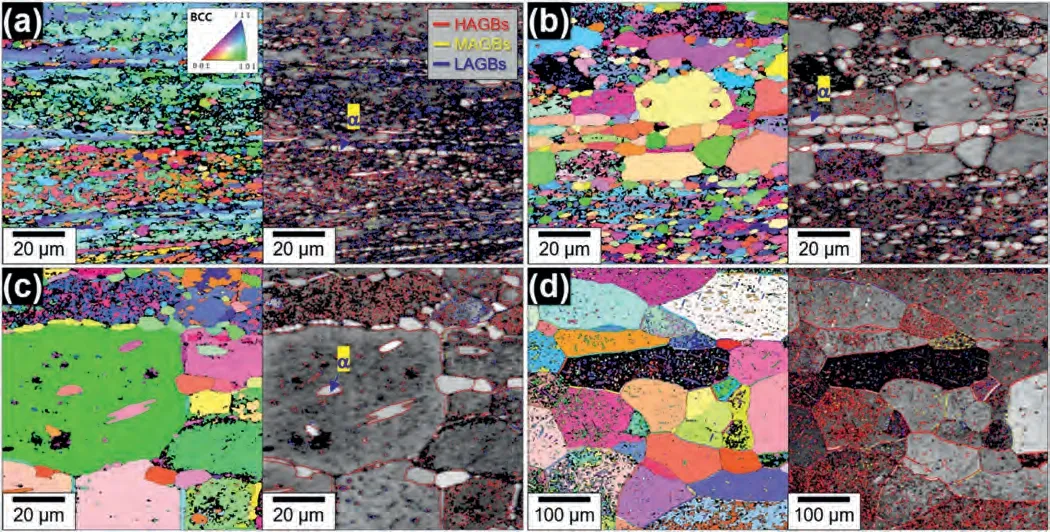
Fig.4.The IPF maps and GB maps for the microstructures of the HRDSR-processed samples after the sample heating and holding for 20 min in the furnace chamber at (a) 473 K,(b) 523 K,(c) 573 K and (d) 623 K.
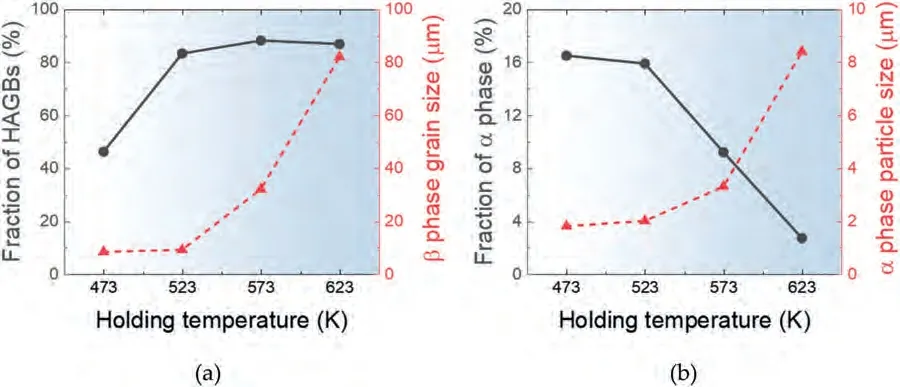
Fig.5.(a) The grain sizes and the fractions of HAGBs,and (b) the sizes and fractions of α phase of the samples annealed after the sample heating and holding for 20 min at different temperatures.
3.2. Superplastic properties and microstructures after superplastic deformation
Fig.6(a) shows the true stress-true strain curves obtained from the SRC test results conducted twice at each testing,ranging from 473 to 623 K,which corresponds to 0.56–0.74Tmof the current alloy.On the other hand,Fig.6(b)presents the plots showing the relationship between flow stress(σ) and strain rate () in log-log format at different temperatures,established using the SRC data in Fig.6(a).At each temperature,the data obtained from repeated cycles consistently show slightly higher stress levels;however,they also exhibit a significant degree of overlap with the data from the first cycle.This outcome supports the reliability of the current SRC test,which is particularly important to confirm when the deformation mechanism is sensitive to grain size.The overlap observed in the repeated SRC data implies that the variation in grain size during SRC testing after prestraining is small at all the testing temperatures.By measuring the slopes of the curves in Fig.6(b),the strain-rate sensitivity exponent (m)values can be determined.The entire dataset showsm≈0.22 both at 473 K and 623 K.However,at 523 K,the data are best fitted withm≈0.4 at low strain rates,while at 573 K,the fit showsm≈0.3 at low strain rates.On the other hand,m≈0.22 provides the best fit for the data at high strain rates at 523 K and 573 K.

Fig.6.(a) The true stress-true strain curves obtained from the SRC test results conducted twice at each testing temperature.(b) The relationship between log flow stress and log strain rate,derived from the SRC data in (a).(c) The plot illustrating the determination of the activation energy for plastic flow (Qc) at a strain rate of 8×10⁻² s-1,where the m is measured to be 0.22 at all the test temperatures as shown in (b).
Fig.7(a)-(d) show the results of the elongation-to-failure tests conducted at various temperatures and strain rates,represented in the form of true stress-true strain curves.All the curves demonstrate strain hardening during deformation.However,at low strain rates at 523 K,the flow-stress behavior at the late stage of deformation is markedly different from what is observed under other conditions.At strain rates of 1×10⁻⁴s-1and 5×10⁻⁴s-1,the flow stress gradually increases during deformation and then decreases up to a strain range of 1.35–1.51.Unexpectedly,beyond this point,the flow stress experiences a rapid increase until the sample reaches fracture.
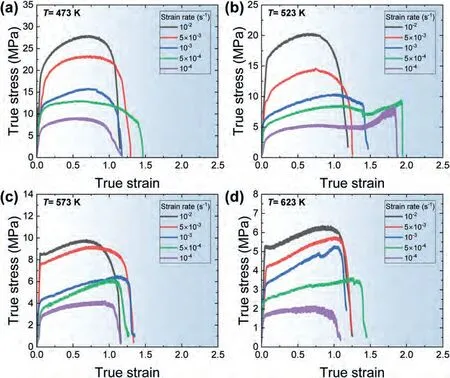
Fig.7.The true stress-true strain curves obtained from the elongation-to-failure tests at various strain rates at (a) 473 K,(b) 523 K,(c) 573 K and (d) 623 K.
Fig.8(a) and (b) show the values of tensile elongation(%) andmplotted against the strain rate at different temperatures,respectively.The observed results indicate the following.First,overall,the tensile elongations are largest at 523 K below 5×10⁻⁴s-1.Second,the tensile elongation increases as the strain rate decreases at all temperatures,reaching its peak value at 5×10⁻⁴s-1,and then decreasing at 10-4s-1.At 523 K,the tensile elongations of 550% and 600%are obtained at strain rates of 1×10⁻⁴s-1and 5×10⁻⁴s-1,respectively,wherem≈0.36∼0.4 is measured at the corresponding strain rates in the SRC tests at 523 K.Third,as the strain rates increase to higher values (>5×10⁻³s-1),the tensile elongations at different temperatures tend to converge to a range of 200–250%.At these high strain rates,m≈0.22 is associated at all the testing temperatures.The good correlation between tensile elongations andmvalues is commonly observed in metallic alloys,and this is because a largermvalue results in increased resistance to necking[42,43].At low strain rates,the tensile elongation decreases as the strain rate decreases(from 5×10⁻⁴s-1to 1×10⁻⁴s-1),despite the increase in the value ofmwith decreasing strain rate.This result may be explained in terms of cavitation and grain growth,which become more extensive at lower strain rates due to the increased available time [43].Fig.8(c) and(d) show the values of tensile elongation (%) andmof the Mg-Li alloys studied by other investigators (some of which are listed in Table 1) at 523 K.These plots reveal the following observations: (1) the tensile elongations of the Mg-Li alloys tend to decrease as the strain rate increases and temperature decreases,and this trend agrees with the trend ofmand (2) the Mg-Li alloys with smaller grain sizes exhibit larger elongations.

Fig.8.(a) The tensile elongation data of the HRDSR-processed LAZ1011 plotted against the strain rate at different temperatures,obtained from the data presented in Fig.7(a)-(d).(b) The m values measured from the plots in Fig.6(b).(c) The tensile elongation data of various Mg-Li alloys [20,23,24,28]plotted against the strain rate at a given temperature of 523 K.(d) The m values of various Mg-Li alloys [20,23,24,28]plotted against the strain rate at a given temperature of 523 K.
To gain insight into the strain hardening phenomenon at low strain rates at 523 K,three samples are prepared: (1) a tensile sample pulled to a strain of 1 at 5×10⁻⁴s-1and then interrupted,(2) a tensile sample pulled to a strain of 1.4 at 5×10⁻⁴s-1and then interrupted and (3) the sample deformed until it fractured(at the strain of 1.9)at 5×10⁻⁴s-1.The gauge regions of the three tensile samples are shown in Fig.9(a)-(c).During the tensile deformation to the strain of 1,significant grain growth occurred,resulting in the size of 15.2 μm.Additionally,cavities have formed at the interfaces between theαandβphases,as well as at the triple points of theβphase.The sample deformed to 1.4 at 5×10⁻⁴s-1,exhibits a further increase in grain size (23.3 μm) and more severe cavitation.In the sample deformed to 1.9,which experienced rapid strain hardening during the late stage of deformation,coarse grains exceeding 50 μm in size are locally observed (Fig.9(c)).Furthermore,the microstructure reveals the agglomeration of theαphase,accompanied by the formation of large voids,primarily within the regions where theαphase is clustered.These observations suggest that the strain hardening observed during superplastic flow is due to dynamic grain growth and the rapid increase in strain hardening during the late stage of deformation is due to accelerated grain coarsening as a result of the agglomeration ofαphase.

Fig.9.The optical microstructures of (a) the tensile sample pulled to a strain of 1 at 5×10⁻⁴ s-1 at 523 K and then interrupted,(b) the tensile sample pulled to a strain of 1.4 at 5×10⁻⁴ s-1 at 523 K and then interrupted and (c) the tensile sample pulled until it fractured (at a strain of 1.9) at 5×10⁻⁴ s-1 at 523 K.
4.Discussion
The constitutive equation for the high temperature behavior of materials is often given in the form of [42–44]:
whereEis the Young’s elastic modulus,kis the material constant,Ris the gas constant,Tis the absolute temperature,nis the stress exponent (=1/m) andQcis the activation energy for plastic flow,which is related to the activation energy for atomic diffusivity.To understand the high deformation behavior of theβphase,it is important to have knowledge of itsDandEvalues as a function of temperature.
The temperature-dependent Young’s modulus of theβphase in Mg-Li alloys is unknown in the literature.For this reason,many researchers have utilized theEvalue for pure Mg (αphase) when analyzing the high temperature behavior of Mg-Li alloys with theβphase as the major phase [7,23,27].In this study,we endeavored to estimate the temperature-dependent Young’s modulus of theβphase by utilizing the data of the room-temperature elastic modulus of the Mg-11Li-1Zn alloy (45.5 GPa [45]) with a composition similar to the one investigated in our study and temperature dependency terms ofEfor Fe,V,Nb,and Mo with BCC crystal structure (-4.48×10⁻⁴(T-300) GPa forα-Fe[46],-1.75×10⁻⁴(T-300) GPa for V [46],0 GPa for Nb [46]and -1.46×10⁻⁴(T-300) GPa for Mo [46]).By using theEat room temperature (45.5 GPa [45]) and the average temperature dependency term ofEcalculated from the BCC metals(-1.92×10⁻⁴(T-300))GPa,Eof theβphase in Mg-Li alloys is formulated as a function of temperature as follows:
This differs from the temperature-dependentEof the pure Mg (orαphase),which is provided in reference of 46:
To determine the activation energy (QL) for lattice diffusion (DL) in theβphase,of which experimental data is currently unavailable,the empirical equation represented by Eq.(4) is used [31]:
whereK0is the structure parameter (K0=14 for BCC [47])andvis the valence electron (v=2 for Mg andv=1 for Li,so the averagevvalue based on their atomic fraction is 1.7).To estimate the activation energyQgbfor grain boundary diffusion (Dgb) for theβphase,a relation ofQgb=0.67QL(for BCC [31]) is applied.Based on the aforementioned analysis,the values ofQLandQgbwere determined to be 110 kJ/mol and 73.6 kJ/mol,respectively.Therefore,DLandDgbforβphase can be expressed using the following equations:
Here,the pre-exponential exponents ofDL0andDgb0for theβphase,which are unknown,are assumed to be 3.1×10⁻⁵m2/s and 7.1×10⁻⁵m2/s,respectively.These values are theDL0andDgb0values of BCC Li [48].
The activation energy for plastic flow (Qc) at a constant strain rate can be determined using Eq.(7),which is derived from Eq.(1).The plot in Fig.6(c) illustrates the determination ofQcat a strain rate of 8×10⁻²s-1,wheren≈4.5(m≈0.22) at all the test temperatures (Fig.6(b)).It is worthwhile to address that the measurement ofQcat low strain rates -is not be reliable,as thenvalues vary at different temperatures.
From the linear slope of the curve in Fig.6(c),theQcvalue is calculated to be 110.7 kJ/mol.This value is very close to the activation energy for lattice diffusion inβphase(110 kJ/mol) calculated using Eq.(4).
Fig.10(a) shows the plot ofb2/DLversusσ/E in loglog format for the samples tested at various temperatures.As observed,the plot exhibits a strong correlation with a single plot atn=4.5,except for the low strain rate data at 523 K and 573 K,where the measured value ofnis between 2 and 4.By fitting the data to the constitutive equation for power law creep withn=4.5,the material constantk1is estimated to be 8.7×10⁹.
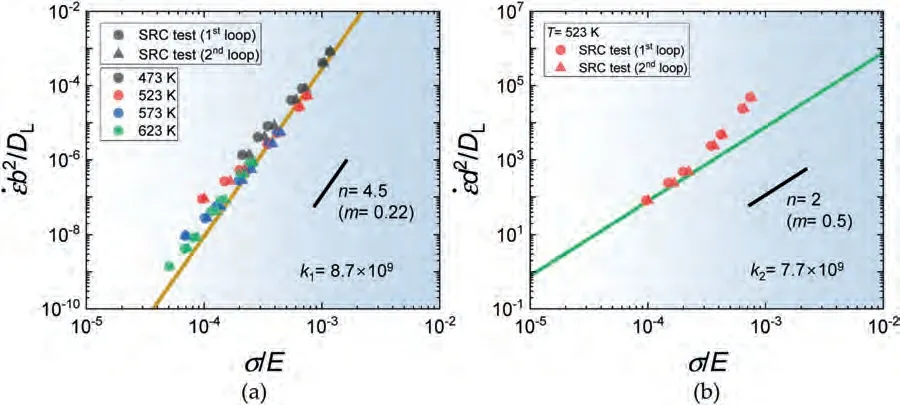
Fig.10.(a) The plot ofb2/DL versus σ/E in log-log format for the samples tested at various temperatures,where b is the Burgers vector (321 pm ([50]))(b) The plot of d2/DL versus σ/E in log-log format,where d is the grain sizes measured after the sample holding for 20 min at each temperature.
This constitutive equation representsDL-controlled dislocation climb creep (DCC) where the associatednis typically between 4 and 5 [49].
Fig.10(b) shows the plot ofd2/DLversusσ/Ein log-log format for the sample tested at 523 K,wheredis the grain size measured after the sample holding for 20 min at 523 K.The data at 523 K show a slope withn=2 at low strain rates,indicating that the material constantk2forDL-controlled grain boundary sliding (GBS),of which the constitutive equation is presented below,is 7.7×10⁹.
Once the equation forDL-controlled GBS is obtained,the constitutive equation forDgb-controlled GBS can be determined using Eq.(9),following the relation ofk3=(xπδ/b)k2[51],wherex=0.01 for many metallic alloys [52].
Fig.11(a) and (b) show the curve fitting to the experimental data at four different temperatures,assuming that the three deformation mechanisms (DL-controlled GBS,Dgb-controlled GBS andDL-controlled DCC) are independent and compete with one another,such that the total strain rate is the sum of Eq.(8),Eq.(9) and Eq.(10):

Fig.11.The fitting to the experimental data using Eq.(11) at various temperatures.Two plots were generated under two different scenarios: (a) one based on the assumption that the grain size remains constant at all temperatures (8.3 μm),and (b) another based on the grain sizes measured after each sample was held for 20 min at each temperature.
Two plots were generated based on two scenarios: one is based on a single grain size (8.3 μm),and the other is based on the grain sizes measured after the sample holding for 20 min at each temperature(473 K:8.3 μm,523 K:9.1 μm,573 K: 32 μm and 623 K: 82 μm).The fitting results indicate a significantly better fit at temperatures above 523 K when the second scenario is applied.When the grain size is assumed to be the same at all temperatures (the first scenario),the region associated withn=2 is expected to extend to higher strain rates as the temperature increases,which is inconsistent with the experimental observation.
Fig.12(a)-(d) depicts the contributions of each deformation mechanism to the strain rate,considering the grain sizes measured after holding the sample for 20 min at each test temperature.At all four temperatures,the strain rate calculated using Eq.(9) is significantly higher than that obtained from Eq.(10).This implies thatDgb-controlled GBS is unlikely to be the dominant deformation mechanism in comparison toDL-controlled GBS over the entire investigated temperature ranges.At 473 K,DL-controlled GBS becomes dominant at strain rates below the lower limit of the strain rate used in the SRC test (10-4s-1).At 523 K,DL-controlled GBS governs plastic flow at low strain rates (10-4s-1–5×10⁻⁴s-1),whereas dislocation climb creep dominates at high strain rates.The contribution ofDL-controlled GBS to the total strain rate at low strain rates is,however,reduced at 573 K despite an increase in temperature.This can be attributed to a significant increase in the grain size by grain growth during the sample heating and holding stage.At 623 K,more significant grain growth during the sample holding period results inDLcontrolled DCC dominating the plastic flow over nearly the entire range of explored strain rates.

Fig.12.The contributions of each deformation mechanism to the total strain rate at (a) 473 K,(b) 523 K,(c) 573 K and (d) 623 K.
A possibility of solute drag creep in the Mg-Li alloy has been suggested by Mineta et al.[53]in the Mg-9Li alloy based on the observation ofn≈3 at low strain rates.Similarly,we observed annvalue of 2∼3 at low strain rates at 523 and 573 K.Therefore,it is worthwhile to consider this possibility.The possibility of solute drag creep in Mg-Li alloys,however,appears to be low for three reasons.First,there is a small size difference between Mg and Li atoms,which reduces the effectiveness of solute drag.The size factor,expressed as,is -0.025 for Mg-Li alloys,whererMgis the atomic radius of Mg (160.2 pm [54]) andrLiis the atomic radius of Li (156.2 pm [54]).In comparison,the Al-Mg and Al-Zn alloys,which are known to exhibit solute drag creep[42,43],have a significantly larger size difference (=0.1187 for Al-Mg alloys and=-0.0580 for Al-Zn alloys whererAl(=143.2 pm [54]) andrZn(=134.9 pm [54])are the atomic radius of Al and Zn,respectively).Second,the breakaway stress,σbreak,required to detach a dislocation from its solute atmosphere for gliding is low for Mg-Li alloys.The value ofσbreakcan be calculated using Eq.(12) [55]:
whereWm(=-1/2π[(1 +ν)/(1 -ν)]G|ΔV| [55]) is the binding energy between the solute atom and the dislocation(whereνis the Poisson’s ratio,Gis the shear modulus calculated asE/(2(1+ν)),ΔVis the difference between solute atom’s volume and average volume of solute and solvent atoms :,whereViis the volume ofielement andriis the atomic radius ofielement andVavg=ΣiXiVi,whereXiis the concentration ofielement),Xsis the concentration of solute,kis the Boltzmann constant.Theσbreakvalues at the testing temperatures of 473 K,523 K,573 K and 623 K,which are calculated usingν=0.331,which the average value of 0.27 forα-Fe [46],0.365 for V [46],0.397 for Nb [46],and 0.293 for Mo [46],Xs=0.304,ΔV=-7.0×10⁻³¹m3,VMg=1.72×10⁻²⁹m3andVLi=1.60×10⁻²⁹m3,are 4.76 MPa,4.30 MPa,3.91 MPa and 3.59 MPa,respectively.These values are close to or smaller than the flow stresses associated with the minimum strain rate of 10-4s-1at 523 K (as shown in Fig.6(b)),suggesting that solute drag creep may be important below 10-4s-1,if it occurs.Third,the activation energy for chemical diffusion coefficient () ofβphase(44.2 kJ/mol) is significantly lower than the activation energy for plastic flow (110.7 kJ/mol): the chemical diffusion coefficient () ofβphase,representing solute diffusivity in the solute drag creep model [56],can be expressed as a function of temperature using Eq.(13),according to the plot in Fig.13,which is constructed using the data from references of [57–60].

Fig.13.The chemical diffusion coefficient () of β phase in Mg-Li alloys as a function of temperature determined using the data from the references of 57–60.
Deformation mechanism maps(DMMs)are graphical models that depict the dominant deformation mechanism in a metallic material under various conditions[61–64].They offer valuable insights into the significance of different deformation mechanisms under specific conditions.The determination of the dominant deformation mechanism is based on evaluating the contribution of each mechanism to the total strain rate.The deformation mechanism that exhibits the highest strain rate is regarded as the dominant mechanism under the specified conditions of temperature,stress,and grain size (as noted in Fig.12(a)-(d)).Fig.14(a) and (b) show the 3D deformation mechanism maps constructed for the Mg-Li alloy presented in the form of log(d)-log(σ/E)-Tand log(d)-log-T,respectively.The maps were constructed using the constitutive Eqs.(8)-(10) in the grain size range of 0.1 μm to 100 μm,the temperature range of 473 K to 673 K,and the strain rate range of 1×10⁻⁵s-1to 1×10⁻²s-1—conditions where superplasticity is commonly observed in Mg-Li alloys.Fig.15(a)-(d) show the log(d)-logtype 2D DMMs,which were constructed at 523 K,473 K,373 K,and 300 K,in the grain size range of 0.1 μm to 100 μm and the strain rate range of 1×10⁻⁵s-1to 1×10⁻²s-1,utilizing the constitutive Eqs.(8)-(10).At 523 K,DL-GBS is dominant in a wide range of grain size.As temperature decreases,Dgb-GBS dominant regime expands to a larger grain size.At 373 K and 300 K,Dgb-GBS dominates overDL-GBS in the whole region.Data from the previous studies on Mg-Li alloys with Li content ≥8 wt.% at various temperatures[7,9,10,12,20,23,28,30,31]are loaded on the map,revealing thatDL-controlled GBS is the dominant deformation mechanism for superplastic flow above 473 K,even at an ultrafine grain size of ∼1 μm.On the other hand,at 373 K,the data for the Mg-9Li alloy with a grain size of 1.5 μm [31],prepared through foil stacking combined rolling,fall in theDgb-GBS regime at low strain rates.TheQcvalue measured in the temperature range including 373 K is 65 kJ/mol [31],which is close toQgb,validating the predictability of the current DMMs.
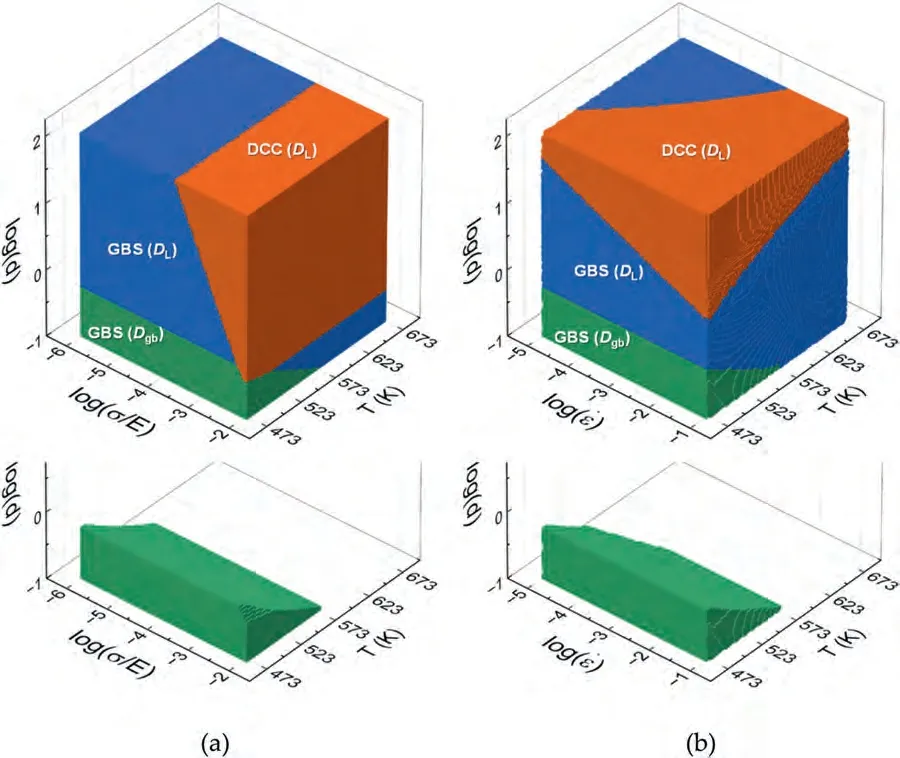
Fig.14.The 3D deformation mechanism maps constructed for the Mg-Li alloy with β phase presented in the form of (a) log(d)-log(σ/E)-T and (b) log(d)-log -T.

Fig.15.The log(d)-log 2D type DMMs for the Mg-Li alloy with β phase at different temperatures of (a) 523 K,(b) 473 K,(c) 373 K and (d) 300 K.
Hart formulated a tensile stability criterion for materials demonstrating both strain-hardening and strain-rate hardening characteristics[65].Based on this theory,the flow localization factorIis defined as:
whereγis the hardening parameter.The criterion establishes that deformation is stable whenIis negative and unstable whenIis positive.Fig.16(a)-(c) shows the plot ofm,γandIfor the samples tested at different strain rates at a given temperature of 523 K.Themvalues as a function of strain were obtained from the series of tensile elongation tests (Fig.7(a)-(d)) by reading their flow stresses at different strains and then applying the linear fit to the data in the plot format of lnσvs.ln.Themvalue exhibits a decreasing trend with increasing strain.This can be attributed to the decreasing dominance of the GBS mechanism,resulting from the increase in grain size due to dynamic grain growth.Theγvalues are initially positive due to dynamic grain growth but decrease with straining.Theγvalue follows a similar decreasing trend at all strain rates.However,an exception occurs at the two strain rates of 1×10⁻⁴s-1and 5×10⁻⁴s-1,where a sudden increase ofγstarts from the true strain of ∼1.3.At all strain rates,the values ofIare negative up to a strain near 0.4,and then they become positive.At high strain rates,the necking remains unstable until fracture.However,at the two low strain rates of 1×10⁻⁴s-1and 5×10⁻⁴s-1,theIvalues start to decrease with straining from the strain of ∼1.3 and reach 0 or become negative at the strains of ∼1.6 due to the effect of increasedγ.This observation indicates that rapid strain hardening during the late stages of deformation enhances superplasticity by delaying necking.

Fig.16.The plot of (a) m,(b) γ and (c) I as a function of strain for the samples deformed at different strain rates at 523 K.
The clustering of theαphase in the Mg-Li alloy during the late stage of superplastic deformation (Fig.9(c)) may be attributed to the high interface energy between theαandβphases,which have different crystal structures.To minimize the overall system energy,theαandβphases separate and cluster together during grain switching by GBS.Rapid grain growth is anticipated in both clustered regions ofαandβphases due to limited presence of the secondary phase pinning grain growth.Therefore,the significant strain hardening observed during the later stages of deformation at 1×10⁻⁴s-1and 5×10⁻⁴s-1is likely attributed to the accelerated grain growth resulting from the phase agglomeration.Larger cavities are more commonly observed in areas where theαphase is clustered.This phenomenon may be attributed to the limited number of slip systems available in the HCPαphase or to the relatively high interfacial energy betweenαandαphases.After superplastic deformation,there seems to be an increase in the volume fraction of theαphase compared to the microstructure before deformation (Fig.9(c)).This could be the result from a strain-induced phase transformation from theβto theαphase.Guo et al.[66,67]reported the straininduced phase transformation in a dual-phase Mg–Li alloy during severe plastic deformation at room temperature.They observed the formation of newly formed lamellar or needle phases in theβ-Li phase.However,noαphase with lamellar or needle shape is observed in the current alloy after superplastic deformation (Fig.9(c)),and there are no reported occurrence of strain-induced phase transformation in Mg–Li alloys at high temperatures.
5.Conclusions
The Mg-10.1 Li-0.8Al-0.6Zn alloy (LAZ1011),mainly composed of BCCβphase at high temperatures,underwent severe plastic deformation and its superplasticity was examined in the temperature range of 473 to 623 K and the strain rate range of 10-4to 10-1s-1.The following results were obtained:
1.After severe plastic deformation by HRDSR,a grain size of 3.2 μm was attained.However,annealing above 523 K led to substantial microstructural coarsening.
2.The highest level of superplasticity was achieved at 523 K and at low strain rates of 10-4-5×10⁻⁴s-1,resulting in tensile elongations of 550–600%.
3.At 523 K,at low strain rates,the dominant deformation mechanism was lattice diffusion-controlled GBS.However,at high strain rates,the dominant deformation mechanism changed to lattice diffusion-controlled dislocation climb creep.At 623 K,lattice diffusion-controlled dislocation climb creep was the dominant deformation mechanism over the entire strain rate range due to the significant grain growth during the sample heating and holding stage before tensile loading.
4.The possibility of solute drag creep under the investigated experimental conditions was ruled out when considering the small size difference between solute and solvent atoms,the low breakaway stresses from the Li solute environment and the low activation energy for chemical diffusivity in theβphase compared to the experimentally determinedQcvalue.
5.Deformation mechanism maps (DMMs) were constructed for Mg-Li alloys,where the BCCβphase is the dominant phase,both in 2D and 3D.These DMMs can predict the results from studies on Mg-Li alloys conducted by other researchers.
6.During GBS,agglomeration of theαphase occurred,leading to rapid grain growth and significant strain hardening during tensile testing.This phenomenon contributed to neck stability but also provided sites for the formation of large cavities.
Declaration of competing interest
The authors declare that they have no known competing financial interests or personal relationships that could have appeared to influence the work reported in this paper.
CRediT authorship contribution statement
H.T.Jeong:Formal analysis,Writing–original draft.S.W.Lee:Investigation.W.J.Kim:Conceptualization,Methodology,Validation,Writing– review &editing.
 Journal of Magnesium and Alloys2024年1期
- Journal of Magnesium and Alloys的其它文章
- Graphene–calcium carbonate coating to improve the degradation resistance and mechanical integrity of a biodegradable implant
- Degradable magnesium alloy suture promotes fibrocartilaginous interface regeneration in a rat rotator cuff transosseous repair model
- Stress-corrosion coupled damage localization induced by secondary phases in bio-degradable Mg alloys: phase-field modeling
- HVOF-sprayed HAp/S53P4 BG composite coatings on an AZ31 alloy for potential applications in temporary implants
- Greatly enhanced corrosion/wear resistances of epoxy coating for Mg alloy through a synergistic effect between functionalized graphene and insulated blocking layer
- High formability Mg-Zn-Gd wire facilitates ACL reconstruction via its swift degradation to accelerate intra-tunnel endochondral ossification
